USDCAD 4/4/2023We can observe that the price is currently trading near a resistance area. There are two possible scenarios that could play out - the price could rebound from the resistance level and continue to trade within its current range, or it could break below the resistance level and potentially begin a downtrend. To help identify potential levels of support and resistance, we can use Fibonacci speed resistance fan tools. These tools use Fibonacci ratios to identify important levels where the price may rebound or pullback.
However, it's important to keep in mind that there are many factors that can influence currency prices, such as economic data releases, geopolitical events, and changes in global market conditions. In the case of the USDCAD pair, both currencies have the potential to be equally strong. The Canadian dollar (CAD) may be supported by soaring oil prices, as Canada is a major exporter of oil. On the other hand, the US dollar (USD) may be supported by improving consumer and labor data, as well as hawkish monetary policy from the Federal Reserve.
Let's wait for some data to be released from the US this week. if it's not good enough, the bearish possibility will be even stronger.
Loonie

USDCAD - LT/MT Idea!CAD - LT/MT Idea!
We have a lot of dollar buying end of flows, end of month. We saw that in most of the majors shifting. What's really key to me is we are seeing US data take a hit US indices, it is time to take into consideration what could happen next with the FX majors. Here's a glimpse of what I think of CAD:
This chart is based purely on Technical aspect.
Currently we within the ranges - Highs: 1.37355 & Lows: 1.32485
A break of highs, we could be forming the pattern W / Break out of wedge/triangle formation
Target areas: 1.38885 & 1.41290
A break of the lows, we break below 50EMA + break out of pattern takes us to 200 EMA + TL
Target areas: 1.30270 & 1.27955
Take into consideration of other FX minor pairs such as CADCHF - Stuck within range, ready to break! There are great opportunities out there for us traders to take advantage, of.
Trade Journal

CAD - Trade idea! CAD - Trade idea!
Another week, another trade opportunity!
USDCAD - Very clear levels.
Currently we are within the ranges. Highs: 1.36600 Lows: 1.35375
A break of key resistance highs, we could go towards 1.37730 areas. However, we if break below the lows and further down below 200 EMA I expect it to reach towards 1.34380.
Keep in mind false breaks out, take a look at crude and most importantly NFP this week!
Trade Journal

USD/CAD turns resistance into supportUSD/CAD trades within a bullish trend on the 4-hour chart, with yesterday’s low forming above a prior resistance level. Prices are also back above the 20-dar EMA and the weekly pivot point, so perhaps we have seen the swing low. Strong economic data from the US could send the pair higher on bets of a more aggressive Fed, with a soft GDP report for Canada also likely to be beneficial to the bullish bias of USD/CAD.

$USDCAD Selling at 1.3460-70 Selling ucad at 1.3460-70 UPPER BOLLINGER BAND
Price is contracting... (Contracting Triangle) end of consolidation about to explode... selling strong... stops above 1.35 1st target 1.3350 then 1.3280

$CAD - Patience $CAD - Interesting...
At this current moment of time we are in a range but - Pattern forming of Flag a break to downside of these ranges to confirm taking CAD towards 1.32/1.31 areas. Good R/R -However, if we break above the TL above 200 EMA would be your target.
Follow your own trade plan.
Trade Journal

USDCAD Bullish Setup - Trade SignalUSDCAD has been sliding within a Complex Corrective Pattern.
This is telling me that an Elliott Wave Impulse could be around the corner.
DXY can bounce for a come-back due to its pending Bullish Divergence.
All other FX-Majors (EURUSD, GBPUSD, USDCHF, USDJPY, AUDUSD, NZDUSD) are onto Reversals.
“Difficult to see; always in motion is the future.” — Yoda
My Loonie Technicals:
* Elliott Wave Complex Correction: Triple Three
* Harmonic Pattern: AB=CD
* 78.6-88.6% Fibonacci Retracement
* 127.2-161.8% Fibonacci Extension
* Demand Zone
* Bullish Divergence
USDCAD LONG Signal:
* Aggressive Entry @ 1.3380 with SL @ 1.3150
* Moderate Entry @ with SL @ 1.3050
* TP1 @ 1.3685
* TP2 @ 1.380
* TP3 @ 1.390
* Safety Measure: when in the green, moving SL to BE.
* BUY Stops on the way up, after pull-backs.
Many pips ahead!
Richard, the Wave Jedi.

CADCHF looking upCADCHF was in a big downtrend but major support zone around 0.67800 made price redirect up
The young Uptrend channel is evolving
Price has bounced today from the lower channel line at 0.68604 and is coinciding with the 50 EMA
So we are most likely waiting for the price to bounce higher up to the 0.692x area. Maybe further to 0.71
To add to this analysis, last week's Thursday and Friday Day candles rejected closes below the 0.69 or 0.688 high levels contributing to the Weekly TF close as a bullish engulfing candle with a positive growth twice the size of the previous week.
===========
* If you like this idea please leave a comment so we can talk about it
* Remember that it´s never a straight line to the target.
* BIG profits to you ALL!!!
===
I am happy and grateful to the Universe
and myself for both teaching me how
to trade and multiply my money by thousands
My money grows every day. Thank you

I Like The BuyI like the buy setup for USDCHF. Just enjoyed the 3day swap long payment and boy is it paying well!
Positive swap long, classic break & retest setup, and NFP on the horizons, expecting a boost from consumer spending & christmas jobs created.
Lets go you good thing yeeeeehaw

CADCHF Short? Well Let's see if the market decides to rangeCADCHF has been in a multi month bearish market. It's now at a resistance level on the daily chart, will we see downside out of this price?
Remember certainty is never present in the markets and boy am I uncertain about this one! Lets see what happens...

Bullish outlook on USDCAD: 29th December 2022On the M30 time frame, a throwback to the support zone at 1.35750, in line with the 23.6% Fibonacci retracement level could see a bounce to the resistance target at 1.36350. Failure to hold above the support zone at 1.35750 could see further downside to the next support zone at 1.35380. Prices are approaching the lower bound of the Bollinger Bands while Stochastic RSI is indicating oversold conditions, supporting our bullish bias.

AUDUSD - Trade SetupHello Dear fellows, How are you doing this Christmas season? i am hoping you all are good and doing great and May GOD safe you all the time.
So let's discuss the Market , As you know i was Seller in this pair in last week , but last week's closing changed the sentiments little bit , and now i am buyer in this pair . if i will get any good opportunity i will notify here in comment box ( Trade updates ) .
Trade carefully so 2023 will bring more success. Best Wishes

USDCAD buying opportunity | 13 December 2022When the EU oil ban took effect on 5 December, USDCAD experienced a sharp spike as investors shifted to a risk-off sentiment and the prospect for oil prices were dimmed. The price increase came to test the 1.35680 resistance zone, where a break above the resistance turned support level extended its bullish trend to the next resistance zone at 1.36850. The market was hesitant at this point and USDCAD came to test this resistance zone twice again, until China announced a significant easing of Covid-19 restrictions on 8 December which raised the prospect of increased oil demand, causing USDCAD to fall back down to the 1.35680 support level. Further declines in prices were halted and reversed when the US released stronger than expected inflation data on 9 December, boosting the prospect of Fed rate hikes. Prices were firmly pushed back up, but came to hover between the 1.36850 resistance zone and 1.36150 support zone. At the present moment, USDCAD has come to test the 1.36150 support zone which is our Entry, where we forecast a bounce back up to the 1.36850 resistance zone where we Take Profit. Dollar is forecasted by the Bank of America to be bullish in the short term up to Q1 2023, while falling oil prices are set to weigh the Loonie down, providing fundamental backing to our uptrend forecast.
Technicals support our bullish bias
-A bullish divergence between prices and Stochastic RSI indicates that prices are headed towards a bullish reversal
-Stochastic RSI has dipped and exited the oversold region
-ADX <25 which suggests that prices are ranging rather than trending. Hence, Stochastic RSI being in the oversold region represents a higher probability for reversal
-Price has exceeded the lower bound of the Bollinger Band, indicating oversold conditions

USD/CAD (To Infinity and Beyond?)View On USD/CAD (8 Dec 2022)
There is something that you oughta know.
The recent run up in the stock markets and fall of USD are fuelled by the expectation/hope on "the pivot" by the FED and the real answer will be on the FED rate decision of the next week.
If the FED fails to do pivoting, I expect the stock market will fall and USD will resume it's UP trend.
And we are already seeing the starting of it.
If the FED does not pivot, it shall send USDCAD to retest the previous high and beyond.
DYODD, all the best and read the disclaimer too.
Feel Free to "Follow", press "LIKE" "Comment".
Thank You!
Legal Risk Disclosure:
Trading foreign exchange or CFD on margin carries a high level of risk, and may not be suitable for all investors.
The high degree of leverage can work against you as well as for you. Before deciding to trade foreign exchange you should carefully consider your investment objectives, level of experience and risk appetite.
The possibility exists that you could sustain a loss of some or all of your initial investment and therefore you should not invest money that you cannot afford to lose.
You should be aware of all the risks associated with foreign exchange trading, and seek advice from an independent financial advisor.
DISCLAIMER:
Any opinions, news, research, analyses, prices or other information discussed in this presentation or linked to from this presentation are provided as general market commentary and do not constitute investment advice.
Sonicr Mastery Team does not accept liability for any loss or damage, including without limitation to, any loss of profit, which may arise directly or indirectly from use of or reliance on such information.

USDCAD LONG Idea 2800 pips Update So Dollar is starting to show strength again. Commodities are falling and so are the indices. This is what I like to see to trade markets but it is December and nearly holidays. Which means this is like trading a Friday afternoon. There are trades. But be careful out there.
USDCAD went a little lower than I expected but not by a whole lot considering I am looking for a low in the market. So not a bad shout in my opinion. It has paid me a few long trades but it wasn't easy to position and I would not position for such a long term. My outlook is starting to show USD strength now and I am still aiming for a lot of pips to the North based on weekly levels I outlined previously.
I also noticed oil is gaining interest in many traders too.....which has an effect on CAD
Follow for more updates on this one in the future. More upside is still the target.
See previous Video released

Good days are ahead for the Loonie tradersUSDCAD is really a worldwide political-news related pair!
OIL is not so predictable these days. there are unpredictable conflicts around the world. But the pair is going to move in a clear channel after following undecidable hours!
REMEMBER! This analysis is valid until any BIG news related to oil market.
I think the bearish setup is more probable here but I make myself ready for the bullish one too!

USDCAD finds initial support, deeper down move eyedUSDCAD fell after completing a bearish Head and Shoulders (H&S) pattern, as expected. Prices are now digesting above support-turned-resistance anchored at 1.3154.
Negative RSI divergence points at ebbing bearish momentum, but that need not necessarily translate to reversal. Rather, it may simply flag a consolidative pause before the down move is reasserted.
The H&S pattern implies a measured-move objective near the 1.30 figure, which looks likely to bring prices within striking distance of major support dating back to mid-2021 (former resistance zone, rising trend line). Time will tell whether this region will mark the place of longer-term uptrend resumption or reversal.

USDCAD - BIG Short Pending - Trade Like BatManUSDCAD is preparing a BIG downtrend.
A bearish swing is pending, with multiple patterns displayed.
Technical Analysis & Patterns:
- Double Top (Traditional Tech.)
- Bearish Bat (Harmonics)
- Wave B Retracement (ABC)
- Bear Flag
- 61.8% Fibonacci Retracement
Many pips ahead and stay awesome Gotham!

USDCAD Targeting A Test of 1.3330Technical & Trade View
USDCAD
Bias: Bullish Above Bearish below 136.50
Technicals
Primary resistance is at 1.3600/50
Primary pattern objective is 1.3330
Acceptance below 1.3460 next pattern confirmation
Acceptance 1.3660 opens a test of 1.3710
20 Day VWAP bearish , 5 Day VWAP bullish
Notes
US CPI released today, volatility expected around the print
Goldman Sachs expects ‘a below-consensus 0.44% increase in core CPI in October (vs. 0.5% consensus), which would lower the year-on-year rate to 6.46% (vs. 6.5% consensus). We expect moderate increases in both food and energy prices to raise headline CPI by 0.49% (vs. 0.6% consensus), which would lower the year-on-year rate to 7.8% (vs. 7.9% consensus)'
Going forward Goldman 'expect monthly core CPI inflation to remain in the 0.3-0.4% range for the next couple of months before edging down to 0.2-0.3% next year. We forecast year-over-year core CPI inflation of 6.2% in December 2022, 3.3% in December 2023, and 2.7% in December 2024. The deceleration we expect in 2023 is driven more by goods than services categories'
According to Scotia Bank 'positioning (among speculative, leveraged accounts and real money investors) could help propel the CAD higher. Combined CFTC positioning data shows a relatively large net CAD short has been maintained among these market participants in recent weeks and the CAD’s rebound risks forcing these accounts to cover, adding further fuel to the CAD rebound’

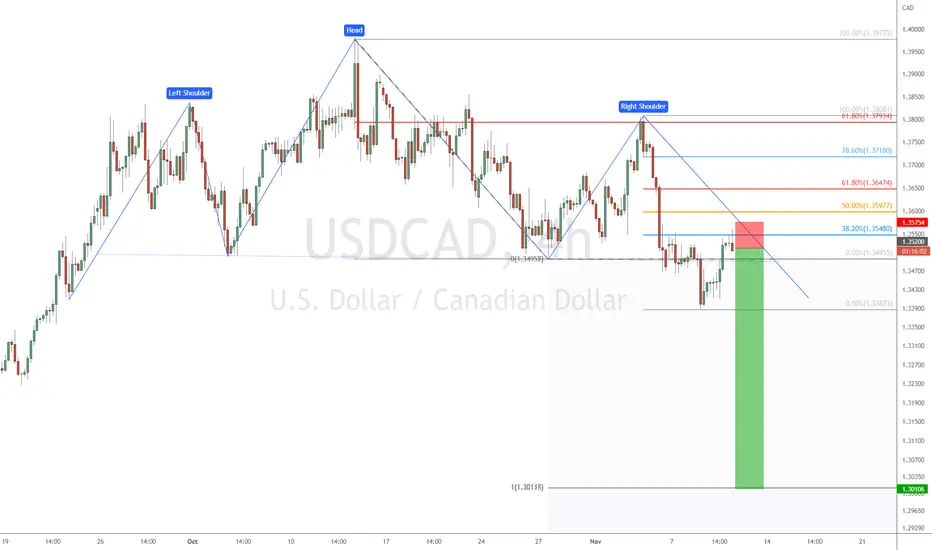
Joe Gun2Head Trade - Head and shoulders top on USDCADTrade Idea: Selling USDCAD
Reasoning: Head and shoulders top on USDCAD
Entry Level: 1.3520
Take Profit Level: 1.3010
Stop Loss: 1.3575
Risk/Reward: 9.19:1
Disclaimer – Signal Centre. Please be reminded – you alone are responsible for your trading – both gains and losses. There is a very high degree of risk involved in trading. The technical analysis , like all indicators, strategies, columns, articles and other features accessible on/though this site is for informational purposes only and should not be construed as investment advice by you. Your use of the technical analysis , as would also your use of all mentioned indicators, strategies, columns, articles and all other features, is entirely at your own risk and it is your sole responsibility to evaluate the accuracy, completeness and usefulness (including suitability) of the information. You should assess the risk of any trade with your financial adviser and make your own independent decision(s) regarding any tradable products which may be the subject matter of the technical analysis or any of the said indicators, strategies, columns, articles and all other features.
Update to USDCAD Long Idea 2800 pipsAS mentioned last week. We came right down into the gap highlighted last week. Beautiful reaction off there. Video shows a breakdown of what I was looking at today on a 1min chart
I did long the position but i will not be holding for the whole 2800 pips. First of because thats crazy haha and 2ndly I have nearly hit my target on the prop account I'm trading it

USD/CAD -8/11/2022-• USD/CAD risks of suffering severe losses if the 1.35 support breaks
• Head and Shoulders bearish pattern in play, with neckline support at 1.35, where bears and bulls are fighting now
• A confirmed and successful break of the mentioned level exposes the pair for a projected target around 1.31 (range between neckline and head)
• Typically, a head and shoulders pattern's right shoulder is found to have lower peak than the left one, a condition fulfilled here
• Trading recommendations:
Sell at current level with stop loss above recent highs or 1.355-1.36 with TP at 1.31 --- Risk reward: 4:1

BUY THE DIP: Inflation Month Is Back. USDCAD Likely To Rise!As the eye can see, DXY is consolidating against all major currency pairs. Meaning its likely taking a slight breathing room before the major uptrend resumes. With the major CPI report due this week, all the eyes would be without a doubt on the numbers that would print. Anyhow there are two likely scenarios here that might take place and how it would affect the DXY:
SCENARIO 1: CPI PRINTED AS EXPECTED
If the CPI is printed as expected or slightly lower, it means that the FED'S weapon to lower the inflation is working slowly slowly however the numbers would still be considerably high near 8% YOY which is way way above FED'S target. This would mean that the FED might continue to raise rates to lower the inflation but not that aggressively. Meaning the DXY would still be more attractive compared to other currency long term. So its still bullish
SCENARIO 2: CPI PRINTED HIGHER THAN EXPECTED
If the CPI prints a lot higher than expected lets say it becomes 8.3% or higher, then we could practically assume that the FED'S tool is not working and they would likely take a more aggressive stance . The market's reaction at this point of time would be to BUY the DXY which would make the DXY appreciate.
Of the above two scenarios, number 1 seems to be more likely and practical. Shall scenario 1 take place, we can expect the DXY to consolidate and give us a buying opportunity at a good price.
TECHNICAL ANALYSIS ON USDCAD LONG TRADE
Here we have USDCAD weekly chart, we can likely expect this pair to retrace lower which would give us an ideal entry before the major uptrend resumes. Kindly for the technical analysis have a look at the main chart.
Trade Safely & Cautiously
