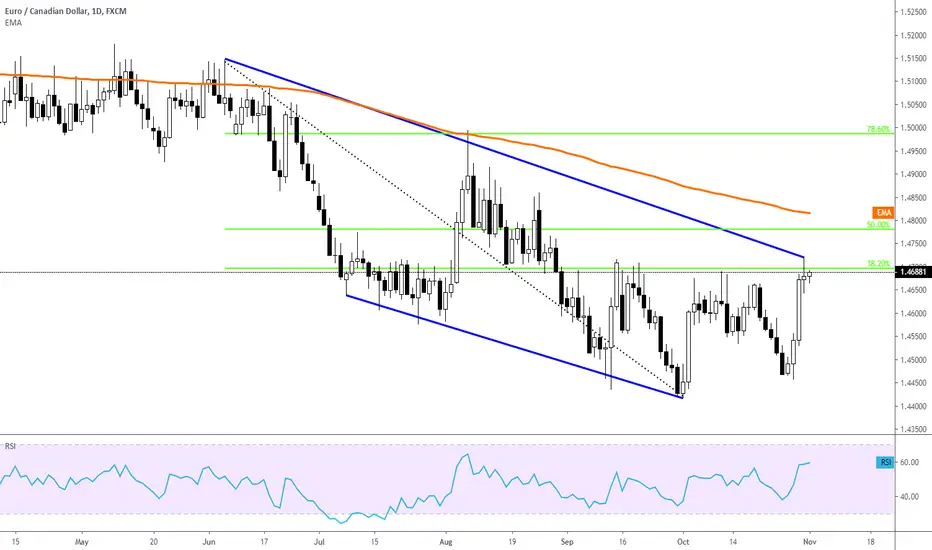
Loonie's turnHaving reached the 38.2 Fibonacci retracement, the pair price is facing resistance there. As such the Canadian dollar might take the technical advantage and bring the price down to 1.4650 and then 1.4630.
Loonie
USDCAD Long Position.This is my first time trading this pair i will be playing my tricks on this. But for my knowledge this is a long for me.
If you have the same idea as me. You can Go long with me.

Buy the rumors sell the news. Real life example AUSSI VS LOONIEAfter last week's elections, relatively strong domestic data and perceptions of stable (or even stimulating) fiscal policies were sufficient to keep the doves in the bay for BOC and I assume loonie was performing well throughout months because this thing was already known by smart players. Most of the position was well placed in the loonie side for months by smart traders and was a " buy the rumors " case for market (hoping for steady monetary policy from the bank and rumors around buying in optimistic of BOC) and now when the actual date central bank had announced which also ended up being steady, no cut, no dovish and as expected! but market just turned opposite for the pair or we can say any pairs which have loonie as counter or base acted just opposite against the loonie and ended up being " sell the news " (even knowing it was steady release, no cut, no dovish now everything has already been priced in, juice sucked up so profit-booking by closing of position creating back new fresh demand in another side and doesn't matter what was released and what only matter was to sell on news). Priced reached in such a level where everyone fears to hold longer and where smart people thought good place to book the profit which creating good demand and is indeed in a demand level where nothing can stop from rising upward rather than falling back deep. Aussie has been doing well lately along with the EURUSD and GBPUSD and has a high potential for trending upward talking about the longer time horizon (which we can evaluate from AUDUSD performance). Oil future seems not well too and if loonie is really done, for now, juice has been sucked up months before then a pullback of this downtrend is what not a surprising thing which we may see in future days.

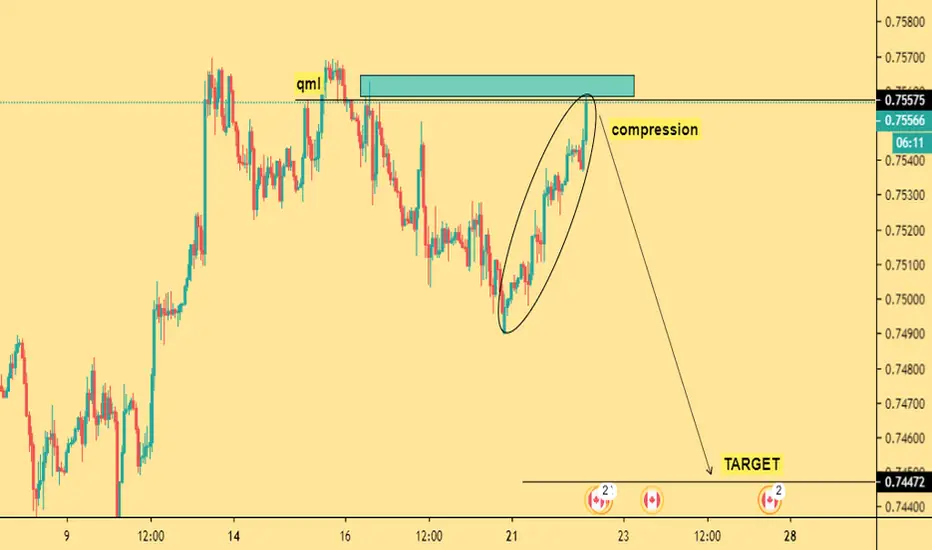
CADJPY Pullback?It seems exhausted and testing a minor supply zone of a higher timeframe. It doesn't seem favorable to call at the point for an Intra or swing perspective. May have some pullback if those big boys are happy about to book their half profit from last week long. No matter what the outcome be tonight for BOC but I assume everything has been priced in well at this point and price may work differently even if its positive release for loonie technically seems exhausted bull. What you all think to share you thought on loonie too if you had.


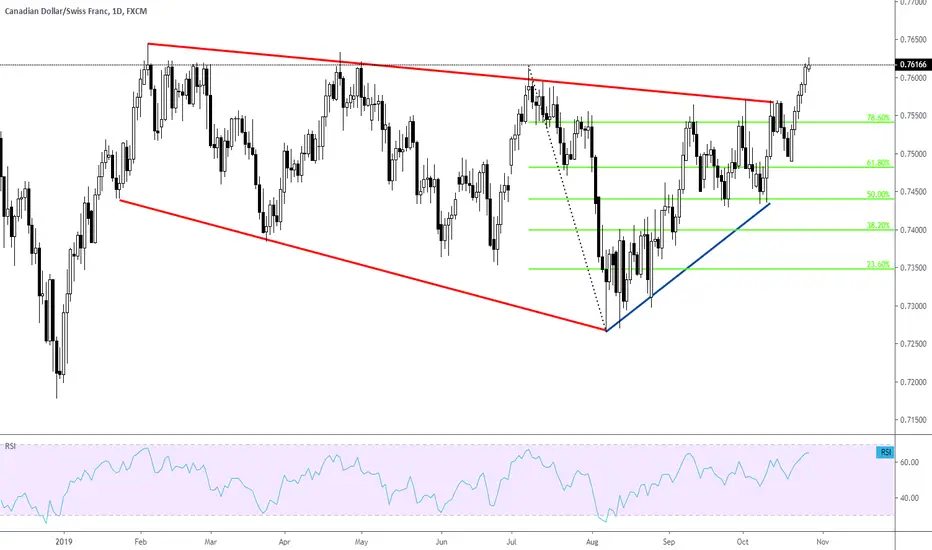
Potential turn from the upper sideCanadian dollar continues its now week-long rise ahead of the BoC monetary policy meeting. In technical terms, the increase might face strong resistance at 0.7635 and then 0.7645. A return however from the current pricing should take us down to 0.7600 and then 0.7575.
Kinda smelling bear over here?!Brexit uncertainty spirals back after the Bojo sad defeat on his plan. October 31 will be extended for a small-time period seem so and PM Johnson can blame the opposition for mucking up the schedule . The EU is in no hurry. Is it 10 days or 3 months? Who knows. Break below the horizontal trendline of the descending triangle should only consider the future bearish movement in price.

GBPCAD mid term ideaSigns of a no-deal Brexit rising and/or stable government outcome from the Canadian should bring GBPCAD on bear side for the short term at least. In that case, a break below monthly pivot r2 may be some case which we may see in the near future.


ORBEX:GBPUSD, EURUSD, USDCAD - Exit Or Extension? Trudeau Wins!In today’s #marketinsights video recording I analyse #GBPUSD, #EURUSD and #USDCAD!
Another failed Johnson attempt to get Parliamentarians to vote supports the #pound as now chances of an extension increase! Both an October exit (highly unlikely) or an extension could see mainly #pound and in a smaller degree #euro gain.
Meanwhile, in Canada Trudeau won the elections again! This is likely to weigh on technicals more as fiscals are going to remain unchanged..
Stavros Tousios
Head of Investment Research
Orbex
This analysis is provided as general market commentary and does not constitute investment advice


USDCAD looks good.(Golden FIB level Rejected)as you can see from the chart,everything clicks in just right. currently holding.

The Loonie vs. 7 year trend lineCanadian dollar is very close to break the 7 year trend line. If so, I have mentioned potential targets.

LOONIE Likely to Test 1.31600 Level After Trendline Break!Hello Viewers, this is an instant trade signal! Therefore, please have a look at the main chart for the following vital trade details:
• ENTRY POINT
• STOP LOSS
• TAKE PROFIT
• RISK TO REWARD
The setup may look simple but I can assure you it is NOT. There are various in depth technical and fundamental analysis incorporated behind the execution. I would very much love to explain these two aspects here but doing that would consume ample amount of time which could affect the appropriate entry point behind this trade! So, to keep it simple the main chart just displays the simplified technical view of this trade.
My way of performing technical analysis basically starts by breaking down the monthly Timeframe down until the One Hour charts. The following are the aspects I focus most on when performing technical analysis:
• Draw Support & Resistance through key common psychological levels on M & W Charts. This helps me to see where the price might stall or breakout.
• Draw Trendlines to determine the dynamic support and resistance levels present on the charts. This helps me to determine where the price might stall and most importantly help determine the path of least resistance behind the active trade.
• I also tend to use EMA 50 on all the Timeframes. This EMA 50 is proficiently proven to act as dynamic support and resistance and is vital behind all my analysis.
• Lastly, I tend to use classic pivot levels to determine my entry, stop loss and take profit levels. The combination of this and all of the above helps me determine the precise and likely trade targets behind the setup.
Another aspect of my way of analysis is reading a lot of news to determine the fundamental aspects affecting any trade. After the technical analysis is performed, I tend to match if the fundamental aspect really supports my technical analysis.
Therefore, as you could see, putting all my thoughts here would surely take up a lot of time which could make the price drift away from the entry price thus affecting the Risk to reward ratio. I understand it is vital for many of you to know the details behind this trade setup, and so if you are interested you could send me message and I will try to share most of what I can!
The Above words are just template I use in all my trades. Shall there be any updates I will provide them here. Thank you

ORBEX: GBPUSD, USDCAD: Surprise on the US-Sino and Brexix FrontsIn today's #marketinsights video recording I analyse #GBPUSDand #USDCAD FX Majors!
GBPUSD records best day in months
- Johnson-Varadkar see "pathway to deal" by end of October
- Despite GDP and MAnufacturing data disappointed
USDCAD down on tradewr optimism
- Trump changed mind and now is open to a partial deal
- Willing to and will meet He on Friday to resume talks
- Cad stronger as oil supported by positive headlines (China is big oil importer)
Looking forward to Canada's employment report!
Stavros Tousios
Head of Investment Research
Orbex
This analysis is provided as general market commentary and does not constitute investment advice

EUR CAD BUY (EURO - CANADIAN DOLLAR)Hi there. Price is forming a continuation pattern to the upside. Wait for the price to complete the pattern and watch strong price action for buy.

CADPJPY Short?Long term downtrend remains in play. Price remains below 200EMA and Stochastic crossover points to a move south. I am currently on the sidelines on this pair but leaning towards a bearish move.


Update : USDCAD Plan 25/9/2019This updated plan in reference to this post :
Price has closed below Monday low and softly tapped the liquidity pool (marked in the chart). My bullish bias for USDCAD is weaker I have to admit (strictly based on technical analysis) but I will still look for LONG today until the charts tell me otherwise.
There is Home Sales data for the U.S and no risk events for Canada today

Update: GBP/CAD - 1000 Pips Achieved (More to Go)*Yellow = 200 EMA | Blue = 100 EMA
This update is for OANDA:GBPCAD . I predicted (accurately) that price would find support at ~1.58165 , and it successfully rebounded off of this is level and has found resistance at ~1.65918 . We currently pushing off this resistance level and first found support around mid-August.
The close on Friday (Sept 20th) is critical because it is a strong bearish candle with a relatively large tail looking similar to a bearish hammer pattern. This is printing on a resistance level which is both horizontal and diagonal. The horizontal is the standard resistance at ~1.65918, but the diagonal is a trendline drawn from peaks in Mid-January 2016, Mid-March 2018, and late December 2018. On top of that, price is attempting to cross the 100 EMA which can act as additional resistance.
What to look for?:
a) Tenkan-Sen and Kijun-Sen are on the rise along with a Kumo Flip. This is clearly bullish and could mean any resistance OANDA:GBPCAD is facing is minimal, and these 2 moving averages (Conversion and Base) could act as support on a retracement.
b) Keep an eye on Fib Levels for support on a retracement specifically 0.382 and 0.5 - These levels have been used as support for retracements off this support in the past (January and September 2017).
c) RSI(14) shows that this pair is still not overbought and could easily continue upward which moves in confluence with other factors which indicates only minor resistance.
Good luck Traders!

GBPCAD ShortDivergence strikes again! It's only a matter of time before this corrects. Pulling back and looking at the Daily and Weekly charts, you will also notice it has reached the supply zone. Moreover, MASSIVE bearish pinbar going to close today. GBP has also rallied across the board on simply rumor of an orderly Brexit without an definitive details. This is very much going to be a "buy the rumor, sell the fact" situation.
