Update: GBP/CAD - 1000 Pips Achieved (More to Go)*Yellow = 200 EMA | Blue = 100 EMA
This update is for OANDA:GBPCAD . I predicted (accurately) that price would find support at ~1.58165 , and it successfully rebounded off of this is level and has found resistance at ~1.65918 . We currently pushing off this resistance level and first found support around mid-August.
The close on Friday (Sept 20th) is critical because it is a strong bearish candle with a relatively large tail looking similar to a bearish hammer pattern. This is printing on a resistance level which is both horizontal and diagonal. The horizontal is the standard resistance at ~1.65918, but the diagonal is a trendline drawn from peaks in Mid-January 2016, Mid-March 2018, and late December 2018. On top of that, price is attempting to cross the 100 EMA which can act as additional resistance.
What to look for?:
a) Tenkan-Sen and Kijun-Sen are on the rise along with a Kumo Flip. This is clearly bullish and could mean any resistance OANDA:GBPCAD is facing is minimal, and these 2 moving averages (Conversion and Base) could act as support on a retracement.
b) Keep an eye on Fib Levels for support on a retracement specifically 0.382 and 0.5 - These levels have been used as support for retracements off this support in the past (January and September 2017).
c) RSI(14) shows that this pair is still not overbought and could easily continue upward which moves in confluence with other factors which indicates only minor resistance.
Good luck Traders!
Loonie

GBPCAD ShortDivergence strikes again! It's only a matter of time before this corrects. Pulling back and looking at the Daily and Weekly charts, you will also notice it has reached the supply zone. Moreover, MASSIVE bearish pinbar going to close today. GBP has also rallied across the board on simply rumor of an orderly Brexit without an definitive details. This is very much going to be a "buy the rumor, sell the fact" situation.

USD/CAD shaken after drone attackThe pair started the week with a wide gap following news about a drone attack on Saudi's Aramco which lifted oil prices and its correlated currencies such as the Canadian dollar.
The fact that the pair hasn't been able to fill the gap around 1.3270 suggests that this up channel on hourly charts might break to the downside targeting 1.320, 1.3150 and below if the recovery of the oil market takes longer than expected.
Keep an eye on the latest headlines regarding this incidence, and the FOMC on Wednesday.
Good luck

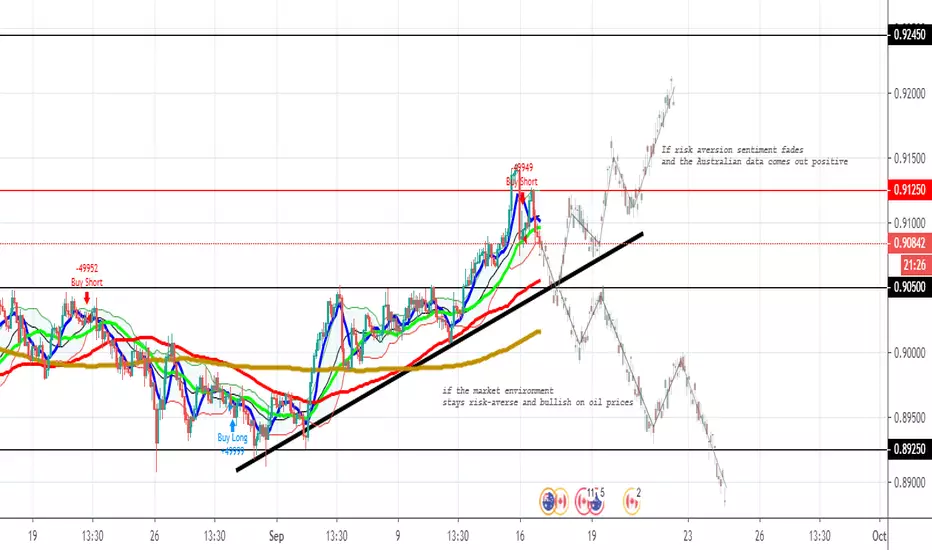
AUDCAD willing to long or short?!Loonie strength from the spike in oil prices and risk aversion sentiment likely pushing down the Aussie dollar. We actually saw the price above
the 0.91250 last week but this morning on Asian session bears on the pair quickly jumped on that opportunity to short AUD/CAD once again.
Going forward, volatility could stay up on AUD/CAD as we will likely continue to see further developments on the Saudi attacks, and we may even get help from upcoming economic updates from both Canada (manufacturing sales) and Australia (RBA meeting minutes & home prices). So, depending on how those economic updates flash out, we could see types of setups for both the bulls and the bears.
If we're bear on this pair, there are a couple of technical setups to watch if the market environment stays risk-averse and bullish on oil prices. Strong resistance has formed around the (0.9125) area where price retested nearly before the European session. Seller dragged price lower once again. We’ve got to watch the broken older resistance area (0.9050). A break lower there would likely draw in momentum sellers in this environment, and the potential R:R would be attractive around the previous swing lows (0.8925).
If we're bull on this pair, the short-term trend higher is in our favor and this pullback lower could be a fresh buying opportunity. If risk aversion sentiment fades and the Australian data comes out positive, then a break above the resistance (0.9125) is our cue to start working on a long position plan. The next potential resistance area July 2019 highs (0.9245), so the potential return-on-risk of a swing trade looks very attractive around that level.
Cheers!
USDCAD WAVE ANALYSIS 14 SEP 19HI Friends,
USDCAD currently trading on complex corrective pattern. I am expecting shortterm trend will continue upto 1.3340 level to complete wave B.
Short term BUY UPTO 1.3340 .
ENTER SHORT @ 1.3340 -- TP @ 1.3100 -- SL @ 1.3400

CRUDE OIL & USD Weakness Might Send LOONIE Towards 1.29500!INSTANT ENTRY AT AROUND: 1.31800 LEVEL
POSITION TYPE: SHORT
STOP LOSS: 1.34200
TAKE PROFIT: 1.29500
RR: 1:1
SHALL THERE BE ANY UPDATES I WILL UPDATE THEM IN THE THREAD. BELOW YOU CAN FIND THE EXPLANATION BEHIND THIS TRADE SETUP
The main chart shows the price confined in a upward slopping channel on the weekly TF which has been respected on multiple occasions. At the moment we could see that the weekly candle not only breached the lower end of the channel but also close below the crucial dynamic support of the weekly 50 EMA!. This suggests that the price is ready to potentially head down towards the 1.29500 level where another concrete upward trendline is presents.
Furthermore, the sanctions imposed by U.S on iran and further ongoing dispute has already made WTI price rise higher. Further tensions are to be expected in the future which would potentially make WTI jump higher. CAD is strongly correlated with OIL prices and any move in the OIL prices would move the LOONIE in the same direction. Additionally The USD weakness will likely gather pace in the coming weeks as prospect on economic slowdown and rate cut has hit the greenback very bad.
Therefore we have at the moment both technical and fundamental picture on our sides. as the days go we will see the news develop further and see the a clear picture.


USDCAD remained heavy USDCAD has remained heavy after posting a 24-day low at 1.3191 yesterday, which extended the correction from the two-and-a-half month high that was printed on Tuesday at 1.3382.
The recouperation in risk appetite in global markets, with the U.S. and China headed back to the negotiating table, has been a positive for the Canadian Dollar, and other commodity currencies. Oil prices are up over 2% from week-ago levels (WTI futures). Resistance comes in at 1.3270-73. The dual releases of U.S. and Canadian employment reports will naturally bring directional risk to USD-CAD. The August U.S. payrolls is expected to show resilience in the labour market, anticipating a a 165k August headline rise that about matches the 164k July increase, with the jobless rate ticking down to 3.6% from 3.7%, alongside gains of 0.3% for both hours-worked and hourly earnings.
The Canadian employment report has us expecting a 30k gain in August after the 24.2k drop in July, with the jobless rate holding steady at 5.7%. As-expected data shouldn't have much bearing on USD-CAD.
Disclaimer : This material is provided as a general marketing communication for information purposes only and does not constitute an independent investment research. Nothing in this communication contains, or should be considered as containing, an investment advice or an investment recommendation or a solicitation for the purpose of buying or selling of any financial instrument. All information provided is gathered from reputable sources and any information containing an indication of past performance is not a guarantee or reliable indicator of future performance. Users acknowledge that any investment in Leveraged Products is characterized by a certain degree of uncertainty and that any investment of this nature involves a high level of risk for which the users are solely responsible and liable. We assume no liability for any loss arising from any investment made based on the information provided in this communication. This communication must not be reproduced or further distributed without our prior written permission.

USDCAD Likely To Test 1.3000 Amid Stubborn BOC and Risk ON Mood!The main chart shows the WEEKLY TF of USDCAD pair. There was a neat ascending channel that was violated a few months ago and the price went to test around 1.30200 level. Since then the price has been steadily rising until it HIT 1.33600 level. This created a short term ascending channel which was clearly violated a couple of days back and now the price is likely to target 1.3000 level.
The above chart shows the DAILY TF of USDCAD, which shows the channel has been violated and its potential target!
The main chart shows the price has been confined in a triangle and the price is likely to target the lower end of the trendline which lies at around 1.3000 level.
To support this technical aspects, the fundamental aspects also align neatly together. First of all the Bank of CANADA left the interest unchanged and continue their wait and see approach rather than just easing like the other central banks. This is bullish for the LOONIE, however i feel the price will hit 1.3000 level after which the bank will start to be dovish and the price will likely bounce and test the 1.34000 level in the future. To add to this, the demand for OIL at the moment is adequate as the talks of trade deal continue. Since OIL is the major driver behind this CAD pair, if the talks continue to progress well we could see LOONIE get stronger.
I am already short on USDCAD since 3 months ago when the main weekly channel broke, however the price only HIT 1.30200 level before reversing. My take profit at the moment is 1.3000 with SL at 1.34000. Should you wish to enter you can do so if and only if the RR is 1 or greater than 1. Cheers

EURCAD - Sell Small Position at Market after BOC!Despite the rally in risk assets, the negatives that sent the EUR lower have not changed. The economic gloom in Europe remains and, despite the north-south divide on the ECB board, many still expect policy easing, if not in September than before year-end as Christine Lagarde ascends to the presidency. Thus EUR/CAD is likely to continue to trend lower. Larger option expiries above current spot should help to cap too.
At the same time, the Bank of Canada came out with a less dovish statement yesterday, which should boost the Loonie in the near-term.
Sell a small position at market as we are breaking through the previous support zones from August.

EURCAD Weekly Trendline Violated! Price Likely To Target 1.43500Have a look at the main weekly TF for EURCAD. The horizontal lines represents support and resistance levels taken from the monthly TF. The July's monthly candle closed below 1.47000 support and additionally the August's Candle formed a strong doji rejecting and closing below the 1.47000 support. This is a strong indication that the price would likely gather pace towards the next support present at 1.43500. Furthermore, the Longterm trendline on weekly and monthly charts was violated, Further suggesting a decline is on the cards!
The chart above is Monthly TF charts of EURCAD indicating the LONG-TERM Trendline violation and monthly candle breaching and closing below the support.
Fundamentally the EUR is bound for further incoming weakness as the ECB is struggling to hit their inflation target and the new incoming president has already suggested the rates could further go into negative territory in order to support the growth.
I am already SHORTING the EURCHF, which has slight correlation to this pair and furthermore i am already SHORT on the USDCAD. Due to these factors and i am not willing to take this trade because it would increase my risk exposure and violate rules of trading. For those of you who would like to take this pair SHORT, you could do this at your own risk with the target of 1.43500 and RR of 1:1. This trade in my view is a high probability trade with many confluence factors in favor of us. cheers

USDCAD WAVE ANALYSIS 30 AUG 19Hi Friends,
Finally USDCAD fell below 1.3300 handle. As per my wave count i looking for wave c of this corrective structure fell upto 1.3166 support zone.
ENTRY & EXIT LEVELS
Short @ Market || SL : 1.3335 || TP 1 @ 1.3198 -- TP2 @1.3166

USDCAD LONG - INTRA DAY SUCCESSFULAnalysis team placed long on USDCAD @1.32659 with 2 intra day targets on 27th August, 2019:
TP1 @1.3277
TP2 @1.3291

USDCAD- Plan to go longUSDCAD approaching our demand zone on 4h.
In our experience Supply and Demand zone act like magnets.
Price has tested the supply zone and now we are on our way to the demand zone. We initiate long there with stops just below the zone.

The LoonieSell the break out. New lows with at least 400-500 pips down trend. Then we will see 1.25. Check out my previous post about this pair.

CAD in rally on Canada's CPI grow By Andria Pichidi - August 21, 2019
USD-CAD fell to 1.3250 from near 1.3300, matching Monday's low, following the warmer Canada CPI figures. The pairing had been on the decline from the 1.3315 level seen in London morning trade, taking its cue from WTI crude, which rallied to seven-session highs of $56.94 from post-close lows of $55.91. Between firm oil and risk-on conditions, USD-CAD should remain under pressure for the time being. Support is at the 20-day moving average of 1.3236 now.
Disclaimer: This material is provided as a general marketing communication for information purposes only and does not constitute an independent investment research. Nothing in this communication contains, or should be considered as containing, an investment advice or an investment recommendation or a solicitation for the purpose of buying or selling of any financial instrument. All information provided is gathered from reputable sources and any information containing an indication of past performance is not a guarantee or reliable indicator of future performance. Users acknowledge that any investment in Leveraged Products is characterized by a certain degree of uncertainty and that any investment of this nature involves a high level of risk for which the users are solely responsible and liable. We assume no liability for any loss arising from any investment made based on the information provided in this communication. This communication must not be reproduced or further distributed without our prior written permission.

GOING TO SELLMY CONFLUENCE ARE 1. Positive Expectation for Canadian news on Tuesday 2. The Bullish pin bars on the daily 3. The penetration of the bullish trend line


USD/CAD ASCENDING BREAKOUT!Price Action (Technical Analysis): We see Sellers are beginning to gain confidence as price was rejected when entering our Resistance Zone. It is common to see Price Copy its Previous Pattern, we seen price attempt in the same pattern to break our Weekly Resistance and instead brought back down, Buyers are attempting to break above one more time but from what I see, price broke out of the Weekly Bullish Trend and i'm anticipating price to pull back before continuing short.
Fundamental Analysis: Buyers and Sellers are very attracted to this Currency Pair especially after the recent week we just had with Major News all week. US Border Talks are causing a High Volatile Market with Investors high interests in Commodities + Safe Havens also due to the stirred pot of news last week that brought a lot of uncertainty.

USD Strength to come? Ichimoku USD/CAD Long Trade SetupThis pair has been holding it's bullish run, despite it being a bit slow to the upside. At the end of last week broke below tenken sen support so my eyes are now shifting to watch the price interaction at kijun sen. I am watching for a good support candle to form at or near kijun for a chance to get back long, aiming overall for previous price structure highs. I've drawn out some partial take profit levels along the way. If we fail to hold support at or near kijun sen, this setup may become invalidated.

GBP/CAD sets up >1000 Pip Play! *Yellow MA = 200 EMA | Blue MA = 100 EMA
In this video, I go over the approaching support level for OANDA:GBPCAD and the potential play to the top of the consolidation box set after the reversal we see from January 2016 - October 2016. A play from the support to resistance is well over 1000 pips and has two different opportunities:
1. We bounce off of more recent support
2. We bounce off of all-time low
I'm looking for both options to play to the top of the box and move price action within that same range again. This support is extremely strong and could lead to a very profitable play, especially since the RSI shows us the pair is oversold with bullish divergence, characteristics of previous plays in this zone. The resistance I outline is from old support and fib levels, but both this resistance and fib levels have been broken on previous bounces off the same support.
Good luck traders!


USDCAD Trading idea August 2019All info written on graph
Sell on daily
Swing trade to to break 1.30 psychological level
