USDCAD Bullish Because It Has Room to Rise Before it CrashesWe're all green for 5 to 90 day exponential moving averages, RSI and stochastic both signal we have room to go before a short. This was is a long, but not its a few day trade for a scalp so keep your eyes on your screen.
For more, check out www.anthonylaurence.wordpress.com
Loonie

CADJPYTREND: DOWN(Continuation)
- WAIT FOR BREAKOUT
- WAIT FOR PULLBACK
- EXECUTE WITH SOLID CONFIRMATION

CADJPY, LOONIE Might Break The Channel to Test 84.3000 Vs YEN Once the channel breaks together with the daily 50 EMA, we can expect the price to go north and test the weekly 50 EMA which lies at 84.300 level. the blue line support is derived from the monthly charts and its a concrete support which has been rejected and the price shows it might climb up. For this to happen the channel must break.
This just represents my analysis of the pair, shall there be any updates in the future regarding trade entry i will post them in a new thread. cheers

GBP CAD SELL (POUND STERLING - CANADIAN DOLLAR)Hi there. Watch strong price action at the current price for sell.

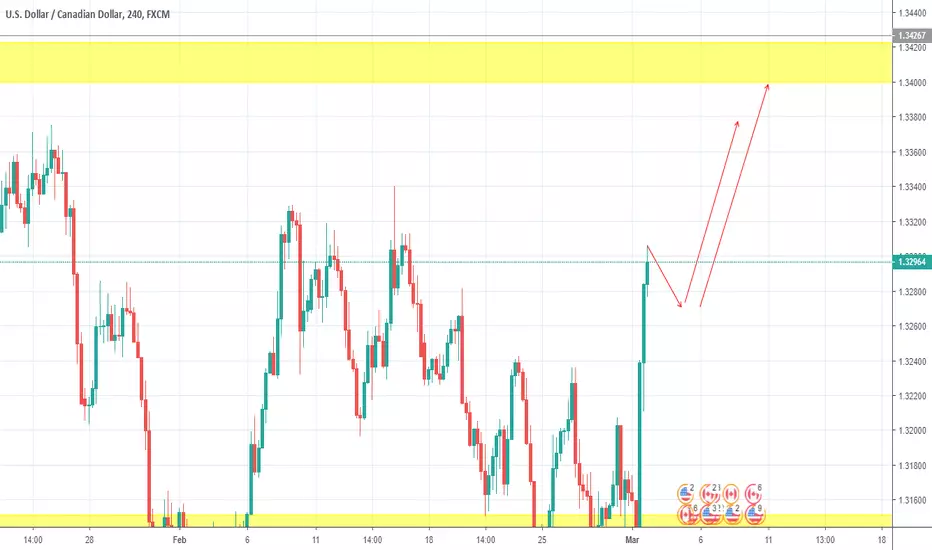
USD/CAD Technical AnalysisUSD/CAD eases from 2-week tops. But This pair still struggling around 1.3420, below is support line 1.3390 and then to the March 13 and 15 high near 1.3370.
Weakness below the 1.3400 mark could get easily extended towards the 1.3370-65 intermediate support en-route the 1.3335-30 region.
Also we are expecting Dxy to go short. But wait for further confirmation during from begining of ny session. Good luck!! Enjoy the lovely weather Londoners ...)
uk.tradingview.com

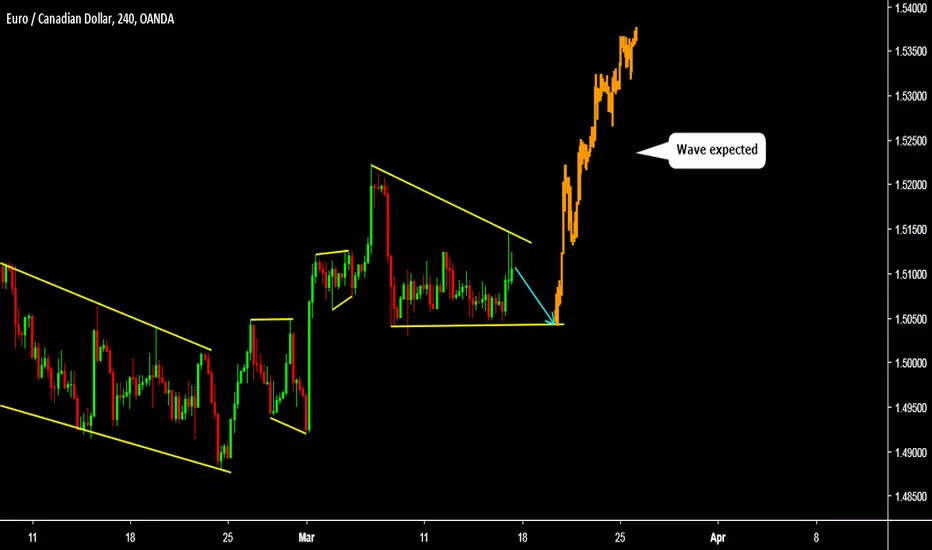
EUR CAD BUY (EURO - CANADIAN DOLLAR)Hi there. Price is forming a continuation pattern to the upside. Wait for the price to hit the bottom of the pattern and watch strong price action for buy.

EUR CAD BUY (EURO - CANADIAN DOLLAR)Hi there. Price is forming a continuation pattern to the upside. Wait for the price to hit the bottom of the pattern and watch strong price action for buy.

USD/CAD (Southern Bound)View On USD/CAD (15 Mar 2019)
In mid/long term, USD/CAD shall go a lot lower but I do not really like the current price level.
That will be better if we can take short from level such as 1.35. That will be perfect.
Sooner or later, it shall go to 1.3261, 1.3229, 1.3166.
DYODD, all the best and read the disclaimer too.
Feel Free to "Follow", press "LIKE" "Comment".
Thank You!
Legal Risk Disclosure:
Trading foreign exchange or CFD on margin carries a high level of risk, and may not be suitable for all investors.
The high degree of leverage can work against you as well as for you. Before deciding to trade foreign exchange you should carefully consider your investment objectives, level of experience and risk appetite.
The possibility exists that you could sustain a loss of some or all of your initial investment and therefore you should not invest money that you cannot afford to lose.
You should be aware of all the risks associated with foreign exchange trading, and seek advice from an independent financial advisor.
DISCLAIMER:
Any opinions, news, research, analyses, prices or other information discussed in this presentation or linked to from this presentation are provided as general market commentary and do not constitute investment advice.
Sonicr Mastery Team does not accept liability for any loss or damage, including without limitation to, any loss of profit, which may arise directly or indirectly from use of or reliance on such information.

AUDCAD - 11/3/19Currently at resistance level. However, it could still go up to test the bigger move. Either way, let's wait for more confirmations to sell.


USDCAD: Contrarian perspective. Loads of crowds are heading north on USDCAD. I don't follow crowds - sorry. In this screencast, I show my rationale for a contrarian perspective based on patterns in USDCAD (1D) and weakening in US-Dollar (1D) trend strength. I'm currently exploiting a 30 min time frame microtrend and willing to take a controlled loss (aka stop-loss), to limit how wrong I may be. I've focused on US-Dollar moves which is a limitation of this assessment.
There are no predictions here, as I operate without targets.

EUR CAD SELL (EURO - CANADIAN DOLLAR)Hi there. Price is forming a continuation pattern to the downside. Wait for the price to hit the top of the pattern and watch strong price action for sell.

USD CAD SELL (US DOLLAR - CANADIAN DOLLAR)Hi there. Price is forming a continuation pattern to the downside.
We are already from the top. If you are not in, wait for the price to complete the continuation pattern that its forming on lower time frame and watch strong price action for sell.

EUR CAD SELL (EURO - CANADIAN DOLLAR)Hi there. Price is forming a reversal pattern to change its direction. Watch strong price action at the current price for sell.

GBP CAD SELL (POUND STERLING - CANADIAN DOLLAR)Hi there. Price is forming a continuation pattern to the downside. Watch strong price action at the current price for sell.

Loonie Potential BUY ?The USD/CAD pair gained nearly 100 pips in a matter of minutes after the data published by Statistics Canada revealed that the Canadian economy contracted 0.1% on a monthly basis in December.
The report showed that the real GDP's annual growth rate in the fourth quarter slumped to 0.4% from 2% in the third quarter and missed the market expectation of 1.2%.
And there was big drop of West Texas oil Prices.
Buyers can sit comfortably if the US Dollar index strengthens further and oil prices drop to the $50 area .
From my point of view trading this pair will be supported by fundamentals and the pair is set to retest the 1.34 range within the month of March >' '<
USDCAD Short positionUSDCAD is showing some bearish mood right now following gold and maybe soon oil.
Here is my TA, is my point of view I would love to hear what you think about it or just to know your point of view on the pair.

CADCHF ShortSwiss Frank is currently consolidating around the 1.00 area.
The crosspair is near a critical resistance area with multiple rejection ,
huge possibilities to go near 11th February low if it breaks 0.75800 level.

EUR CAD BUY (EURO - CANADIAN DOLLAR)Hi there. Price is forming a reversal pattern to change its direction.
Watch strong price action at the current price for buy.

USDCAD: Large corrective structure - down then upThis pair has been trapped within a large complex correction between 1.38 and 1.20.
This move down started for the top could breakdown support soon to pass all the way down into 1.20 area to tag former valley.
Then another seesaw move before the final drop occurs.

LOONIE Looking To Hit 1.29000 Level. OIL The Main Driver!Oil is the main driver behind the CAD pairs and with the OIL market slowly recovering aided by the sanctions on Venezuela's OIL exports by the US and the cooperation among the OPEC AND NON-OPEC Producers. Many see the OIL market recovering in the near term and to further strengthen the technical picture, there is an already completed head and shoulders pattern on the US OIL chart.
The greenback has started this year strongly but with FED pausing the rate hikes and thinking to start unwinding of their balance sheet later this year gives the USD modest strength to perform this year. However if compared to LOONIE, the greenback is not that strong based on fundamental picture for time-being.
Looking at the main chart for the USDCAD pair, the weekly timeframe has confined the price to a long term trendline. Should the weekly trendline break together with weekly 50 EMA the price will likely be heading to test the lower trendline present at around 1.29000 level!
Shall the criteria meet, i will update the trade details in a new thread. this just represents my analysis on this current pair. cheers

CAD JPY SELL (CANADIAN DOLLAR - JAPANESE YEN)Hi there. Price is forming a continuation pattern to the upside. But first price needs to complete one more move to the downside.
So, watch strong price action at the current price for sell.
