CAD buoyed by weaker oilBy Andria Pichidi - December 7, 2018
EURCAD plunged to 1 .51 area from 1.5250 high following the combined stellar Canada jobs report, and a softer US employment outcome. As an added bonus for the CAD, oil prices surged higher on news that OPEC+ have agreed to a production cut.
The breakout of S1 and the 20-period SMA in the 4-hour chart are, likely to lead to a retest of S2 and S3. Meanwhile, momentum indicators are also supporting that negative intraday momentum, as RSI just crossed below 50 and MACD turns negative. This is suggesting consolidation in the short term.
Therefore, Wednesday's low and S2 could be the next immediate Support area for the pair , at 1.5030- 1.5065 .
Immediate Resistance level for EURCAD is set at 1.5225 , while the next Resistance is at the 200-day sMA at 1.5275 .
Andria Pichidi
Market Analyst
HotForex
Disclaimer: This material is provided as a general marketing communication for information purposes only and does not constitute an independent investment research. Nothing in this communication contains, or should be considered as containing, an investment advice or an investment recommendation or a solicitation for the purpose of buying or selling of any financial instrument. All information provided is gathered from reputable sources and any information containing an indication of past performance is not a guarantee or reliable indicator of future performance. Users acknowledge that any investment in FX and CFDs products is characterized by a certain degree of uncertainty and that any investment of this nature involves a high level of risk for which the users are solely responsible and liable. We assume no liability for any loss arising from any investment made based on the information provided in this communication. This communication must not be reproduced or further distributed without our prior written permission.
Loonie

Short NZDCAD @ 0.9220; TP @ 0.9036, SL your choiceShort NZDCAD @ 0.9220; TP @ 0.9036, SL your choice

CAD JPY BUY (CANADIAN DOLLAR – JAPANESE YEN)Hi there. Price is forming a continuation pattern to the upside. Wait for the price to hit the bottom of the pattern and watch strong price action for buy.

USD CAD SELL (US DOLLAR – CANADIAN DOLLAR)Hi there. Price is forming a continuation pattern to the downside on lower time frame. Watch strong price action at the current price for sell.

AUD CAD BUY (AUSTRALIAN DOLLAR – CANADIAN DOLLAR)Hi there. Price is forming a continuation pattern to the upside. Watch strong price action at the current price for buy.

CAD JPY BUY (CANADIAN DOLLAR – JAPANESE YEN)Hi there. Price is forming a continuation pattern to the upside. Watch strong price action at the current price for buy.

CAD CHF SELL (CANADIAN DOLLAR – SWISS FRANC)Hi there. Price is forming a continuation pattern to the downside. Wait for the price to hit the top of the pattern and watch strong price action for sell.

EUR CAD SELL (EURO – CANADIAN DOLLAR)Hi there. Price is moving impulsively to the downside and currently is forming a continuation pattern to the downside. Wait for the price to complete the pattern that it’s forming and watch strong price action for sell.

USD CAD SELL (US DOLLAR – CANADIAN DOLLAR)Hi there. Price is still on the reversal pattern to change its direction. Wait for the price to hit the top of the pattern and watch strong price action for sell.

OPEC-JMMC Day: Oil and Loonie – Tentative moves?By Andria Pichidi - November 20, 2018
USDCAD and USOil, H4 and Daily
USOil prices reached an overnight high of USD 57.44 per barrel. The 4-day run higher in Oil prices, after a period of sharp declines, has helped the Canadian Dollar find a toehold. The contract has been supported by talk of a proposed production cut into year-end by OPEC and Russia, which was the main drive of yesterday’s sharp move higher, ahead of the December 6 meeting to be held in Vienna.
Bloomberg reported that Russia is in wait and see mode with regards to production cuts, quoting Russia energy minister Novak as saying producers need to “better understand both the current conditions and the winter outlook” before agreeing to cuts.
WTI crude is softer today, with prices having fallen back to levels just under $57 per barrel, after a 4-day rebound phase. Meanwhile USDCAD has retreated around the day’s Pivot Point at 1.3170 after pegging a 3-session high at 1.3202 yesterday. This puts Friday’s 12-day low at 1.3126 back in the scopes.
In the daily time frame, the cross has been seen moving within an ascending triangle since mid October, rebounding yesterday away from its lower trend line. As the price holds above the rising trend line, USDCAD remains in strong bullish sentiment in the medium picture. Only in case of a penetration along with the break of 20-day SMA and 23.6% Fib. level since October’s dip, would it find a Support level within 1 .3065-1.3078 area (38.2% Fib. level and 100-day SMA.)
Currently however, the market seems to be in a bullish mode overall, given that USDCAD is still trading above all the daily SMAs and with momentum indicators holding in the positive area. RSI has flattened above neutral and MACD dropped slightly below the trigger line, but remains well above zero line. Hence despite the fact that in the long term bullish bias holds strongly, in the near future, some consolidation is possible based on the flat RSI and small decline in MACD but also on the fact that 100 and 50 day SMA have been flattened in the daily chart. Resistance to the upside is set at yesterday’s high at 1.3200.
A jump above this resistance level could meet November’s high of 1.3263 . Further increases could move the price towards the 1.3300-1.3320 area.
As CAD and Oil are vulnerable to the possible OPEC plans to cut production, any remarks today from officials attending the OPEC-JMMC meeting, will weigh on the two assets. Nevertheless, BoC Wilkins speaks later today as well.
Andria Pichidi
Market Analyst
HotForex
Disclaimer: This material is provided as a general marketing communication for information purposes only and does not constitute an independent investment research. Nothing in this communication contains, or should be considered as containing, an investment advice or an investment recommendation or a solicitation for the purpose of buying or selling of any financial instrument. All information provided is gathered from reputable sources and any information containing an indication of past performance is not a guarantee or reliable indicator of future performance. Users acknowledge that any investment in FX and CFDs products is characterized by a certain degree of uncertainty and that any investment of this nature involves a high level of risk for which the users are solely responsible and liable. We assume no liability for any loss arising from any investment made based on the information provided in this communication. This communication must not be reproduced or further distributed without our prior written permission.

CADJPY Big LongGreat RRR on a potential (loose) Three Drives Formation on CADJPY. Trend-line hit on a Daily Support zone , potential Double Bottom . Lovely S&R within the lower channel of this traditional pitchfork. Look for the 127% Extension for an Maximum TP before the big drop.

EUR CAD SELL (EURO – CANADIAN DOLLAR)Hi there. Price is still on the continuation pattern to the downside. Wait for the price to hit the top of the pattern and watch strong price action for sell. Next week probably CAD will rise. So, that probably can give us the down move that we are waiting for.

NZD CAD SELL (NEW ZEALAND DOLLAR – CANADIAN DOLLAR)Hi there. Price is forming a reversal pattern to change it’s direction. Wait for the price to hit the top of the pattern and watch strong price action for sell. We forecast that the down move will be corrective or will form a continuation pattern to the upside. Let’s wait and watch how it behaves.

USD CAD SELL (US DOLLAR – CANDIAN DOLLAR)Hi there. Price is still in the reversal pattern. So, wait for the price to hit the top of the pattern and watch strong price action for sell. Is the safest place to take a trade.


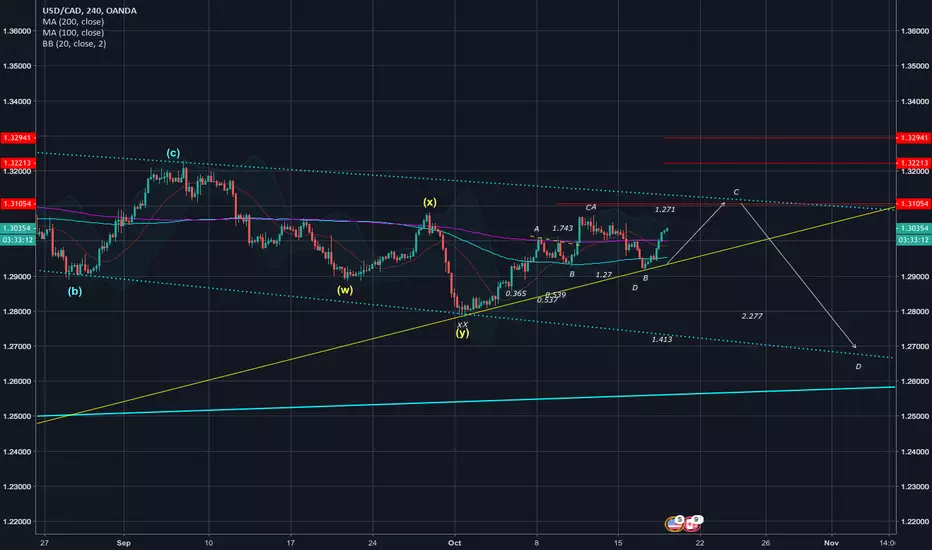
Usdcad to the southhhhhh!!!!!!the pair to complete wave c of minor wave 2 of big wave (2). turning south in the coming session will activate the scenario.

Daily hammer off Fib supportFine bullish hammer (pinbar) off 38 Fibonacci support. There are bullish engulfing and bullish harami patterns at previous candles as well. I expect price to shoot to the next Fib extension. Trendlines after CLOSE. MFI (14) oscillator confirms long position( turned from oversold up).

$USDCAD To 1.31? USDCAD have been trading in a bearish channel for weeks. This time it is most likely heading to the upper part of that channel.
Happy Trading, folks!
Cheers!
usdcad shortlooks like usdcad is in for a retracement after a very strong dollar. price has broken its trend, currnently retesting, and im going to go short on the pair.

USD/CAD came to retest the newly formed resistanceUSD/CAD has developed a nice bearish momentum after breaking the 4h timeframe trendline (around 1.30000). We are also in a descending channel on daily timeframe so the overall bias on the Loonie is bearish. The price has made a huge drop all the way to the 1.2920 area where it has found support. With the move to the downside yestersterday we have also broken the support that was set in the 1.2955 area and the price has now came to retest it. This sell zone has confluence with 50.0% fib retracement from the move yesterday and also a bearish flag/wedge pattern. Happy trading everyone!

USDCAD BreakoutLoonie has broken up out of the descending channel for the second time, and is sitting just above a long time support level. The direction of its impulse will be shown when it either breaks through the support or bounces off. May very well depend on market sentiment on how USMCA implementation will go

[GBPCAD] BULLISH OUTLOOK HOLDS?GBPCAD, H4
UK August trade data revealed a bigger than expected deficit, of GBP 1.3 bln in the total trade figure, with the visible goods deficit coming in at GBP 11.2 bln. In the 3 months to August, the ex-inflation total trade deficit narrowed GBP 6.1 bln to GBP 0.8 bln, which was driven by both a narrowing in the goods deficit and an expansion in the services surplus. Meanwhile, UK August production data came in mixed today, with the broad industrial output headline slightly exceeding expectations with 0.2% m/m and 1.3% y/y growth while the narrower manufacturing production measure underwhelmed somewhat with an unexpected 0.2% m/m contraction.
More timely September surveys, such as the PMI reports, have painted a relatively dimmer picture, with Brexit-related uncertainty taking a toll on confidence and crimping new investment. Even though the cloud of uncertainty over Brexit weighs on Sterling, today’s Brexit news boosted Sterling higher. A London Times article claimed that 30 Labour party MPs would reportedly back Prime Minister May’s Brexit plan at the last minute, if needed, to avoid a no-deal Brexit scenario, suggesting that there could be enough votes for the plan to pass a parliamentary vote, as this would offset Tory party rebels who are planning to vote against it.
Cable managed to eke out a 2-week high at 1.3185, 15 pips below upwards handle as mentioned in yesterday's post. As the Pound remains on bid since the news release and in contrast with the mixed economic data front, most of the sterling crosses present the same performance. GBPCAD for example is currently retesting the immediate intraday Resistance level at 1.7060, which is just few pips below the 78.6% Fib level since the dive from 1.7200. The pair remains above 20- and 50-day SMA, for the fourth consecutive day.
However, our focus turned on GBPCAD today, on the break of the 1.7038 level. Interestingly, this level coincides with the 2 consecutive upper fractals in the 4-hour chart but also with the 38.2% Fibonacci retracement level since July's decline from the 1.7771 high. This along with the fact that the pair moves within the upper Bollinger band pattern and 20-period SMA crossed above 200-period SMA, added further positive bias in the near future.
Technically, the same bullish picture is seen in momentum indicators, as RSI just crossed 70 barrier, indicating that there is further space to the upside. MACD presents a positive to neutral picture as MACD lines are flattened within the positive area, something that implies short term consolidation or weak momentum.
Based on the positive outlook that GBPCAD presents so far, further upside movement is anticipated, with next Resistance levels at the round 1.7100 and 1.7165 level (200-day SMA). Immediate Support holds at the confluence of the 20-period SMA and 61.8% Fib. level, at 1.6975. Medium term Support level is set at 1.6920-1.6930 area (200-period SMA and 2low fractals).
In the alternative scenario that bears push GBPCAD lower, only a closing into the lower daily Bollinger Band pattern, below the 1.6950 level, could drive the price to the 1.6830 Support level reached on Friday. Such a break could confirm the possibility of significant losses and it will alert the retest of the 2-month triple bottom at 1.6595.
Andria Pichidi
Market Analyst
HotForex
Disclaimer: This material is provided as a general marketing communication for information purposes only and does not constitute an independent investment research. Nothing in this communication contains, or should be considered as containing, an investment advice or an investment recommendation or a solicitation for the purpose of buying or selling of any financial instrument. All information provided is gathered from reputable sources and any information containing an indication of past performance is not a guarantee or reliable indicator of future performance. Users acknowledge that any investment in FX and CFDs products is characterized by a certain degree of uncertainty and that any investment of this nature involves a high level of risk for which the users are solely responsible and liable. We assume no liability for any loss arising from any investment made based on the information provided in this communication. This communication must not be reproduced or further distributed without our prior written permission.

USD/CAD - Ichimoku Long Trade SetupAfter a sizable drop USD/CAD is back near the top of the kumo. Tenken and Kijun have gone a little flat here meaning we've lost some momentum, but I am watching for a possible bullish breakout here this week. I would still like to see a bullish kumo twist complete to help confirm a buy entry as well as a move up above our previous resistance we've been seeing. We've got a good risk to reward here once we see those things happen. It may take another drop down to tenken sen or the kumo before that possible move up even happens, if it happens at all. If we fail to hold support or get the breakout we're looking for, this setup may become invalidated.
