Loonie

USD/CAD Daily Update (8 June 2017) * Bull Traces SeenIt is true that we are in DOWNtrend for USD.
But I am seeing the reveesal of this pairs due to the sell off Oil.
It can swing back to 1.3660.
Trade Safe,
s0nic

USDCAD- Market structure. Last week USDCAD was in a counter trend pullback on a decline in oil prices. Price was in an ascending channel making higher highs and higher lows. A weak NFP report for USD caused the end of the rally closing the week at support and the bottom of the channel around 1.35. Start of this week price has already moved below the support making a new low at 1.34500 and bounced. A few scenarios to take place over the week are as follows and are related to the fundamentals of USD & CAD dollars and correlated mainly to the price of US Oil:
Technical Analysis:
There are 3 possible scenarios: 1) Oil up > USDCAD down. 2) Oil falls to support @ $46 then rises > UCAD rises to resistance at 1.35500 and falls (double top reversal pattern). 3) Oil continues to slide below $46 to $45 > UCAD tests the major supply zone (not yet tested), if Oil breaks these zones UCAD will start another uptrend making HH and HL.
Fundamental Analysis:
1) Weaker dollar (Weak NFP, Weak Data, Lower chance of FED rate hike, geopolitical issues (terrorism), etc). 2) CAD news (news this week for CAD, should be better than previous news releases, waiting on pending data to be released.) 3) Oil prices (OPEC continuing to slash production for another 9 months, if oil inventories are continuing to fall Oil should rise). Trying to get oil back to $50/barrel.

USDCAD - PIPS FOR DAYSLast time we looked at usdcad we rode this badboy down. it has hit the trend line and we can now place our buys for a long term ride up.

USDCAD - Dont Blink or you'll miss itLast one for the night.
USDCAD has had me fooled with this incredible climb it did for about a month straight. Spotted the channel it was in and realized that it to has reached the top. It is currently now consolidating but it won't be long now until it drops back to the lower trend line.

USD/CAD ShortUSD/CAD is looking good for short at a good resistance level with a good R:R
Subscribe for future free trade ideas.

AUDCAD REENTRY SELLI have been reentry sell position at 1.01982 and wanting to hold short until 0.99576 . after the market open hoping to gap down below because of the French Election this Sunday.

Usd-Cad Short ScalpUSDCAD Short Term Short Scalp/
USDCAD has rallied a lot and it needs some retract to pick more orders.This is a good short term scalp opportunity with a good R:R


The beginning of a new uptrend? Hello Traders,
The previous week offered a decent intra-week opportunity for me to short oil for a 2 day hold on the short (covered on Friday at daily 200 MA).
Now on to longer time-frame opportunities with oil and oil related assets. Overlaid on the chart is an area chart of WTI Crude Oil (ticker: /CL). With the potential for further weakness in the black gold we can see the Canadian Dollar trade lower thus pushing USD/CAD above 1.3600 opening the way for the currency pair to trade back up to 1.400 - 1.4500 continuing the trend higher.
Keep an eye on crude breaking/bouncing on the ascending trend-line and daily 200 MA.
The trade:
No position until we get Daily close above 1.3600.
Upon a break I'm committing 1% risk to the position.
Stop placement will be determined upon a break above 1.3600.
Moving Averages:
We remain bullish on the bullish 10EMA/50MA crossover.
Trading well above Weekly 200 MA.
"A man does note have to marry one side of the market till death do them part." - Edwin Lefèvre
Monthly Bar Chart:
Daily Bar Chart:

USDCAD Be patient before taking any order :)
If the price breaks the trend line by reaching 1.35 you can BUY. Today the Loonie will either obey the Channel or the Triangle.


USD/CAD Daily Update (12 Aor 2017) *Bear LiklyI am seeing Bear to continue to dominate this pair.
I will be standing with BEAR as long as the price is below 1.341x region.
Trade Safe,
s0nic

CADJPY long CAD JPY shows the Compression Buy characteristics:
1. Supply is all clear
2. Shows a sloping angle which is a high probability to go up.
3. There is a big news impact for CAD - GDP m-m
this shows my analysis of CADJPY , please trade carefully guys.

Short for around 5-6 hoursCAD usually goes down starting 0100 am for several hours before London gets in the game. There is no indication this wont happened again. Only if the oil price continue to drops which will put the loonie in better position.

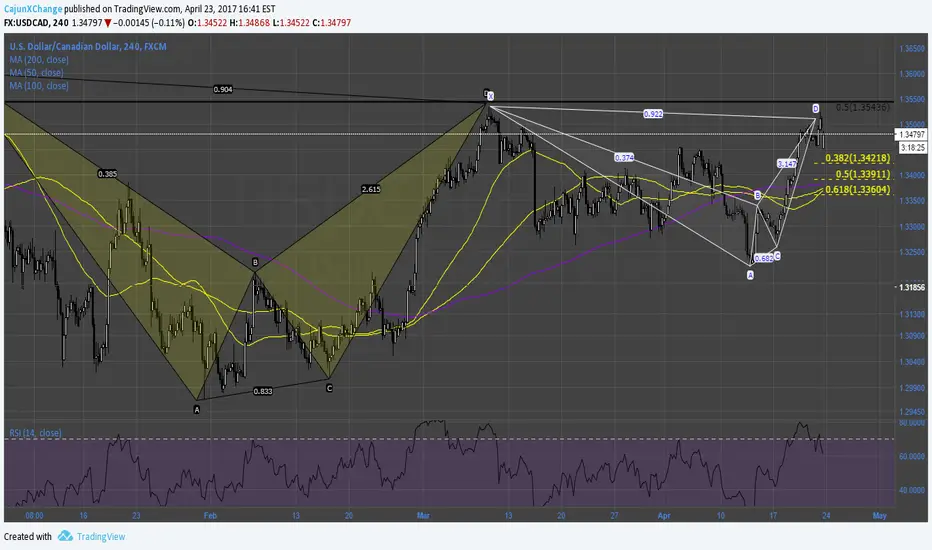
USD/CAD Daily Update (13/3/17) *Seeing Possible Swing to 1.336USD/CAD still anice uptrend for me in mid and longer timeframe.
But for now, I am seeing 1.336x as a possible swing back down level, as short term swing, and we gotta how the market react from the level.
Trade Safe,
s0nic

USD/CAD H4/Daily Update (17 Feb 2017)It is not that I am Bullish on USD, it is more of I am bearish on CAD. And they are *sort of inversely proportional to Oil price (E.G. Oil Down, USD/CAD up)
Watch 1.3110 level first. If it is broken strongly. I will go up Higher.
Trade Safe,
S0nic

AUD/CAD possible double top - go shortLooks like a possible double top on the Ozzie vs Loonie. Price tested the initial close high at about 1.0065 twice. There is a strong bearish divergence on the RSI, so let's see if the bears can hold and drive the price lower.
Stop-loss at 1.0110 - this is 10 pips higher than the 1.0100 level.
First take profit level at 0.9850
Hoping for second take profit level at 0.9650


GBPCAD a doomed house without bear trap?letZtry;)
4HR EMA seems saved the bears but i prefer this direction atm:)
