LRC/USDTI’m not sure if there’s a specific method of analysis for this, but it’s clear how precisely the coin reacts to these levels.
That’s why I dare to assume we won’t go any lower.
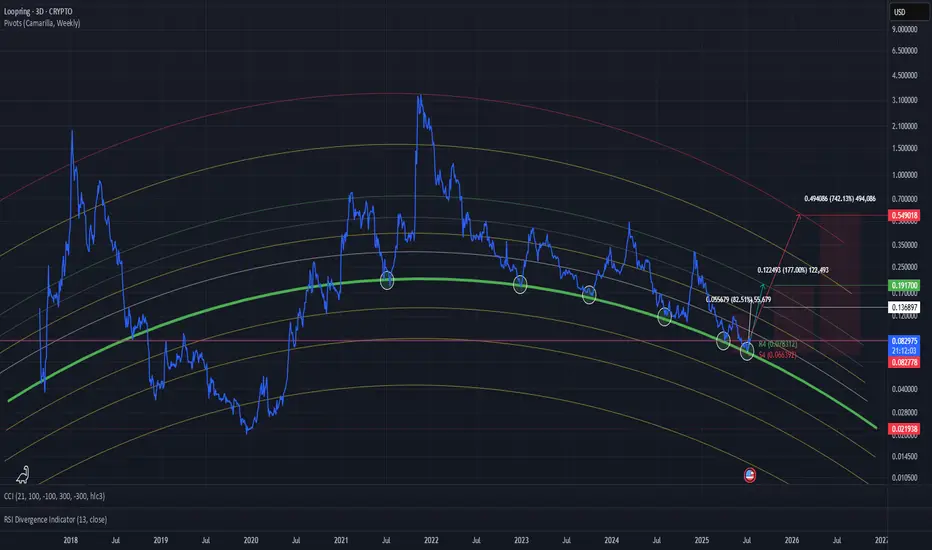
The green line has consistently acted as a strong support — almost like a trampoline that price bounces off.
All realistic and objective targets are already marked on the chart.
Additionally, the weekly Camarilla Pivot is showing significant strength right now, which adds further bullish confluence.
Loopring
LRC, LOOPRING, HOW MANY LOOPRINGS DO YOU THINK SONIC COULD EAT?Something is going on with this coin on the technical side.
There is literally no downside target that I can see right now, so I just labeled in MASSIVE SUPPORT TREND.
It looks like it is really close to making a move to the upside.
Somewhere around .8
Then it will likely hit some resistance there, but has a lot of potential to keep building support and climbing.
This coin looks incredibly bullish right now.
Things can change fast and if they do it will likely be a break of this trend (green).
The run up can take it to .45 and maybe a little higher, but the buy the dip price looks to be around .245. which would then take price higher to over 1 and beyond.
I'm gonna go with 3684 looprings for sonic.
What even is a loopring?
I'll attach more crypto TA to this idea.
oh and don't follow the guideline, pay more attention to the trends and price zones.

LRC - Sine Line Says: Bullish!Hello TradingView Family / Fellow Traders! This is Richard, also known as theSignalyst.
The picture says it all!
📈For the bulls to take over and ignite the next bullish wave in line with the Sine Line cycles, a break above the $0.12 structure marked in blue is needed.
📚 Reminder:
Always stick to your trading plan — entry, risk management, and trade management are key.
Good luck, and happy trading!
All Strategies Are Good, If Managed Properly!
~Rich

Loopring completed very sneaky right shoulder just b4 goldencrssLoopring snuck in this extremely small right shoulder and price action has now retested the neckline as support right before Oo prints golden cross is set to occur. I’m guessing the breakout up from the inverseheadandshoulders is validated very close to when the cross occurs. *not financial advice*

LRC looks bullishThe LRC appears to have completed a correction that was ABC and wave C was a terminal.
We are looking for buy/long positions on the green range
The target is the red box on the chart.
Closing a daily candle below the invalidation level will violate this analysis
For risk management, please don't forget stop loss and capital management
Comment if you have any questions
Thank You

LRCUSD LoopRing... Ring.. Ring. Hello? Like a phone, lol get it?
Okay, enough fun, time for the serious stuff.
Loopring is at support area, where things are flipping in the bullish direction
I don't know the exact point it moves, but I know .1 was an area of support on a past chart.
Take this move and probably compress the line, which isn't as accurate and more a guide to show the idea of a potential trend move to the upside.
Okay, here is help from AI
Here's an analysis based on the chart provided:
### Overview:
- **Asset:** Loopring (LRC) against USD on the BITSTAMP exchange.
- **Time Frame:** Weekly chart from 2023 projected into the future until 2028.
### Key Observations:
1. **Price Movement Analysis:**
- The chart displays a pattern where the price of Loopring has been oscillating within a broadening formation, often referred to as a "megaphone" pattern. This is characterized by an expanding range between resistance and support lines, suggesting increasing volatility.
2. **Technical Indicators:**
- **Price Levels:** The current price is at $0.04002, with a slight decrease (-0.17%) from the previous period.
- **Volume:** The volume on the trading day is 229K, indicating moderate trading activity.
3. **Trend Analysis:**
- **Support and Resistance:** The chart shows potential support around $0.02700 and resistance at approximately $0.07800. The price has been bouncing between these levels, with historical attempts to break above the upper resistance.
- **Divergence:** There appears to be a divergence between the price action and the RSI (Relative Strength Index). While the price has been making higher highs, the RSI hasn't followed suit, which could be a sign of weakening momentum, hinting at a possible correction or consolidation phase.
4. **RSI Indicator:**
- The RSI is currently in the neutral zone, neither overbought nor oversold, which might suggest a phase of indecision or consolidation in the market for Loopring.
5. **Future Projections:**
- **Trend Lines:** The chart includes two trend lines drawn in a way that suggests an anticipated breakout or continuation pattern. The upper line acts as a resistance that has yet to be decisively breached, while the lower line serves as a support. Given the broadening pattern, there's an expectation of a significant move, but the direction is uncertain based on this chart alone.
6. **Volume Analysis:**
- The volume bars show periods of high volume followed by lower volumes, typical in a broadening pattern where the market tests new highs and lows with less conviction each time.
### Potential Scenarios:
- **Bullish Scenario:** If the price breaks above the upper resistance line with strong volume, it could signal a bullish trend continuation. This would align with the broader market's bullish sentiment if other external factors are favorable.
- **Bearish Scenario:** A drop below the lower support line could indicate a bearish trend, potentially leading to a test of lower levels, around the 0.02370 region, indicated by the horizontal line.
### Trading Strategy Implications:
- **Entry Points:** For a bullish trade, one might look for a confirmation of a breakout above the resistance with increased volume. Conversely, for a bearish stance, a break below support could prompt a short position.
- **Exit Points:** Setting stop-losses just below support or above resistance could help manage risk effectively. For profit-taking, aiming for the next significant resistance or support levels as shown might be strategic.
### Recommendations:
- **Wait for Confirmation:** It might be wise to wait for a clear breakout in either direction before committing to a trade. False breakouts are common in broadening patterns, so volume and price action confirmation are crucial.
- **Time Frame Considerations:** Given the long-term nature of this chart, this analysis might be more suited for swing trading or long-term investment rather than day trading.
- **Backtesting:** Before live trading, backtest any strategy you might derive from this chart against historical data to gauge its effectiveness.
- **Market Sentiment:** Keep an eye on market sentiment and news related to Loopring or the broader crypto market. Fundamental analysis might also be necessary to understand why such patterns are forming, especially in the context of broader market trends.
### Conclusion:
The chart suggests Loopring might be at a critical juncture, potentially poised for a breakout. However, the broadening pattern's nature implies caution, as it can lead to either a significant rise or fall. Traders should use additional tools like moving averages, MACD, or Fibonacci retracement for more refined entry and exit points. Given the chart's time frame, patience and a cautious approach are recommended. Always remember, in trading, patience can be a virtue, and understanding the broader market context is crucial.
Remember, this is not financial advice, and while technical analysis provides insights, it's just one tool in a trader's toolkit. Always consider combining TA with fundamental analysis and market sentiment for a more comprehensive view.

Loopring Analysis: Last correction before rocketing!Loopring is now down almost 95% from its previous ATH and is about to reach another low, presenting a new buying opportunity in the market. The support level at $0.10 is an ideal buy zone for LRC, with an ultimate target of $6, IMO.

LRC, SONIC THE SEQUEL (LOOPRING) Here it is!!
Price targets (sell targets) red/light red
Two current trends that are fairly major, which were on the old chart.
Parabolic curve meaning short term movement which can really pull the price in some crazy directions.
However, be careful because I currently can't find a real number over 71 and I more real, 54 or so, which aligns with the trends and creates a nice pullback opportunity to retrace the price down to .2
Here is the thing, on the 4h we have a favorable buy with RSI and a number of indicators. However, on almost every other chart, the buy signal is bullish but overvalued, meaning, things are coming to a conclusion from this runup. The question is, did we see the final impulse to the rejection trend and now we need to head down and confirm support or will we see another impulse up and over trend taking us right to .79 and it can easily melt up higher from there.
A new chart would be needed should we start pushing higher targets, overextending trends and all that fun stuff.
I think there is potential with the coin, but I also think Dogecoin is better as a long term hold, along with ETH and BTC. However, like I said, there are lots of great things to buy but also remember, we just say an over 100% gain in a short period of time, which is A LOT, but not always a lot for crypto due to how fast the market moves since covid.
So what does all of the above mean? Be careful buying this coin because there is downside showing on multiple charts and we are topping out, however, be greedy because there will be up and down movement and chances to make money, exit at profit, limit losses... whatever your trading style is, follow that. Unless you just lose all the time, then try something different haha.
Final
Short term: BEARISH PROJECTION
MID/SHORT TERM: BULLISH
MID TERM: eh, idk, probably bearish
LONG TERM: BEARISH until confirming some price targets on the top side (new) or low side (old)
LONGEST TERM: IF GME, big. IF not, RIP.

LRC LOOPRING, IS THERE A PATH TO .75 I mean, yes.
But it is low probability that it happens or even happens as shown.
So the reason for the projection line, is to show how it "could" dip into the buy zone and potentially below allowing for a spring.
It doesn't need to happen this way, but essentially these low price targets hitting would be good for an upside move.
There are two short term trends, one of which just broke.
The other is mid level support and can easily break in a "flash crash" situation, which then could easily see our low side numbers in the near future.
Whatever is happening in crypto is happening soon, it will be fast, and if it is a massive dip, then the upside can be huge.
Again, it's a matter of will the low price targets hit before the high price targets.
I wish I had a for sure answer, but I don't.
I have a guess, based on what I see chart wise, and it shows the buy zone hitting first (low side targets) which then springs us right back to where we are currently, and allows the steep climb up to the major rejection area.
Summary,
MOSTLY A CHART UPDATE to reflect some of the price movement.
A potential path (guideline) don't follow, it's just a guess at best.
Follow the price targets (horizontal) and trends.
The last green trend is quite strong, and that also leads right to the buy zone.
Why is it important.
Current price to buy zone will lose you nearly 40%.
Buy zone down to .1492 means that anything over .3 is 100%.
It allows you a LOT of wiggle room.
Again, everyone has a different strategy, and it's best to stick to yours.
So, buying loopring to trade, you're holding off on this trend break, imo. The risk is high.
Buying loopring to hodl, then you're probably going to slowly add more and more as the price targets on the downside start to hit.
BUT WHAT IF IT GOES UP FIRST?
Then if you're bullish on LOOP, you're probably already holding some, and you'll see profits. Congrats.
If you're trading and miss some upside, there are like +700 other alt coins and thousands of stocks, you'll find the same percentage gain somewhere else. Don't chase to all time high and lose, when you can easily find another trade. BUT ALSO, watch for a spring on the low targets.

LOOPRING, Cuz if you like it, then ya shoulda put a RING on itLoopring chart update to reflect an unlikely move, but also possible, and also allows for me to add in the higher lines and show the full potential retracement scenario.
In other words, buy the dip, but like .9 is around a 200% gain from here. Don't be greedy at that point, be greedy now and on the way up.
I'm not sure what else to add.
Follow the trends.
Something is definitely going on with crypto and the alts.
Good luck!!

Loopring breaking up from descending channel target = 57.5 centsDefinitey looks like it’s validating the breakout here after 2 previous attempts that ended up going back inside the channel. 3rd time here is likely the charm but it needs to overcome the resitance of the weekly 200ma (in blue) first before it can hit the full target. *not financial advice*

LRC ANALYSIS (1D)We have a large diametric for LRC, which now seems to be only the G wave, the final wave of this diametric.
The least risky and the best place to buy is the green range.
The target is marked on the chart.
For risk management, please don't forget stop loss and capital management
Comment if you have any questions
Thank You

LRC/USDT upward momentum from demand? 👀🚀LRC Analysis💎 Paradisers, focus on #LRCUSDT, which is hinting at an upward trajectory, though it might experience a retracement before continuing its bullish journey from Order Block at demand zone.
💎 #Loopring is currently on an upward curve, poised for a bullish breakout from its established demand level. Should #LRC successfully hold above the $0.2469 level, we're looking at a potential advance towards the key supply zone at $0.4082.
💎 However, if #LRC faces challenges in maintaining its momentum above the $0.2469 demand level, a recalibration of our trading strategy could be in order. In this situation, we would shift our focus to a possible bullish movement from a lower demand level at $0.2075.
💎 Monitoring this level is essential, as a breach below it would signal the need for a strategic realignment, potentially pointing to difficulties in sustaining a bullish trend in the #LRC market.

LRC/USDT A Window for Upward Momentum? 👀 🚀 LRC Today analysis💎 Attention Paradisers, LRCUSDT is showing signs of a potential breakout after facing resistance, hinting at a heightened likelihood of an upward trajectory.
💎 Our analysis has tracked Loopring journey as it gracefully exited a descending triangle pattern, signaling a bullish intent. Although it has recently been rebuffed at the resistance level of .2365, the prospects of it piercing through this barrier by leveraging the .2053 level remain strong.
💎 Conversely, should LRC falter in its attempt to overcome resistance, we anticipate a bullish resurgence from the demand level of .1788. However, a descent below this critical demand level could precipitate a notable bearish downturn. Stay alert and strategic as the market unfolds.

LRC/USDT Gearing for Next Bull Run? 👀🚀LRC Analysis💎 Paradisers, focus your attention on #LRCUSDT, as it's currently showcasing significant market trends. The asset is indicating a strong likelihood of a bullish shift from its current demand zone.
💎 An in-depth analysis of #Loopring's recent market patterns shows a clear downward trend. Having encountered resistance at $0.358 and experienced a pullback, LRC is now setting up for a potential bullish rise from the demand zone at $0.266. If LRC can sustain above this level, it could aim for the next major supply target at $0.452.
💎 However, given the unpredictable nature of the crypto market, #LRC traders need to be prepared for a variety of outcomes. Should LRC find it difficult to maintain its momentum at this demand level, it might be wise to prepare for a bullish rebound from a lower support level at $0.216.
💎 A drop below this support level would necessitate a reevaluation of trading strategies, possibly indicating challenges in sustaining a bullish market trend.
💎 Stay vigilant and adaptable, Paradisers. Your ParadiseTeam is committed to providing you with the latest insights and strategies, ensuring you're well-equipped to navigate these market shifts.

Golden Cross on LRCLoopring FWB:LRC makes a golden cross today @ 1D Chart and the price is 0.242 as i made this idea.
Still early for the altseason and hopefully the big announcements and good news comes as soon as possible

LRC Loopring Coin Price Prediction🔥 Price on the 4H chart might come at these support area and we might get a potential bounce🔥
Potential bounce areas for Buying 0.2717 and 0.2421
👉 Follow me for more real time opportunities.
Share your Thoughts if you have any?

LRC Loopring - Quiet before the STORM ?Hi Traders, Investors and Speculators 📈📉
Ev here. Been trading crypto since 2017 and later got into stocks. I have 3 board exams on financial markets and studied economics from a top tier university for a year. Daytime job - Math Teacher. 👩🏫
Loopring / LRCUSDT has been trading under its 50 day moving average for a few weeks now (this is the weekly chart). This means that the chart is heavily oversold from the MA perspective and a correction is due.
This is bullish, because a correction back towards the 50d MA is expected , even if we get rejected there it will still be an easy, low risk high reward setup that could provide +140%. Keep an eye out on this altcoin and the price action along the moving averages !
Have a great weekend, the charts will be here on Monday 🥂
_______________________
📢Follow us here on TradingView for daily updates and trade ideas on crypto , stocks and commodities 💎Hit like & Follow 👍
We thank you for your support !
CryptoCheck

LRC/USDT bullish ride? 👀 🚀 Loopring Today Analysis💎 Paradisers, brace yourselves as we've spotted a promising opportunity with LRCUSDT, poised for a potent bullish surge following a retest of its formidable support.
💎 In our prior observations, LRC navigated within a descending channel. After breaking free, it faced rejection at the supply level of .1772. Interestingly, it's now revisiting the channel's support, which previously played the role of resistance.
💎 Currently, the odds are in favor of it embarking on a bullish trajectory from the solid support level at .1644. This is further bolstered by the presence of untouched supply zones overhead, indicating a potential visit to these levels in the foreseeable future.
💎 However, on the flip side, should the price breach the .1644 support, we might witness a notable downward shift.
💎 Remember to employ prudent trading strategies and use proper stop-loss measures! Stay alert to market movements and look forward to more insight

lrc breakout confirmed expecting solid recovery seems like getting ready for massive recovery in coming weeks
descending channel breakout has already confirmed with solid volume expecting massive recovery in coming days expecting move towards 1$

🚀 #LRC/USDT Ready to Soar! Join the Rally Now! 📈🔥Attention all traders! 🚨 It's time to jump on the #LRC/USDT rocket ship! Loopring is showing impressive potential, and we're in for an exhilarating ride. Don't miss out on this opportunity to join the rally! 📊🚀
Chart Analysis:
Pair: LRC/USDT
Timeframe: Daily
Key Observations:
Bullish Momentum: Loopring (LRC) has been demonstrating significant bullish momentum lately. The price is on the rise, indicating strong market interest. 📈💥
Support Zone: There's a solid support zone in place, suggesting a robust foundation for potential upward movement. 🧱🚀
Technical Breakout: A recent technical breakout is a positive sign, indicating a potential surge. 🚀📊
Trading Plan:
Entry: Consider entering a long position now while the price is on the rise. Look for confirmation of the bullish trend. 📈🔥
Stop Loss: Implement a well-placed stop loss to manage risk effectively. Protect your capital. 🛡️💰
Take Profit Targets: Set profit targets based on your trading strategy and risk tolerance. Be prepared for both short-term and long-term scenarios.
#Loopring #CryptoRally #BullishTrend #LRCAnalysis #Cryptocurrency #TradeSmart #CryptoTrader
Disclaimer: This is not financial advice. Make sure to do your research and consider consulting with a financial advisor before making any trading decisions. Always use proper risk management strategies.
Get ready for an exciting journey with Loopring! Join the conversation in the comments and share this post with your trading buddies. Let's make this analysis go viral! 🚀🔥💹
Note: TradingView posts are for educational and informational purposes only. Remember to conduct your research and employ proper risk management when trading cryptocurrencies. 📚📊

🔥 Loopring Head & Shoulders Pattern Confirmed: Bears Party!LRC has been losing value steadily after the initial 2023 pump. As of recently, LRC has fallen through the neckline of the head & shoulders pattern, completing this bearish pattern.
In my eyes, this token will see more selling in the coming months. I'm looking at 0.10 for a potential long-term bottom, might even go lower than that.

LRC showing a very good investment opportunityHi Everyone;
today we have one of the best risk to reward Investment opportunity
it is more than 730 times the risk and the chart is look very promising.
Good luck every one
