Is Lowes Signaling An Overall Market Decline?Lowe's triggered my early-warning price reversal algorithm. The full accuracy when this occurs is detailed in the article at my website below. The RSI algorithm determines overbought and oversold levels. The algorithm signaled a SELL on April 6, 2021. Equities nearly always obey the signal and move down, but sometimes it may continue to move up first. This is interesting if the signal is accurate. We are heading into the summer months which would ultimately be profitable for the company. The stock could be in for another short-lived cool off which is most likely the case here. Most of my algorithms may point to a reversal but that reversal ends up reversing usually within 50 trading bars. While the current signal ultimately has the stock dropping, it could gain slightly first. Once the drop has occurred, there is no doubt Lowe's will be primed to retrace this drop.
I have placed two red boxes and two green boxes on the chart. The larger red box depicts all of the historical movement, from a percentage standpoint, that this stock has moved on the Daily chart after a SELL signal occurred. Therefore, this box represents 100% of previous movement upward before the stock finally moved downward. The smaller red box represents 50% of all historical movement upward, before the stock moved downward. The smaller box is more of a precise target for the potential top in this instance.
The green boxes represent the same thing. In this instance, the smaller green box would be my projected target for the final bottom.
The black dotted arrow represents median historical movement. Medians are a good metric, but they are just one of many I use when forecasting future movement.
As always, the stock could decline the very next bar after the signal without looking back (therefore the red boxes would not come into play) or the stock may never decline (and the green boxes may never come into play).
All statistics and the full analysis are available for free as always at the site below.
LOW

LL - Bull flag on weeklyChicago lumber futures were trading around $950 per thousand board in March, buoyed by robust real estate markets and expectations of a swifter economic rebound fueled by massive government spending and vaccine rollouts. Covid is also causing lumber shortage and shipping problems. LL has a nice bull flag on the weekly, look for break above $26.5.


After Sideway , higher high higher low is formHigh Returns With Low Risk is the Key.
Chart never lie but human will.

BEAR MARKET IS HERE! DO NOT OPEN LONG POSITIONS!(2)These are the tickers which have closed below their 200 EMA today.( definitely entered Bearish trend )
Please pay attention to increased volume during down trend and the very same day these tickers closed below an important level.


GBP/NZD - Price hits Previous Structure lowPrice has hit our long term targets at the bottom of previous structure and since has found support at the level. Will we see NZD strength prevail and price break further to the downside for the rest of the week?
Have a great trading day.

ITS - CONSOLIDATING. CLIMB BACK UP? Low supply and MC. Simple Chart showing potential growth if we keep consolidating and we don't blow out the bottom. ITS has some great potential.
A experimental perpetual yield token that will integrate into the Renascence Platform - Soon TBA.
Big token burning op. Some 50k to 100k tokens. That's it. And low MC atm.
Thoughts?

COMPUSDT Credits: Seen on MitchRay's stream yesterday
The Compound Dragon pattern looks even better now, makin higher lows and potential hidden bullish divergences (as its tradition) developing on the daily and now bullishly engulfing on the last 4h candle of the day.

bitcoin bearish idea seems we could have topped out, i could be wrong as bitcoin loves messing with your mind, but im seeing the top maybe as we just are not moving at all as there isnt no volume, that drop lastnight was scary for alot no doubt for alot people, , lets see what happens , its only a idea but could play out

BTC Lower high Lower lowEntered short when 4hr painted lower high lower low a few times.
See what happens in next 30 mins

AUD/JPY - Price beginning its DescentWe've been bearish on this pair for some time now after a previous break of structure. Price retested the highs and tanking rapidly so far today.
If you want to learn about this analysis, using highs, lows and key structures just send me a message on TradingView.
Happy Trading guys!


Support Break (LLb) + Fibo Musang Entry and TPFrom top that makes HHb (Higher High Break), then bottom that makes LLb (Lower Low Break), i'm looking at sell entry at Fibo Musang level 23, then TP at nearest level 161.

BUY $PRRE Stock Asap This is a long term hold however it could easily grow 100x on investment if you buy today!


NZD/CAD - Break of Structure and Textbook B&RWe've seen NZD/CAD in a long term uptrend. We see a break of structure, a retest of a previous structure low before bears enter the market.
Look at these textbook break and retest setups and potential entries you can take to the downside! A break and retest is when price breaks through a previous low in the market, retraces and tests this level as resistance before continuing the downside move.
Watch out for these types of setups across your currency pairs!

Don't reject us, please!What we don't want to see is a rejection at the oppisite site of the Fib Retracement.
A rejection and a subsequent lower low would be bearish, breaking the upper boundary and rising quickly would be very bullish.
I think a squeeze is imminent as short DXY is consensus and we haven't had any meaningful counterrally

BTCUSD ATH last candle on 1W TFrame, then to down Week23 of 2021Next Min Low price Week23 of 2021 (06.13)
Maybe Min low price 4033.82$

USD/CHF - Trend IdentificationGood Morning Traders. Here is an educational piece on two key things.
Before trading a currency pair, we want to head to at least the daily chart to identify the long term trend on the pair before we scale down to our lower time frames. To identify a trend is simple. For an uptrend, look for higher highs and higher lows.
Here is a clear long term downtrend on UCHF. We can see price is making lower highs and lower lows. This indicates a downtrend.
It is important to zoom out and see highs and lows of markets long term. We've done that here with USD/CHF and we can see that price is now at 6 year lows! Will sellers keep pushing price down further or is this a level where buyers will jump into the market?
Top Tip - You can always switch to a line chart. This makes identifying the trend easier for forex beginners!

Buy Deutsche bank, no this is not troll idea.Buy Deutsche bank cheap, sell expensive, later.
Risky, but payoff potential is pretty decent.

Kraft Heinz long term buy positionBuy as low as you can, ideally, put this stock in your long-term investment portfolio.

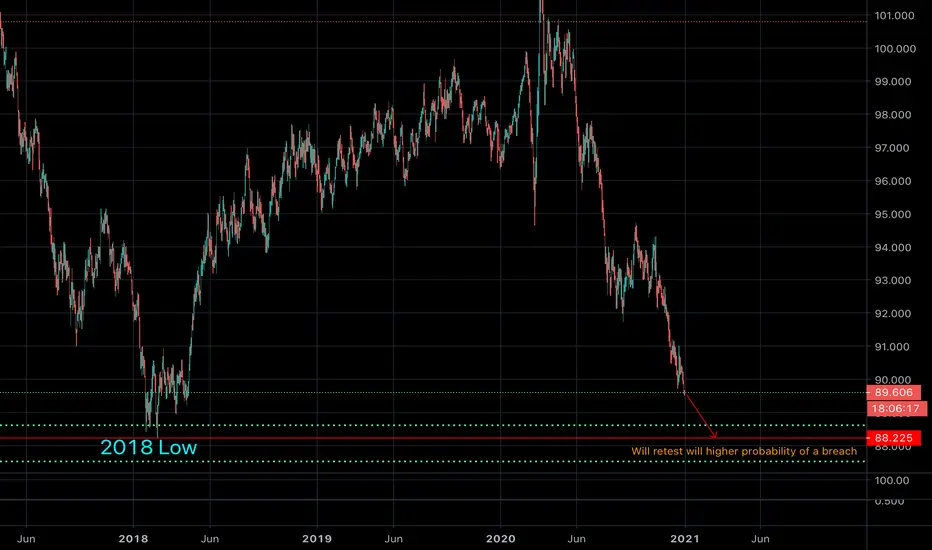
Twin Deficit forcing Psych levelsTwin deficit has resurfaced as a driving force towards DXY decline. At this point pairs are being controlled by psychological trend levels.
Presented is the DXY day chart. We can see a clear drop for a retest of the 2018 low which in contrast brings pairs such as NZDUSD, EURUSD, GBPUSD, etc to levels breached in Jan 2018.
A fundamentalist like myself begins to wonder if Twin Deficit sentiment is the ultimate driving factor for these psych occurrences taking place in 2018 and current. While COVID would be a logical main factor, ultimately any factor that would push double negative accounts.
Attached is my previous DXY idea as well as my 2018 high retest idea of USD pairs I published over a month ago. Anyone patient enough to hold USD pairs have certainly played their cards well.
Expect a retest of 88.225 to match 2018 with a higher breach probability for a new low.
Please comment with any thoughts and Ideas. Thank you.