LPP
XAUUSD GOLD Structurein the XAUUSD Gold Structure is the Bullish because :
in the 4H structure, after reaction to the DE Order Block, the structure in the 15min has changed.
note: after reaction in the Order Block we can use this formula: 4H LPP = 15min CHOCH
of course in the 15-minute chart, the structure changed from bearish to Bullish because the 15-minute CHOCH has been completed.
this is just my idea you can test it.
Be successful and profitable
SCEPTEREDING
AUDUSD StructureThe structure in the AUDUSD is Bullish. after CHOCH in 4H, the market structure has changed from Bearish to Bullish.
But on the 15-minute Chart, it's different because :
we have a CHOCH in 15min Chart.
and the distance between High and Low is large.
this explanation does not mean that the Structure is bearish. no! but we can sell in a short time.
this is my idea, you can test it.
Be successful and profitable
SCEPTEREDING
GBPUSD Structurein the GBPUSD, the market is bullish. but the distance between High and Low is very large, then we can use this formula :
15min LPP = mCHOCH
Please note that we have 2 order blocks that the market can react to it
This is just my idea, you can test it
Be successful and profitable
SCEPTEREDING
EURUSD StructureThe structure in EURUSD is Bullish. Because we have 2 Bullish BOS, But the last High has no LPP then :
or => market must build new LPP
or => take the 15m LPP and react to Order Block
we have another scenario :
Because the distance between High and Low is large , we can use the following formula :
LPP = mCHOCH
this is just my idea and we can test it
Be successful and profitable ...
SCEPTEREDING
Bullish Structure GBPUSDin 4H Structure is Bullish and EX Order Block worked .
in 15min Structure is Bullish because Price Move from 4H EX order block and we have 15min BOS
in 15min we have 1 EX Unmitigated Order Block .
==> if Structure create new 15min BOS we must Fund new LPP and new Order Block .
==> if Structure cant it , we have just 1 ZONE for BUY
Bullish BOS in EURUSDin 4H Structure is Bullish . But After EX Order Block , we have a mCHOCH and mLPP in 4H
in 15min , Structure is Bullish but we have LPP and 2 Order Block ( DE , EX ) that we can think about trading for then .
If 4H mLPP is Running => then we have 1 minor Order Block in 4H . when refine it in 15min , we can marked 2 other Order Block .
==>> we have 4 ZONE for BUY
EUR/USDHello. How are you? We start the first trading day of the week. Important news was released last week, which created a range of movement between 1.06357 and 1.07807. When the ceiling was broken (the area I marked with D), a character change with the abbreviation CHoCH symbol was formed. Of course, if we used the trend line, it completely confirmed that the channel ceiling had been broken and now we should wait for a possible pullback and upward movement.
Now pay attention to the areas I marked with A, B, and C:
Area A is a kind of cash collection that we call SPP in our style. Since this SPP line has been broken with the shadow of the candle, we can risk the market going up.
Note that there are two other areas below Area A. Areas B and C are potential buy orders. They can be called potential demand areas.
The area that I marked with B has been optimized and marked in a 5-minute timeframe. If the market reaches this area, which is approximately 1.06755, I will look for confirmation to enter a buy trade in a lower timeframe. My stop loss is under the bearish candle level, which means 1.06602. Additionally, area C is identified as the 50% area of an order block in the origin.
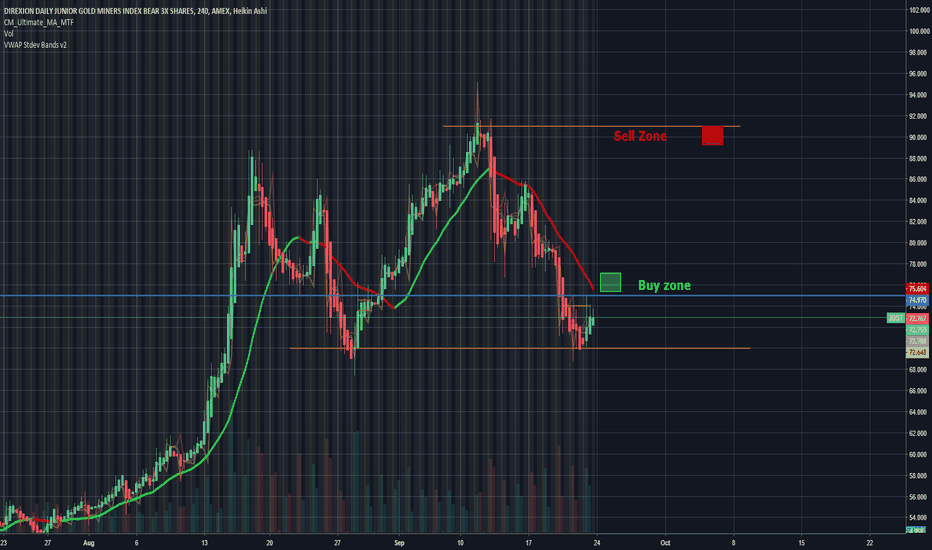
21% Potential in Russian Bear!AMEX:RUSS
21% Potential in Russian Bear!
Entry now if you're a bit more aggressive or
Entry after signs of higher highs and higher lows above blue EMA (15) line
2% Stop loss
MacD showing signs of reversal
RSI below 40
IRI Over-bought in this horizontal pattern
Offers 15% potential between top and bottom drawn support and resistance
If it makes higher highs past $3 then continue to be patient and wait for further higher highs and higher lows to confirm that it's on the uptrend before getting in for a swing trade
On the weekly chart, IRI is in a down trend and is hitting the moving average line, so wait and see if it can bust through that or if it is just going to get rejected


