Lsk


$LSK Crossing above 26k sats (resistance) with low volume... $LSK Crossing above 26k sats (resistance) with low volume... Still UCTS Buy signal flashing on the daily...
If it manages to get some traction (volume), it could move up to 30ksats (around 10%) from current level as first target...
If you take a position, SL just in case!
#LSK


Our appointment with lsk is coming up soonOur appointment with lsk is coming up soon
cup and handle
buy range
1.80 - 2.05
target 1: 2.30
target 2: 2.89
target 3: 3.38
stop close under 1.65 1day

LiskLisk found a bottom at 2260 are and bounced from. It need needs to break 2500 first then upper yellow lines are available. Stop is red line as always.


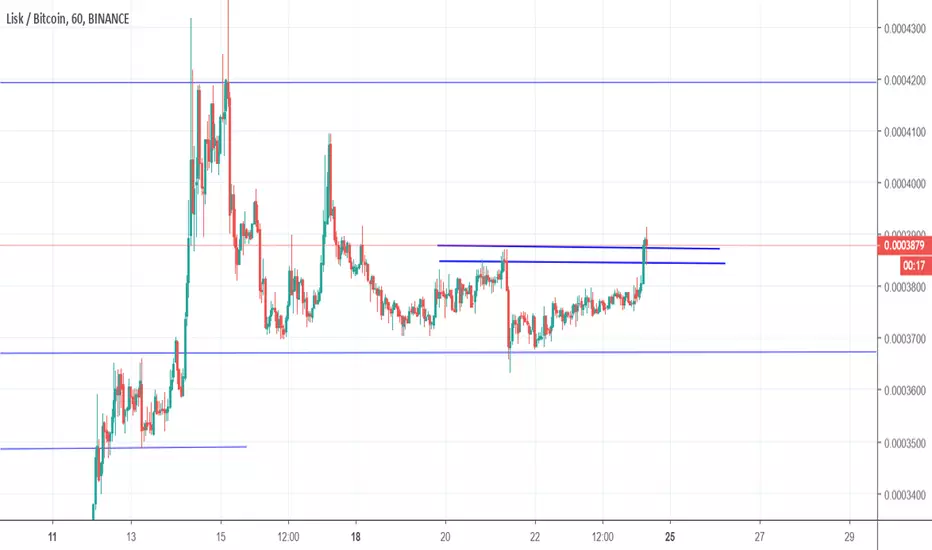
$LSK Trying to flip Resistance into support...$LSK Trying to flip Resistance into support at -.236 fib level (~26k sats)
Wait for volume to appear as confirmation
UCTS showing a buy signal
Falling below support cancels it of course.
#LSK
Lisk next weeks our monthAfter a long period of low, here we have a charting of xicara in the daily chart and a cross of the stockings.
Obviously all the clips depend on the stability of the BTC, that consolidating in the $ 6500 to $ 8000 range will begin to pull the clips.
Let's follow


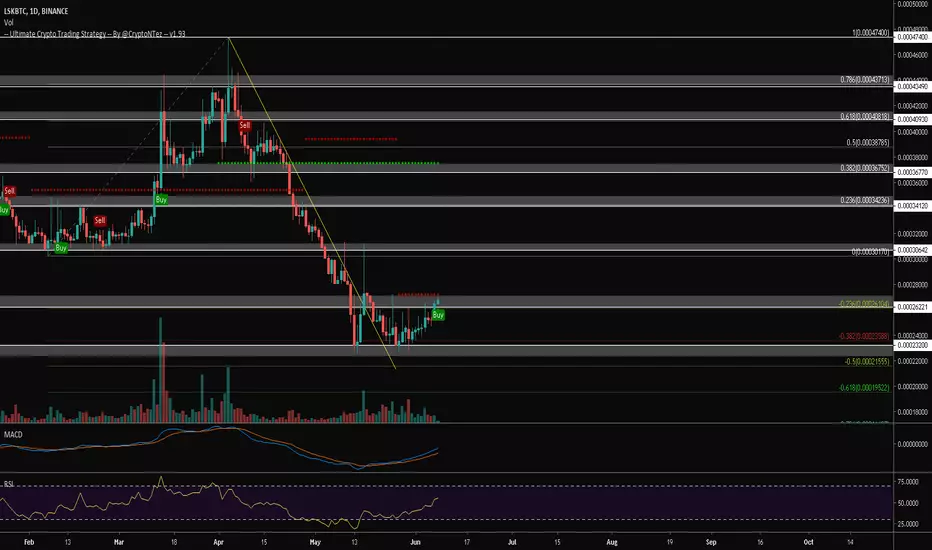
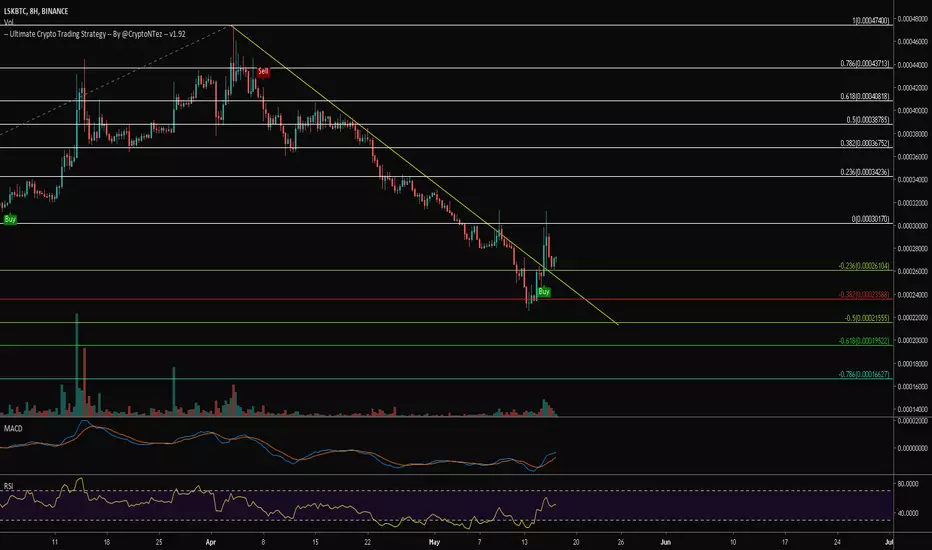
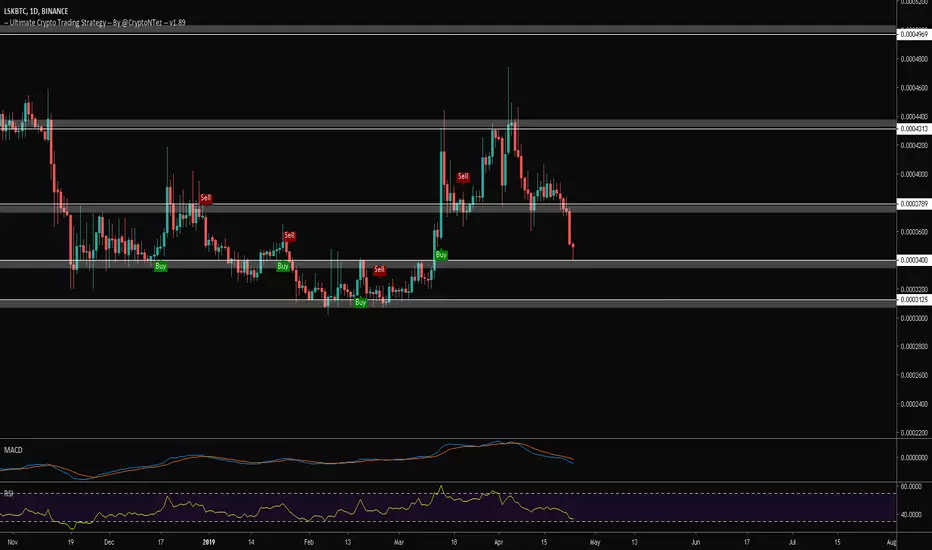
$LSK reached ATL BTC support level at ~31K sats..$LSK reached ATL BTC support level at ~31K sats..
21% down since the UCTS Sell signal printed on the 1D
RSI at oversold levels
Volume really low (could be exhaustion)
Due to current market status (BTC pumping..) wait for true signals of reversal/bounce prior buying this
#LSK

$LSK Testing 3400support level with some bounce signals...$LSK Testing 3400support level with some bounce signals displaying on lower timeframes... On the daily there is a HUGE dragonfly doji that we will need to follow on the upcoming hours/days...
Worth setting some alerts and refresh the picture by EOD
#LSK
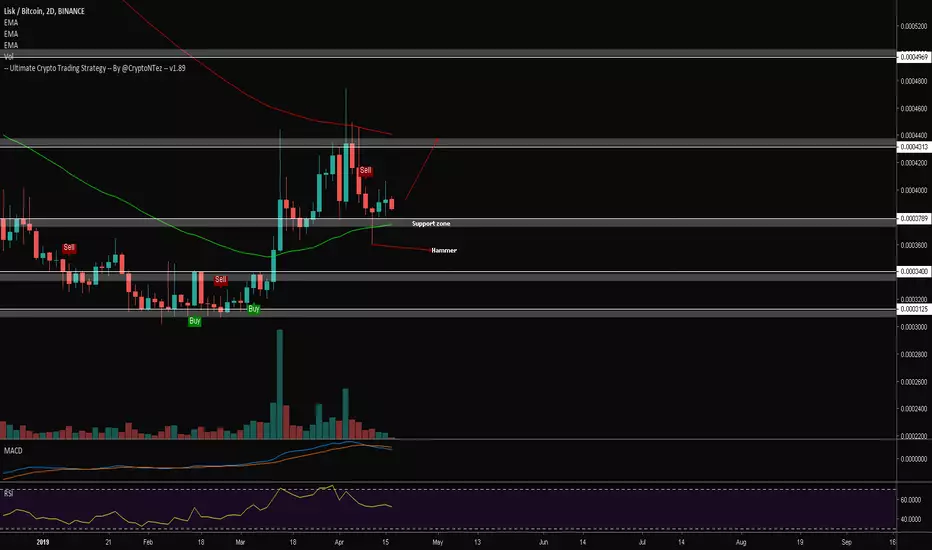
$LSK Support zone at 3800sats was retested...$LSK Support zone at 3800sats was retested after the run of the beggining April leaving a big hammer candle
This could lead us to think that support is holding for now and a new trend up may be up to begin on the following days/weeks.
Will follow this coin as I see updates
#LSK
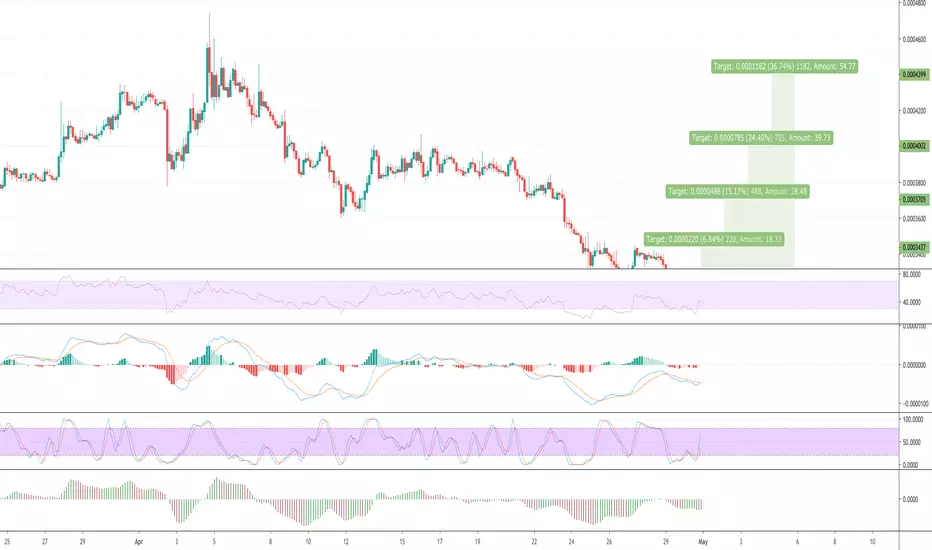
There is a possibility for the beginning of an uptrend in LSKBTCTechnical analysis:
. LISK/BITCOIN is in a range bound and the beginning of uptrend is expected.
. The price is below the 21-Day WEMA which acts as a dynamic resistance.
. The RSI is at 50.
Trading suggestion:
. There is a possibility of temporary retracement to suggested support zone (0.00038500 to 0.00033360). if so, traders can set orders based on Price Action and expect to reach short-term targets.
Beginning of entry zone (0.00038500)
Ending of entry zone (0.00033360)
Entry signal:
Signal to enter the market occurs when the price comes to " Buy zone " then forms one of the reversal patterns, whether " Bullish Engulfing ", " Hammer " or " Valley " in other words,
NO entry signal when the price comes to the zone BUT after any of the reversal patterns is formed in the zone.
To learn more about " Entry signal " and the special version of our " Price Action " strategy FOLLOW our lessons:
Take Profits:
TP1= @ 0.00047420
TP2= @ 0.00054390
TP3= @ 0.00067700
TP4= @ 0.00076560
TP5= @ 0.00088700
TP6= @ 0.00103390
TP7= @ 0.00148450
TP8= @ 0.00185000
TP9= @ 0.00221540
TP10= Free

LSK bull runLSK looking ready for a massive jump, Nina also support with green weekly arrow, TARGETS and SL on the chart.
Good luck.

Came for BTC. Stayed for LSK.Accumulate as much as possible. You already missed the bottom anyways.
Range break and its time to get a full LSK maximalist again.

LSK above all MAs and ready to move up! LSK has now moved above all MAs and consolidating right under resistance ready for its next leg higher.
We are seeing a cross of the 50/100MA with a rising CMF, which affirms our bullish bias.
We could see LSK head for it next targets above if BTC doesn't see a sharp breakdown.
Thanks guys!

LONG LSK LONG!!! LSKBTC BUY LSKDear friends it's time to buy LSK. LSK is showing strong growth amid falling. Very strong coin. buy now to break through resistance. BUY BUY BUY.
PATTERN RELATED TO LTC!!!
See below my LTC prediction.