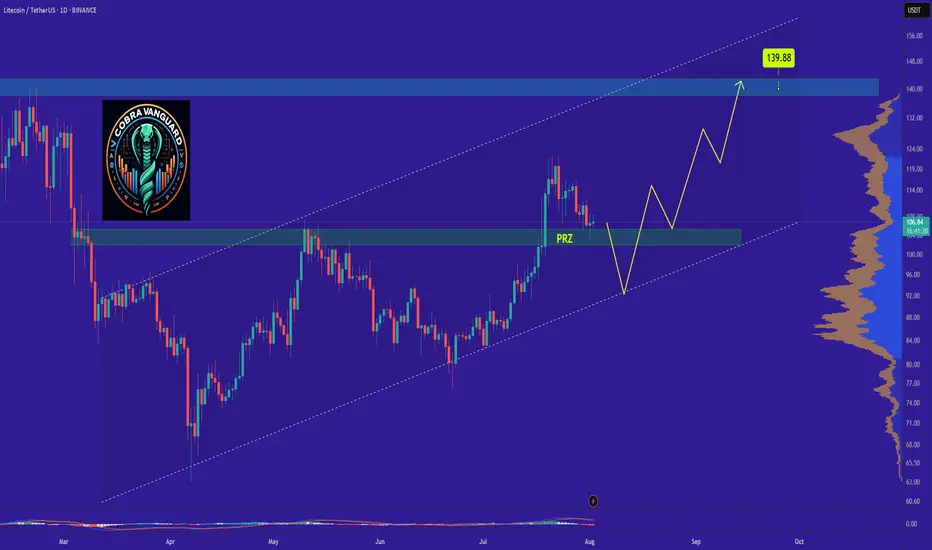
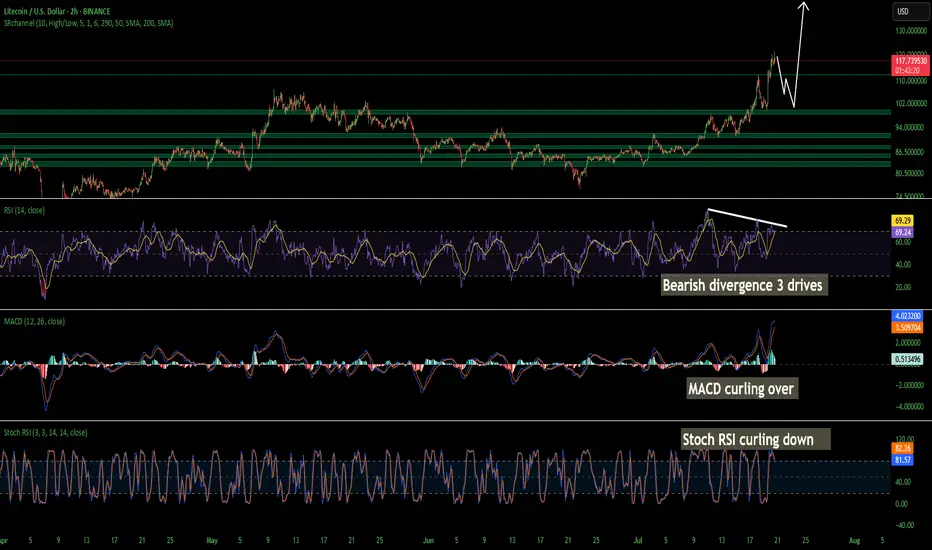
LTCs Situation (Daily) !!!If the price loses the PRZ range, it will drop to the bottom of the channel and then rise to the top of the ascending channel, which will take some time.
Best regards CobraVanguard.💚
LTC
Litecoin H4 | Bullish bounce off 50% Fibonacci supportLTC/USD is falling towards the overlap support and could bounce to the take profit
Buy entry is at 101.85, which is an overlap support that lines up with the 50% Fibonacci retracement.
Stop loss is at 97.43, which is a pullback support that aligns with hte 61.8% Fibonacci retracement.
Take profit is at 110.38, an overlap resistance.
High Risk Investment Warning
Trading Forex/CFDs on margin carries a high level of risk and may not be suitable for all investors. Leverage can work against you.
Stratos Markets Limited (tradu.com ):
CFDs are complex instruments and come with a high risk of losing money rapidly due to leverage. 65% of retail investor accounts lose money when trading CFDs with this provider. You should consider whether you understand how CFDs work and whether you can afford to take the high risk of losing your money.
Stratos Europe Ltd (tradu.com ):
CFDs are complex instruments and come with a high risk of losing money rapidly due to leverage. 66% of retail investor accounts lose money when trading CFDs with this provider. You should consider whether you understand how CFDs work and whether you can afford to take the high risk of losing your money.
Stratos Global LLC (tradu.com ):
Losses can exceed deposits.
Please be advised that the information presented on TradingView is provided to Tradu (‘Company’, ‘we’) by a third-party provider (‘TFA Global Pte Ltd’). Please be reminded that you are solely responsible for the trading decisions on your account. There is a very high degree of risk involved in trading. Any information and/or content is intended entirely for research, educational and informational purposes only and does not constitute investment or consultation advice or investment strategy. The information is not tailored to the investment needs of any specific person and therefore does not involve a consideration of any of the investment objectives, financial situation or needs of any viewer that may receive it. Kindly also note that past performance is not a reliable indicator of future results. Actual results may differ materially from those anticipated in forward-looking or past performance statements. We assume no liability as to the accuracy or completeness of any of the information and/or content provided herein and the Company cannot be held responsible for any omission, mistake nor for any loss or damage including without limitation to any loss of profit which may arise from reliance on any information supplied by TFA Global Pte Ltd.
The speaker(s) is neither an employee, agent nor representative of Tradu and is therefore acting independently. The opinions given are their own, constitute general market commentary, and do not constitute the opinion or advice of Tradu or any form of personal or investment advice. Tradu neither endorses nor guarantees offerings of third-party speakers, nor is Tradu responsible for the content, veracity or opinions of third-party speakers, presenters or participants.

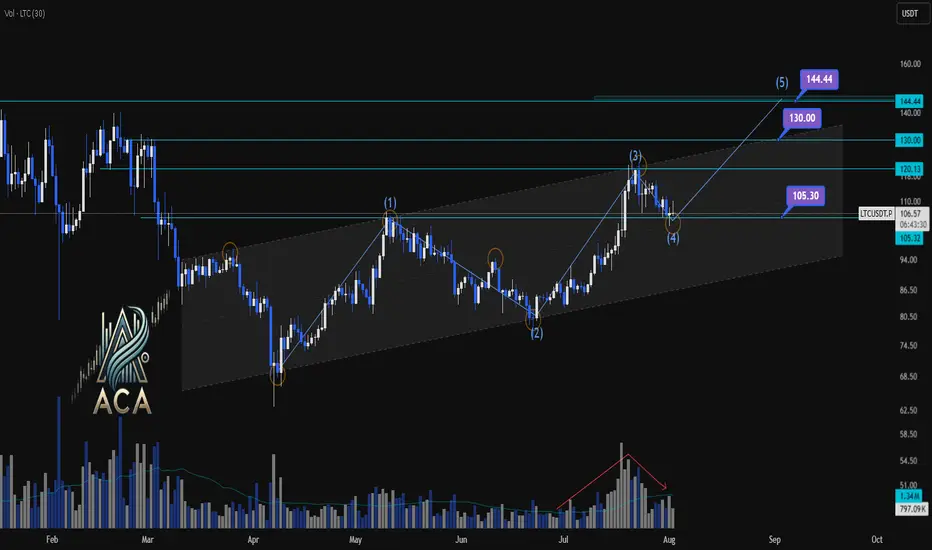
LTCUSDT | Daily Chart Analysis | Bullish Structure UnfoldingLTCUSDT | Daily Chart Analysis | Bullish Structure Unfolding
🔍 Let’s break down LTC/USDT’s technical setup, focusing on volume, Elliot Wave structure, and key target levels for this bullish scenario. If you're following this channel, be sure to react and let us know your thoughts on the roadmap!
⏳ Daily Overview
LTCUSDT is moving within a defined ascending channel, supported by increasing bullish momentum and clear Elliot Wave progression. The recent wave count points to a textbook impulse, setting up the next key move.
🔺 Long Setup:
The market has completed Waves (1) through (4), and we’re now looking at the development of Wave (5) to the upside.
- Wave (5) Target Zones:
- $130.00
- $144.44
These are the next resistance levels based on previous highs and channel dynamics.
- Key support to watch:
- $105.30 — this zone may act as a springboard for the next rally if tested.
📊 Key Highlights:
- Volume has shown a clear bullish divergence as price advances, signaling growing interest and strength heading into Wave (5).
- The bullish channel remains intact, and each dip has been met with higher lows, confirming the ongoing uptrend.
- Elliot Wave structure suggests further upside, with the $130.00 and $144.44 levels as potential targets.
🚨 Conclusion:
LTC bulls should keep an eye on price action as it approaches support at $105.30 — a bounce here could ignite the next leg higher toward our target zones. Reaction from the channel community will be crucial as Wave (5) unfolds. Show your support with a reaction below if you’re riding this wave!
LitecoinLtc usdt daily analysis
Time frame hourly
Risk rewards ratio >2.7👈👌
Short position
Target 100.5 $

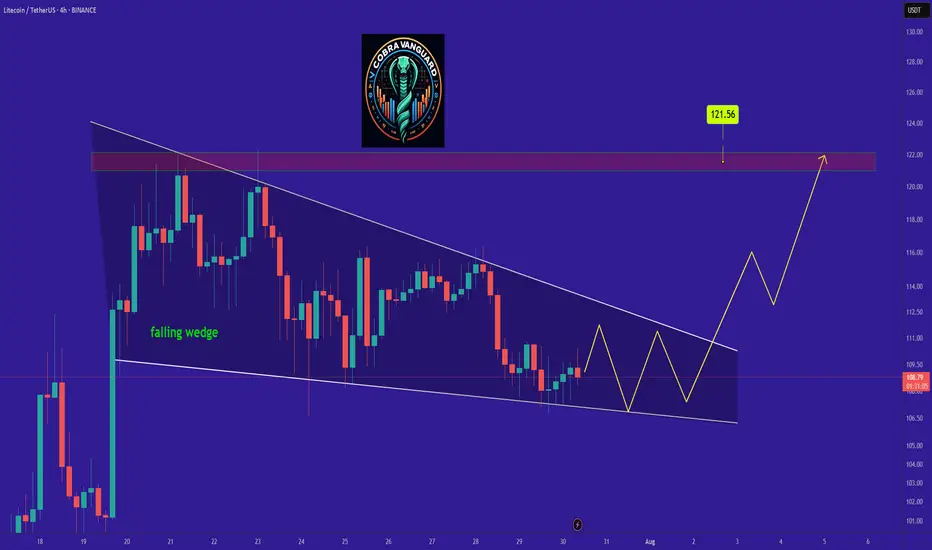
LTC is bullish now and many Traders don't see itSo if you pay attention to the LTC chart you can see that the price has formed a Ascending wedge which means it is expected to price move as equal as the measured price movement.( AB=CD )
NOTE: wait for break of the WEDGE .
Best regards CobraVanguard.💚
LTCUSD H4 | Bearish reversal off pullback resistanceLitecoin (LTC/USD) is rising towards the sell entry that lines up with the 23.6% Fibonacci retracement and could drop lower.
Sell entry is at 110.45, which is a pullback resistance that aligns with the 23.6% Fibonacci retracement.
Stop loss is at 120.08, which is a swing high resistance.
Take profit is at 102.00, which is an overlap support that aligns with the 50% Fibonacci retracement.
High Risk Investment Warning
Trading Forex/CFDs on margin carries a high level of risk and may not be suitable for all investors. Leverage can work against you.
Stratos Markets Limited (tradu.com ):
CFDs are complex instruments and come with a high risk of losing money rapidly due to leverage. 65% of retail investor accounts lose money when trading CFDs with this provider. You should consider whether you understand how CFDs work and whether you can afford to take the high risk of losing your money.
Stratos Europe Ltd (tradu.com ):
CFDs are complex instruments and come with a high risk of losing money rapidly due to leverage. 66% of retail investor accounts lose money when trading CFDs with this provider. You should consider whether you understand how CFDs work and whether you can afford to take the high risk of losing your money.
Stratos Global LLC (tradu.com ):
Losses can exceed deposits.
Please be advised that the information presented on TradingView is provided to Tradu (‘Company’, ‘we’) by a third-party provider (‘TFA Global Pte Ltd’). Please be reminded that you are solely responsible for the trading decisions on your account. There is a very high degree of risk involved in trading. Any information and/or content is intended entirely for research, educational and informational purposes only and does not constitute investment or consultation advice or investment strategy. The information is not tailored to the investment needs of any specific person and therefore does not involve a consideration of any of the investment objectives, financial situation or needs of any viewer that may receive it. Kindly also note that past performance is not a reliable indicator of future results. Actual results may differ materially from those anticipated in forward-looking or past performance statements. We assume no liability as to the accuracy or completeness of any of the information and/or content provided herein and the Company cannot be held responsible for any omission, mistake nor for any loss or damage including without limitation to any loss of profit which may arise from reliance on any information supplied by TFA Global Pte Ltd.
The speaker(s) is neither an employee, agent nor representative of Tradu and is therefore acting independently. The opinions given are their own, constitute general market commentary, and do not constitute the opinion or advice of Tradu or any form of personal or investment advice. Tradu neither endorses nor guarantees offerings of third-party speakers, nor is Tradu responsible for the content, veracity or opinions of third-party speakers, presenters or participants.

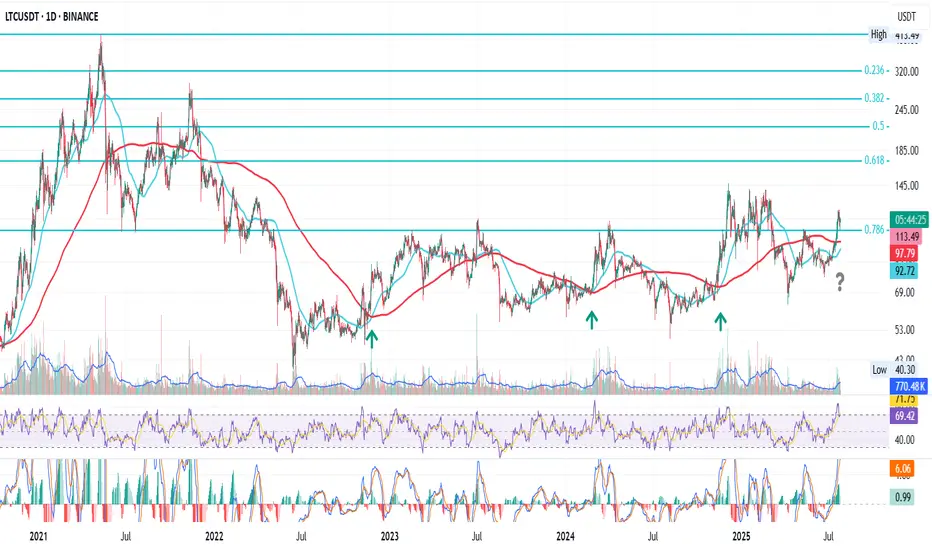
LTC Prepares to Break the CycleThis is LTC on the daily
After the bear market bottom in June 2022, LTC had three golden crosses, each followed by a rally into the 0.786 Fib level.
To be fair, last time price broke above that resistance, but got pushed back — like everything else — by the macro storms earlier this year.
Now we’re approaching another golden cross, but the setup feels different:
1. Price is already holding above 0.786, at least for now.
2. Macro looks calmer, with crypto gaining favorable attention from the SEC, and rate cuts becoming a matter of when, not if.
Putting these together, I lean bullish on LTC price action going forward.
Whatever happens next — we’ll be here to watch it unfold.
Always take profits and manage risk.
Interaction is welcome.
Litecoin is Lagging.Company held Litecoin is emerging, we're only getting started. Arriba.
P.S. ETF deadline on August 4th, 2025.
CRYPTOCAP:LTC $113.80

LTC Litecoin USD Textbook Cup & HandleLitecoin should finish its correction over the weekend and as we get into August the momentum will shift back to the upside. This is a washout of over-leveraged positionsbefore the next massive leg up. I still see a correction down to about 100 dollars. Could be a wick lower but not too confident. There is quite a bit of strength in Litecoin, and for good damn reason.
Not financial advice just my opinion. Thank you

LTC Litecoin Short Term Pull Back Quick and SharpI believe Litecoin Is topping out on the 2 hour. Looks like we may come back down and tap support at around 104 but I wouldn't be surprised a wick hits 100. I have buy orders around 103-106. I am not super confident on a deeper pullback so thats why my buys are there is so i don't miss the dip. Id rather make a little less money than miss a buy in trying to nail the bottom. Litecoin is starting its breakout from a 7 year consolidation and accumulation phase. This should be pretty massive. Litecoin is going to benefit considerably from these new bills that are being signed and many of the favorites in the top 100 will soon disappear!
The time for Litecoin to shine as I have been talking about for years is now. I am almost certain that this is that time. My predictions all still hold if you would like to go read them. I was just off on timing. Timing is the hardest thing to predict especially with how wild this planet has been lately. None of this is financial advice its just my opinion.
LTC (the most dangerous chart in crypto)LTC / USDT
8 years of accumulation in this triangle and price is being squeezed around apex.. What is the result of this long accumulation?
It reminds me of XRP chart before the big breakout in last November
Keep an eye of it…

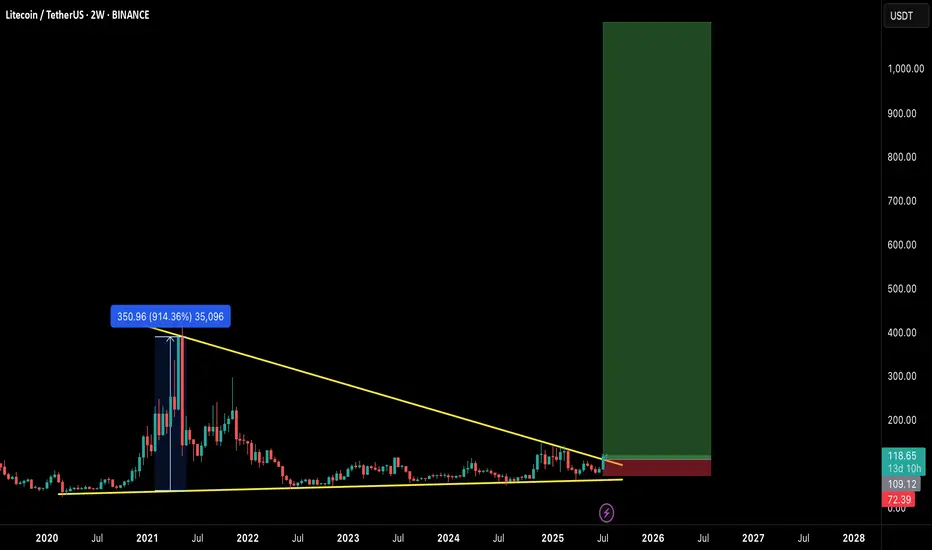
$LTC READY FOR EXPLOSION! THE COMEBACK OF THE OG?Litecoin has quietly formed one of the most massive macro structures in the market — a multi-year falling wedge on the 2-week timeframe, now breaking out with early confirmation.
This could be the start of a generational move, similar to the 2020 breakout. Let's break it down:
🧠 Technical Breakdown:
✅ Falling wedge forming since 2021 — 4 years of compression
✅ Volume and structure support breakout
✅ LTC already gave a 914% rally last time it broke a similar level
📏 Target zone extends above $900–$1000
🛒 Entry Zone:
Current Price: $118
🟢 Buy on breakout or dips near $105–$110 for safer entries
🎯 Target Zones:
TP1: $280
TP2: $400
TP3: $650
TP4: $950+
🛑 Stop-loss:
Breakdown below $72 (last higher low & wedge base)
⚖️ Risk-to-Reward:
High timeframe structure = High conviction play.
Potential R:R > 8x — Rare macro opportunities like this don’t come often.
🧩 Final Thoughts:
LTC may not be the flashiest alt anymore, but this setup is technically undeniable. If BTC enters full bull cycle, LTC could ride the wave explosively.
🔥 This could be a "buy and forget" macro play for 6–12 months.
💬 Let me know your thoughts in the comments & hit that ❤️ if you like macro setups like these!
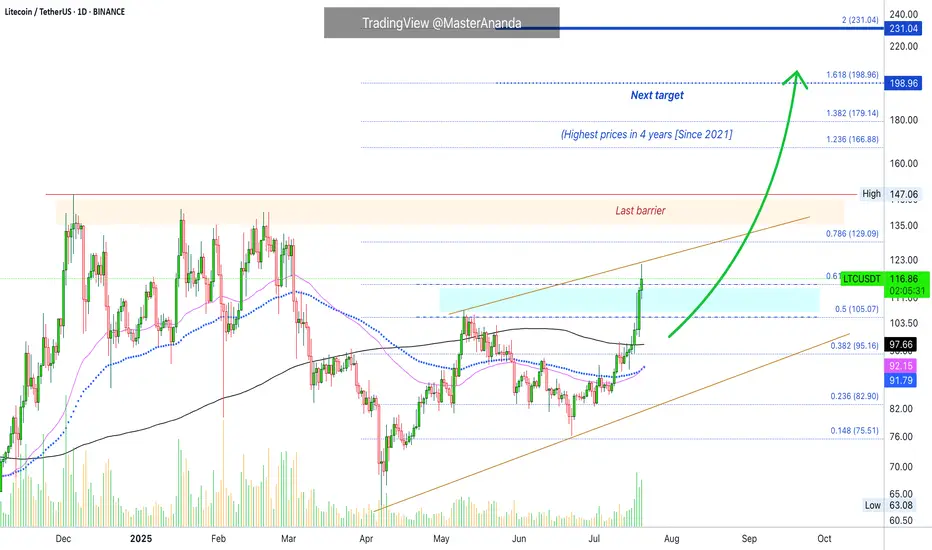
Litecoin's Path Beyond $200 Revealed · Daily TimeframeWe looked at Litecoin on the weekly timeframe which is the long-term picture, but we also need to consider the daily to see what is happening up-close.
As soon as we open this chart we have three signals that stand out:
1) Litecoin is now trading above MA200 safely and rising. This is a very strong bullish development and supports additional growth.
2) Trading volume has been rising significantly being now the highest since February 2025. The difference is that in February we were in distribution, resistance being confirmed with prices set to move lower. In this case, the action is rising from support and volume is rising rather than dropping.
3) May's peak has been broken. Many pairs are still trading below their high in May. Those that broke this level are the ones moving first and this signal exudes strength. Litecoin is now one of the top performers specially in the group with a big market capitalization.
The next barrier is the December 2024 high at $147. Short-term the next target is $129. As soon as the former breaks, we are going to be looking at the highest price since 2021.
Litecoin is fighting resistance today, 0.618 Fib. extension at $115. It is trading above this level but the confirmation only happens at the daily close. If it closes above, bullish confirmed. It if closes below, it means that there will need to be some struggling before higher prices. This struggling can last a few days just as it can extend. Seeing Ethereum and how it is moving straight up, Litecoin is likely to do the same.
Overall, conditions are good for Litecoin on the daily timeframe.
Thank you for reading.
Namaste.
LITCOIN BUY OR SELL !!!Hello friends🙌
🔊According to the price drop, you can see that the price has been below the specified resistance for a while and when it was able to break the resistance, it shows us the power of the buyers. Now, when we return to the previous resistance, which has now become a support, you can see that the buyers are providing good support and the price is expected to move to the specified targets.
Note that the most important rule in trading is capital and risk management So make sure to follow it.
🔥Follow us for more signals🔥
*Trade safely with us*

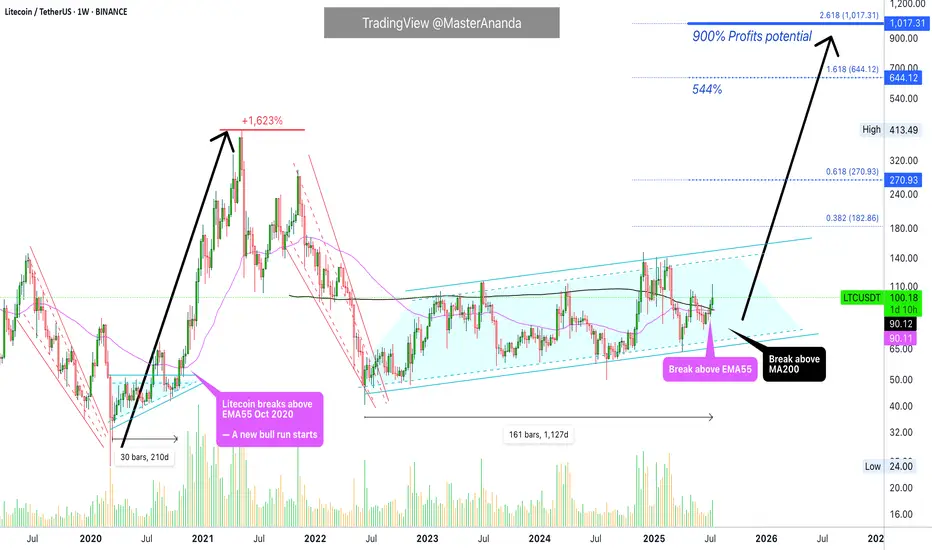
Litecoin $1,000 (900%) ExplainedBack in 2020, just 210 days of consolidation led to a 1,623% strong bull market. How much different market conditions we have now. Since 2022, Litecoin has been consolidating. The length of this consolidation is now 1,127 days. More than five times the previous consolidation and then some.
How much higher can Litecoin go compared to a past period?
How much more growth can a project produce when it has been building strength for so long?
LTCUSDT is now trading weekly above EMA55. When this happened back in 2020, what followed was sustained growth. Straight up, literally, for a period of 203 days. No stops.
Back in 2020, Litecoin moved above EMA55 first in August just to be rejected. The second time was the good one. This year the situation is the exact same. Litecoin broke above EMA55 in May and was rejected. The second time is happening now in July and this is the good one.
Litecoin is also trading above MA200 fully confirmed and there is a golden cross between EMA55 and MA200. We are very close to a major marketwide bull-run.
$644 in this bullish cycle is a high probability target for Litecoin, but prices can go higher, much higher because market conditions continue to improve and institutions will gain access to Litecoin through Exchange-Trade Funds (ETFs). This means that a standard price projection would be a disservice to us. We are aiming for $1,000+ on this bullish cycle but it can end up closing higher of course.
After the new all-time high is hit, it is normal to see a correction or even a bear market. This one should be short and small compared to previous ones. See you at 1K.
Namaste.
LTC/USD LITECOIN Adam & Eve Pattern On WeeklyThe Adam and Eve pattern is quite effective and usually signals a trend change to bullish. Once this pattern breaks the neckline I think its straight to $200 before any sort of pullback.
Haven't done a chart in a while cause its been the same old stuff, sideways. We are starting to ignite now. Silver is running which means something is breaking in the background financial system. I see the biggest blow off top you've ever seen coming, its the only way out of this, print print print until it doesn't work anymore.
Also I was reading that Bitcoin is removing its cap for spam in each block in October? This could spell disaster for fees and congestion. Litecoin will skyrocket during that time I believe because the fees will be so high it will price out the little guy trying to send a grand or two. I see an influx of people coming to Litecoin. Good luck , none of this is financial advice just my opinion

LTC - Time to buy again! (Update)Finally, this pattern was broken and had a positive impact, leading to significant growth. Now, with a slight price correction, higher price levels can be reached.
PREVIOUS ANALYSIS
Best regards CobraVanguard.💚

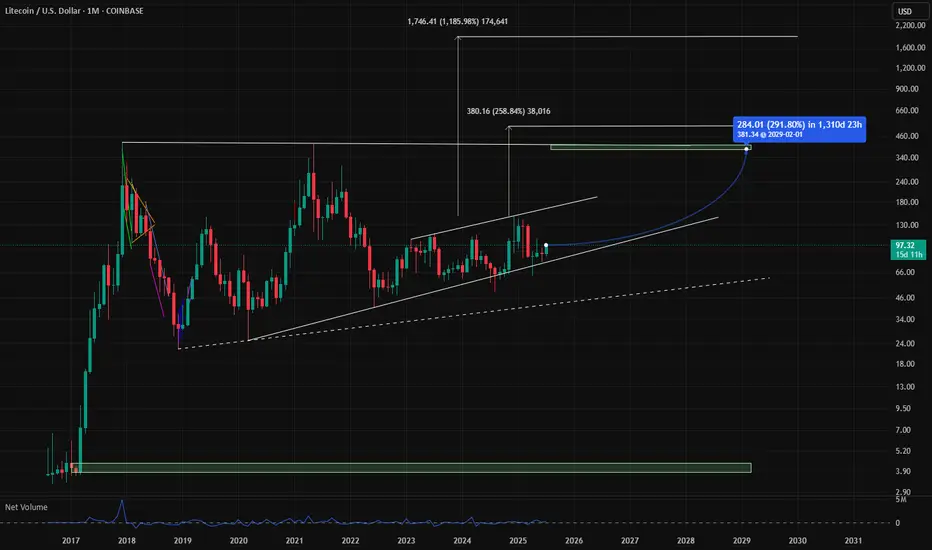
LTC Targets 400$ + 1900$ Litcoin LTC Targets for the next run are atm +290% is a realistic szenario. The addvanced targets at 1900$ are very impressiv but remember there are only 21 Mio. Coins too, like BTC because it is the fork and think about an alternative payment methode like btc, would be a reason for 1900$ pro LTC. So in Crypto is nothing unreal if you could imagine, but first of all approx. 400$ are a good direction. GM
LITCOIN : So what is an ETF ?Hello friends
Be careful with the recent fluctuations of this coin because the movements of this coin have become unpredictable and we suggest that if you want to buy, buy in the specified support areas and in steps, of course with capital and risk management...
We have also specified targets for you.
*Trade safely with us*

Litecoin to $1100 (12X) In This Coming AltseasonBased on tried and true fractals, multi-fib confluences, and historical price action, Litecoin is poised to hit prices between $900-1500 this cycle. The multi-fib confluences are pointing to $1100-1200 range as the most likely target. This is expected over the next 6-12 months if things continue to play out how I am expecting. As of today SEC approval of a LTC ETF is imminent but yet to be actualized.

#LTC Update #4 – July 10, 2025🔵 #LTC Update #4 – July 10, 2025
LTC was rejected from the fractal resistance left behind during its previous impulsive move. Just below this level lies an imbalance zone, which is likely to be filled first during any correction. If the downtrend continues, price could move toward $88, $87, and $86 levels.
Currently, long positions seem risky. However, a short setup around $91 with a 3% profit target could be an option for risk-takers. I’m personally not opening any trade at this time, but short-term traders may consider it.
On the upside, LTC is still holding above its 200 MA, which is a positive technical indicator. If it manages to hold above $92.30, the next upside target would be around $95.

#LTC Update #3 – July 8, 2025🔵 #LTC Update #3 – July 8, 2025
Litecoin continues its correction following the latest impulsive move. A strong resistance awaits at the $87.20 level, and breaking through it won't be easy. If price manages to close above $88.50 , a potential move toward the $92 zone may follow.
On the downside, if Litecoin pulls back below $82 , the next likely stop is around $77 . At this stage, I do not recommend opening any long or short positions. Observing the market is the better approach for now.

Litecoin:Is the main climb coming?hello friends👋
As you can see, the price, after falling in the support area specified by the buyers, has been supported and returned, forming an upward pattern.
Now we don't enter into a transaction with just one pattern, we also check the entry of buyers and the amount of currency and other factors and draw conclusions.
According to the points we have said, we have identified very important support points for you to buy step by step with capital and risk management and move to the specified goals.
🔥Follow us for more signals 🔥
*Trade with us safely*
