Litecoin vs Bitcoin —The Institutional Wave? Consider the ETFsStarting November 2022 LTCBTC (Litecoin vs Bitcoin) went on a major downtrend, until November 2024. After November 2024 this downtrend is no more.
There was a bounce late last year and this event changed the chart. The latest low last month, June 2025, ended up as a technical double-bottom. Less than 5% below the November 2024 low and this low happened after 217 days. This means that in seven months sellers became exhausted and they couldn't produce a new major low. This reveals that the bearish trend is over. Once the downtrend ends, we get a change of trend, a change of trend implies an uptrend, an uptrend implies long-term growth. We are looking at a long-term bottom and... From the bottom we grow.
This is not an opportunity that presents itself often. The BTC trading pairs are hard to trade. These are for experts only. A new opportunity is developing that can lead to exponential growth. It is amazing how this section of the market works. LTCBTC will grow as Bitcoin and the rest of the market grows. This tends to produce a multiplier effect that is hard to explain. You will understand when you see it in action.
LTCBTC is hitting bottom. The bottom is already established, several weeks old. The candles low is flat, we can expect massive growth; excitement and institutional adoption on Litecoin thanks to the ETFs, it will be the first time this pair grows in years and the type of chart it will produce it is hard to tell.
We are entering uncharted territory. The bullish phase can be mild just as it can be ultra-strong. There is no limit to the upside. It can grow for years or for 4 to 8 months. Both scenarios look good.
The best part is to catch the bottom; an early wave. Prices are low now, easy to buy and hold. Focus on the long-term.
Litecoin has good potential for this incoming 2025 bull market.
Thank you for reading.
Namaste.
LTC

#LTC Update #2 – July 5, 2025🟣 #LTC Update #2 – July 5, 2025
Yesterday, I pointed out that Litecoin was in a dangerous zone — not ideal for long or short entries. Since that update, LTC dropped another 4 percent, validating the caution I shared.
Right now, I still don’t see a clear opportunity for either direction. I believe LTC will make a decisive move within the next 24 hours, likely a sharp breakout or breakdown, unless a major external catalyst intervenes.
Here’s how I view potential support levels:
🔴 First stop: $85.5
🔴 Second stop: $82.5
🔴 Third stop: $77
Until direction becomes clear, I won’t be entering any trades. I’m watching closely.
If you're holding a profitable position, I’d consider taking partial profits here.

LTC Short SetupWait for the entry and execute, SL is smaller and if candle closes strongly above the zone then must close the trade. Hopefully it won't break easily this zone as bearish fvg + bearish order block lies here.

LTC Buy / Long SetupAs price wants to move in a range, SO that's another setup for LTC, invalidation is same as for short setup, candle closing below the mention zone immediately close the trade otherwise wick doesn't matter, wick do the damage body tells the story.

LTC/USDT Weekly – Massive Breakout Loading? 3-Year Triangle
📌 Litecoin is now standing at one of its most crucial technical levels since the 2021 bull run. After 3 years of compression inside a massive symmetrical triangle, price action is nearing a major breakout point. Will LTC finally explode upward, or are bears still in control? Let’s break it down!
🧠 Technical Pattern: Long-Term Symmetrical Triangle
This is a classic pattern that signals a prolonged phase of buyer-seller equilibrium, where lower highs and higher lows converge into a point of tension. Historically, this type of formation often ends in a sharp breakout in either direction.
🔺 Pattern Duration: Since May 2021
🔺 Converging trendlines: Tightening into Q3/Q4 2025
🔺 Historical breakout probability: ~60-75% chance of upward breakout in symmetrical triangles
🟢 Bullish Scenario (Upside Breakout):
If LTC breaks above the upper triangle resistance (~$100 – $115) with strong volume, it could ignite a major rally due to:
✅ The end of a multi-year consolidation
✅ Renewed investor confidence and potential altcoin season
✅ Technical confirmation of breakout from a long-term base
🎯 Upside Targets:
$134.66 – Psychological resistance and minor horizontal supply zone
$230.13 – Major resistance area from 2022 breakdown
$280.87 – Fib extension & key structural level
$325.00 – Pre-blowoff level from 2021
$387.91 – All-Time High (ATH) retest zone
📌 Based on the triangle’s base projection, a technical target of ~$280+ is plausible if breakout confirms.
🔴 Bearish Scenario (Downside Breakdown):
If LTC fails to hold the rising support (~$85), it may trigger a strong bearish reaction, especially if Bitcoin also loses key support levels.
📉 Downside Levels to Watch:
$65.00 – Key horizontal support
$49.00 – $39.00 – Historical demand zone from early 2020
$23.90 – Pandemic-era low (extreme bearish target)
📌 Breakdown confirmation requires a weekly close below support with high volume, ideally accompanied by macro risk-off sentiment.
🧩 Key Confirmations to Watch For:
1. Volume Surge on Breakout – Is the move supported by strong volume?
2. Successful Retest – Does price retest the breakout level as support?
3. Momentum Indicators – Weekly RSI > 50 and MACD bullish crossover can strengthen conviction.
📊 Fundamental & Sentiment Context:
Litecoin halving occurred in August 2023. Historically, price rallies follow 6–12 months after.
Often dubbed the “digital silver”, LTC remains relevant during altcoin cycles.
Whale accumulation has increased slowly since late 2024—possibly indicating long-term positioning.
✅ Conclusion & Strategy:
Litecoin is like a technical time bomb waiting to explode. Traders and investors should prepare for both breakout and breakdown scenarios. Patience and confirmation are key. Don’t chase—let the chart speak first.
🎯 Plan the trade, trade the plan. Don’t FOMO into noise—wait for structure!
#LTCUSDT #LitecoinBreakout #CryptoTechnicalAnalysis #SymmetricalTriangle #BullishSetup #AltcoinSeason #Litecoin2025 #CryptoChart #TrianglePattern #LitecoinRally

Litecoin is approaching a critical breakout point.
LTC has been consolidating within this symmetrical triangle for an extended period, showing decreasing volatility and tighter price action. The structure suggests that a significant move is imminent.
🎯 Target 1: $400
🎯 Target 2: $1,000
If the breakout occurs in the coming weeks, we could see Litecoin reaching the $400 level within the next 2 to 3 months, with potential to hit $1,000 over the next 12 months — especially if bullish momentum picks up across the crypto market.
Watch closely — the move could be explosive.
Best of luck to everyone! 🚀

The Chart Is Ugly. The Setup Is Beautiful. Welcome to the TrapI’m gonna try to keep it short (try, lol).
If you’re new here or just stumbled on this, here’s what you need to know:
LTC is the King of Pain… and the Prince of Parabolas.
It’s one of the hardest coins to hold — maybe the hardest.
It’ll test your patience, shake your conviction, and make you doubt everything...
right before it delivers.
Looking at the chart, LTC printed a bearish head-and-shoulders pattern.
But guess what? That’s PROBABLY the final trap — the one that triggers those explosive moves right after... the start of the parabolic season.
In my humble opinion, yeah — we MIGHT still drop more depending on what BTC does. But if you’re reading this and wondering what things look like before a big breakout — well, it’s exactly this:
Ugly charts, bearish structures, everyone doubting… and then boom — a new beginning. A rise.
That May move from $81 to $107? That was the breakout.
What we’re in now? It’s the bear trap.
What comes next? Should be something we’ve never seen before. I’ll leave it at that.
Some fundamentals:
LTC:
Hash-rate? Went parabolic — price hasn’t caught up yet.
Top 5 most used digital assets for moving value (by volume).
Born in 2011. 100% uptime. Still standing, still in the top 20. Survived it all.
Only 84M LTC will ever exist. Scarcity is real.
78% of LTC addresses are holding for over a year. They’re not selling cheap.
MWEB = optional privacy.
LiteVM = next-gen programmability for LTC.
Oh, and don’t forget: potential ETF approval.
If there’s one digital asset with a real shot — it’s LTC. Already declared a commodity by the CFTC.
Over 7 years of consolidation. If you zoom out to the monthly+ timeframe, all the bull and bear noise looks like one big sideways base.
Just to name a FEW.
Absurdly undervalued. Criminally underperforming.

Litecoin ETFs Target $199 Followed by $283 Followed by...It will definitely go higher but, let's do it step by step. Litecoin is setting itself to move up with targets being first $199 and then $283, these are the main targets for this bullish jump.
It will go higher of course but the market tends to fluctuate, never straight down but also never straight up. It advances nicely and then stops, a stop that you sense can last only a few days can result in a correction lasting more than an entire month. When you see this happening, you question yourself, "Why didn't I sell when prices were up?"
And the same pattern repeats; over and over, again and again. Now, Litecoin will produce a new bullish wave. The retrace can last 3 weeks rather than 6 weeks. It can last 12 weeks rather than 6 weeks, I don't know. So, instead of being 100% right or 100% wrong, we can sell portions at each target and just be happy/grateful with the results. Or, we can plan ahead... Focus on maximizing profits because Litecoin is ready to grow, the continuation of the bullish move; the next "leg-up."
» Litecoin Exchange-Traded Fund (LTC ETF).
Do you think this is bullish? Think about Bitcoin's ETFs results. It can be mixed at first, volatility, but the end is always bullish. Strongly bullish. Hyper-bullish. Litecoin is very small compared to Bitcoin. It can be a major boom!
Thanks a lot for your support.
Namaste.

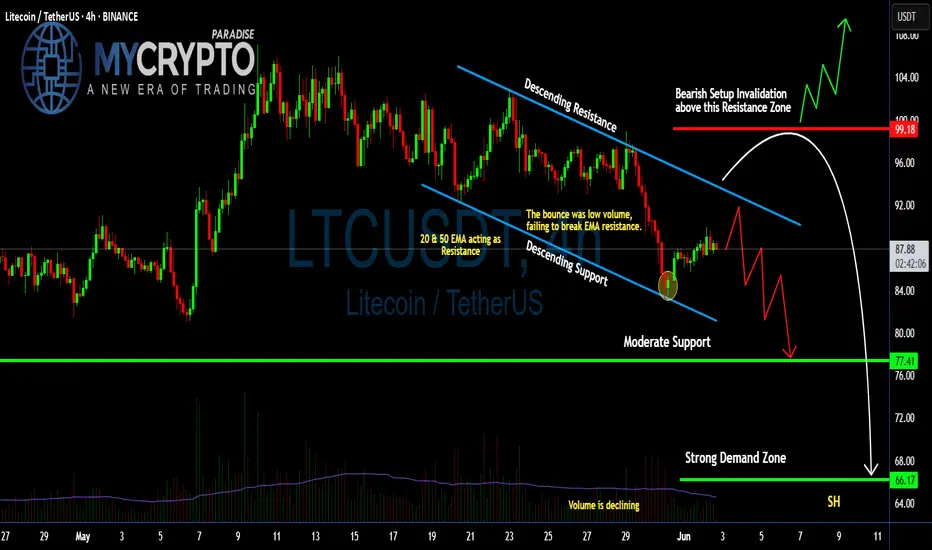
Can #LTC Bulls Make Recovery or Bears will Continue to Dominate?Yello Paradisers! Are you ready for the next wave of #LTC that can catch many traders off guard? Let's see the latest setup of #Litecoin and what can happen next:
💎#LTCUSDT is currently trapped inside a descending channel, signaling sustained bearish pressure. The most recent bounce came with declining volume and failed to reclaim the 20 & 50 EMA — a clear sign that bulls are running out of steam. These EMAs are now acting as dynamic resistance, capping every upward attempt.
💎The #LTCUSD structure remains bearish as long as the price stays below the key resistance zone near $92.00, especially under $99.18, which marks the invalidation of the bearish setup. If that zone is broken convincingly with huge volume, we could see a short squeeze toward $104.00. Until then, the bias will stay on the downside.
💎Support at $77.41 might offer temporary relief, but if sellers break through that level, all eyes will shift to the strong demand zone at $66.17 — a region that has historically attracted high-volume buying and could serve as a potential bounce area.
💎Volume continues to decline, showing that momentum is fading with each bounce. This increases the probability of a breakdown continuation unless the trendline resistance is flipped with strength and backed by volume. Right now, the chart shows weakness, not reversal.
Stay disciplined. The next big opportunity will come to those who wait not those who chase.
MyCryptoParadise
iFeel the success🌴
Litecoin LTC price analysisToday we will analyze the third candidate for ETF in the near future is CRYPTOCAP:LTC
An old coin, good fundamentals, 1:1 tokenomics like CRYPTOCAP:BTC but 4 times more coins, untapped potential, and the list goes on...
♎️ The main difference from the previous two candidates is the current market cap of the coins: CRYPTOCAP:XRP - $118 billion, CRYPTOCAP:SOL - $72 billion, #Litecoin only $6 billion
Accordingly, the prospects for growth in the price of OKX:LTCUSDT are many times greater
🔥 Currently, #LTCUSD price is near the potential purchase zone of $71.25-76.25
📈 Growth potential of at least $170-180
🐻Critical level of $67
_____________________
Did you like our analysis? Leave a comment, like, and follow to get more

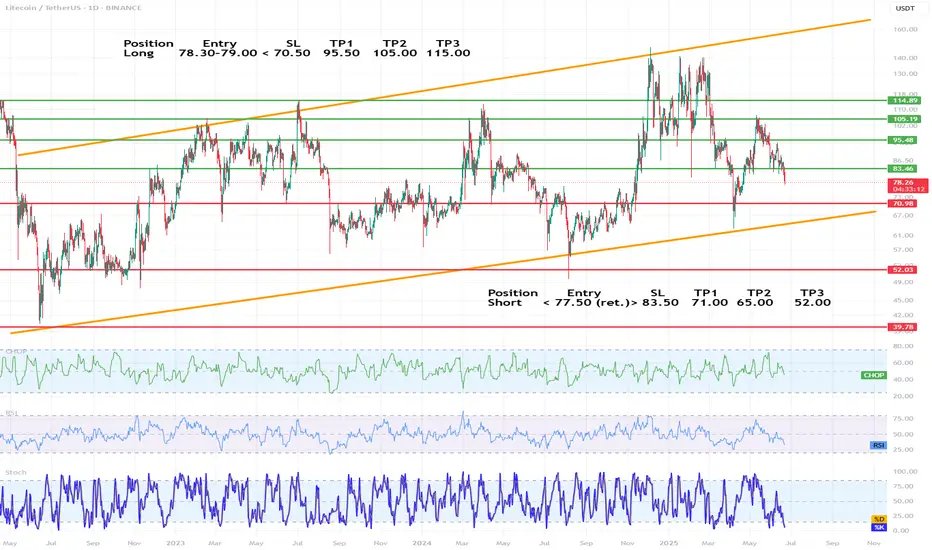
LTC/USDT chart technical analysis (1D)🔷 1. Trend and market structure
🔺 Main channels:
The chart is moving in an ascending channel (orange lines), the lower and upper limits of which have been respected since mid-2022.
The current price (around 78.3 USDT) is in the middle range of the channel, with a downward trend in recent weeks.
🔁 Market phase:
The price is in consolidation in a broader uptrend.
The last upward swing did not break through the previous peak (~135 USDT), which may indicate weakening momentum.
🔷 2. Key horizontal levels (support/resistance)
✅ Resistance levels (green lines):
83.46 USDT – the nearest resistance, currently being tested from below.
95.48 USDT – strong resistance from March-April 2024.
105.19 USDT – a level tested many times in the past.
110.00 USDT – a psychological level.
115.83 USDT – a local high from December 2023.
🛑 Support levels (red lines):
78.30 USDT – currently tested support level.
70.98 USDT – a key defensive level for bulls.
52.03 USDT – strong historical support.
39.78 USDT – the last line of defense, consistent with the lows from 2022.
📐 Dynamic support (orange line):
The lower boundary of the ascending channel – currently falls around 65 USDT and increases over time.
🔷 3. Technical indicators
📊 CHOP (Choppiness Index)
Oscillates near the lower values → the market is starting to leave the consolidation phase.
Potential directional movement soon, most likely downward (due to momentum).
📉 RSI (Relative Strength Index)
RSI below 50, currently around 40–45 → supply advantage.
Not oversold yet, but momentum is downward.
🔄 Stochastic
Well below 20, i.e. in the oversold zone.
Potential for a short-term bounce, but it can also go lower with a stronger sell-off wave.
🔷 4. Technical scenarios
🟢 Growth scenario (long):
Condition: Defending the level of 78.3 USDT and a quick return above 83.46.
Targets:
TP1: 95.48
TP2: 105.19
TP3: 115.83 (upper border of the channel)
SL: below 70.98 USDT
🔴 Bearish scenario (short):
Condition: Break 78.3 and retest as resistance.
Targets:
TP1: 70.98
TP2: 65 (lower channel line)
TP3: 52.03 (large accumulation zone)
SL: return above 83.46
🔷 5. Swing strategy proposal
Long
Entry 78.30–79.00
SL < 70.50
TP1 95.50 TP2 105.00 TP3 115.00
Short
Entry < 77.50 (ret.)
SL > 83.50
TP1 71.00 TP2 65.00 TP3 52.00
🔷 6. Additional comments
It is worth observing the price reaction at 70.98 USDT - this could be a capitulation level or a strong rebound.
The formation on the daily chart resembles a head and shoulders (H&S) - a warning signal for bulls.
LTC/USD Consolidates—Key Levels to Watch FenzoFx—Litecoin consolidates near $85.0, with key support at $81.0, aligning with last week's low. If support holds, LTC/USD could target $90.4. A drop below $81.0 invalidates the bullish outlook.

LTCUSDT - Movess?LTCUSDT have moves to be seen prior to anymoves to be taken in consideration! A small pull move down then to up!

LTC last point of support'' Decisive test of the remaining supply, allowing the “smart money” operators to ascertain whether is ready to be marked up... what should follow is the consistent dominance of demand over supply. This is evidenced by a pattern of advances ''
Failure to get back up above the trading range will result in lower lows, be careful.


Litecoin is Oversold—Is a Rebound Coming? FenzoFx—Litecoin swept liquidity below the previous week's low, aligning with the monthly low at $81.01, a strong support zone.
LTC trades near $83.70 with weak bullish sentiment. Stochastic at 11.00 signals an oversold market, suggesting potential consolidation or a rebound.
A bullish wave may emerge if LTC holds above $81.01, targeting $91.92. Closing below this level invalidates the bullish outlook.

Litecoin —It's All In Your Mind, Time To DecideTruly the longest consolidation phase has been experienced, since June 2022 until June 2025. This consolidation produced a broad channel for Litecoin but, make no mistake, this is a trading range.
The difference between a rising channel where consolidation is happening and a very strong bull market is the slope of the rise. The bull market price action produces a much stronger rise, as shown by the bars pattern.
The action becomes more erratic to the upside rather than stable and sideways. The market becomes euphoric because people cannot handle all the money they hold. Your account balance grows and grows and grows, so much that you lose all control. So much that you forget it, so much that you don't take action and then everything is gone.
It is incredible but still, many people do take advantage and those are mainly the ones with experience.
The first time we get it wrong. That's ok, we've all been there, nobody to blame rookie mistake.
The second time we do better but we still feel we could have done even better. If only we had more organization, more time to prepare; more experience...
The third time... This is the third time.
Thousands of millionaires are created in each bull market, tends of thousands, are you going to be one of those?
There is no competition. For you to make money nobody else has to lose money it doesn't work that way. It is different; the market gives, the market takes.
If you are ready to accept a lot the market will give you a lot.
If you are here to lose money the market will take everything away.
It is not about the whales, the bots or the exchange... It is all about you, it is all in your mind.
Some people join the last few days and make millions by buying big and selling right away, over and over. Some people lose millions by going LONG going SHORT when the market is neither going down or up. Some people are playing games.
You just need to decide, consciously and unconsciously what is your true goal. If you want financial independence, financial abundance, financial freedom, just make your choice. Say it, write it, see it, feel it... Believe it, and everything you want will be yours.
There is no limit other than your own mind.
The market will give you whatever you are ready to accept.
If you work for 10 millions dollars, that's exactly what you will get. But, if you work for 100 millions, hundreds you will get. There is no limit. It is all in your mind.
Namaste.

Litecoin - Expecting Bearish Continuation In The Short TermM15 - Clean bearish trend with the price creating series of lower highs, lower lows.
No opposite signs.
Expecting further continuation lower until the two Fibonacci resistance zones hold.
If you enjoy this idea, don’t forget to LIKE 👍, FOLLOW ✅, SHARE 🙌, and COMMENT ✍! Drop your thoughts and charts below to keep the discussion going. Your support helps keep this content free and reach more people! 🚀
--------------------------------------------------------------------------------------------------------------------
Disclosure: I am part of Trade Nation's Influencer program and receive a monthly fee for using their TradingView charts in my analysis.

Litecoin’s FVG at $85.8: A Key Pivot the Next LegFenzoFx—Litecoin’s momentum weakened from $91.00 to $87.40, now trading around $87.44 as the London session begins.
Early in the session, LTC took out the Asian session’s low, signaling a liquidity grab. The $87.44 support zone aligns with a bullish Fair Value Gap (FVG) and Monday’s low.
If the FVG holds, LTC/USD could push toward $89.11, the Asian session high, with $90.99 as the next bullish target. However, $90.99 forms a double top, with sell limits and buy stops above—potential liquidity. If $86.00 holds, this could be the next target.

LTCUSDT 1D AnalysisLTC ~ 1D Analysis
#LTC Buy after successfully breaking this resistance line with a short term target of at least 10%+ from here.

Litecoin Consolidation Nears End—New Downtrend Ahead?FenzoFx—Litecoin's consolidation near $91.0, marking 50% of its previous bearish leg, may be nearing its end as a long-wick bearish candlestick forms on the 4-hour chart.
Key support lies at $88.7, and a close below this level could trigger a downtrend targeting $87.00 and $86.00. The bearish outlook remains intact below $92.39 resistance.

Bearish Pressure Eases—Can Litecoin Recover?FenzoFx—Litecoin remains bearish after breaking below $93.55, though selling pressure eased near $83.0. Currently, LTC/USD is testing the bearish Fair Value Gap at $87.5.
A recovery toward $93.55 is possible if price closes above the $88.0–$90.0 zone, allowing bullish momentum to extend toward $92.00.
However, a dip below $85.0 would invalidate this outlook, with the next bearish target at $81.0.

Litecoin’s Sharp Drop—Will the Downtrend Continue?FenzoFx—Litecoin dropped 6.2% yesterday, marking its largest daily range this week. It failed to hold within the High Volume Node box, and selling pressure in the Asian session pushed the price below weekly support to a new low of $89.3.
Currently, LTC/USD is consolidating near the 61.8% Fibonacci retracement level, a key resistance zone. If this level holds, the downtrend may resume, targeting weekly support levels.
Given that Litecoin has already reached its average daily range, no major moves are expected today.
