LTC/USDT 12H chart reviewHello everyone, let's look at the 12H LTC chart to USDT, in this situation we can see how the price came out of the downward trend and currently you can see the movement of the newly created upward trend line. Going further, let's check the places of potential target for the price:
T1 = $ 89
T2 = $ 97
Т3 = $ 109
Let's go to Stop-Loss now in case of further declines on the market:
SL1 = 85 $
SL2 = $ 77
SL3 = $ 67
SL4 = $ 63
Looking at the RSI indicator, we see
Return to the lower limit, which can potentially give energy to make the price re -perform upward movement.
LTC

LTCUSDT 1D AnalysisLTC ~ 1D Analysis
#LTC Buy after successfully penetrating this resistant line with a short -term target of at least 10%+ from here.

Litecoin (LTC) - Long Setup📋 Context:
🔵 Open Interest stable or slightly increasing → healthy position building.
🔵 Top Traders Ratio strongly rebounding → top traders are re-accumulating long positions.
🔵 CVD Spot rising → real spot buying support is coming back.
🔵 CVD Futures rebounding → shorts being squeezed and absorbed.
🔵 Funding Rate neutral → no immediate risk of short squeeze against longs.
🔥 Liquidations:
🔵 95% of potential liquidations are shorts → strong imbalance to exploit.
🔵 Optical Map shows a wall of short liquidations just above the current price → objective is to grab them.
📈 Technical Structure:
🔵 Clean bullish structure on the 15-minute timeframe.
🔵 Stop Loss placed just below the recent swing low.
🎯 Trade Plan
Entry: Current price zone 85.7
Immediate Target (TP1): 87 $ → grabbing short liquidations.
Extension Target (TP2): 88 $ → if momentum remains strong.
Stop Loss (SL): Below 84 $ → invalidation if clean break of structure.

Is #LTC on the Edge of a Major Breakdown? Watch Key Levels Yello Paradisers! Is #Litecoin about to collapse after completing a suspicious Ending Diagonal pattern? Let’s dive into this critical setup on #LTCUSDT:
💎#LTC is currently trading around $87, sitting just below a major resistance zone between $92 and $97. Price has been moving inside a textbook Ending Diagonal formation, and based on the current structure, the 5th wave of this diagonal appears to still be unfolding—but the clock is ticking.
💎Volume has been fading even as price attempts to push higher, a classic warning sign deep inside a wedge. At the same time, momentum indicators are showing bearish divergence, hinting that the strength behind this up-move is running out of steam.
💎The red Resistance Zone above is absolutely critical. If #LTCUSD manages to break and hold above $96, the bearish setup would be invalidated, opening the path for a strong impulsive move toward $104 and beyond. However, unless that breakout happens with convincing volume, the odds strongly favor the downside.
💎If price fails to push higher, the first sign of confirmation will be a break below the ascending support trendline near $86–$84. A decisive move below this support would likely trigger a fast drop toward the next major support around $76. If that fails to hold, a full breakdown into the $64 region becomes very likely, as that's where strong historical demand exists according to the Volume Profile.
Play it safe, respect the structure, and let the market come to you!
MyCryptoParadise
iFeel the success🌴

Forming Bearish Head and Shoulders PatternWelcome to today's analysis! Let’s break down the current price action on CRYPTOCAP:LTC and potential trade setups.
🌐 Overview: CRYPTOCAP:LTC Forming Bearish Head and Shoulders Pattern
📈 CRYPTOCAP:LTC is currently forming a head and shoulders pattern, which is typically bearish and could indicate a potential downward move.
🔄 Current Scenario:
CRYPTOCAP:LTC has formed a left shoulder, head, and is now developing the right shoulder. The purple neckline is a key support level to watch.
A break below the purple neckline could signal a bearish continuation and a potential move toward the green line target level.
🔑 Key Levels to Watch
🔴 Neckline Support: Purple Neckline (Key level to watch for a breakout)
🟢 Target: Green Line Level (Measured move equal to the distance from the head to the neckline, projected downward from the breakout point)
🛠️ Trade Scenarios
📌 Bearish Scenario (Breakout Below Neckline)
If CRYPTOCAP:LTC breaks and holds below the purple neckline support, it could move toward the green line target level.
This breakout would confirm the head and shoulders pattern and suggest a potential downward trend.
📌 Bullish Scenario (Failure to Breakout)
If CRYPTOCAP:LTC fails to break below the purple neckline and instead moves higher, it could retest the resistance levels within the pattern.
A failure to hold below key resistance levels could indicate a potential reversal or further consolidation.
📌 Conclusion
CRYPTOCAP:LTC is forming a head and shoulders pattern. A breakout below the purple neckline support could signal a bearish move toward the green line target level. If the price fails to break out, further consolidation or a retest of resistance levels may be necessary

LTCUSDT | Signs of Recovery Meet Strong ResistanceLTCUSDT has shown encouraging signs of a bounce, but it’s now approaching the red box, which marks a significant resistance zone. This area has repeatedly capped any rally, and without clear confirmation, attempts to push higher are likely to stall.
🔴 Key Resistance Zone
The red box represents a cluster of prior supply where sellers stepped in aggressively. Any move toward this zone demands caution, because history tells us price struggles to clear it.
📉 Short Setup Criteria
Lower-Time-Frame Breakdowns
Wait for a clear rejection inside the red box on a 5‑ or 15‑minute chart. A shift from higher highs to lower highs signals weakening bullish momentum.
CDV Confirmation
Look for a negative divergence or uptick in selling volume on CDV to confirm sellers are winning the battle at resistance.
Defined Entries
Enter short only when both price structure and volume align. Place your stop just above the red box to manage risk.
🟢 Bullish Flip Conditions
I will not insist on my short idea. If LTCUSDT breaks above the red box with strong volume and then retests it successfully as support, I will switch to a bullish bias. In that scenario, lower‑time‑frame breakouts back toward new highs will be my trigger to enter a long position.
💡 Why This Matters
We’re not guessing—this approach is built on watching how price interacts with key zones and waiting for the market’s confirmation. By trading only when conditions align, you avoid emotional decisions and position yourself for higher‑probability moves. Keep an eye on that red box. Let price show its true intent, and then act with confidence.
📌I keep my charts clean and simple because I believe clarity leads to better decisions.
📌My approach is built on years of experience and a solid track record. I don’t claim to know it all but I’m confident in my ability to spot high-probability setups.
📌If you would like to learn how to use the heatmap, cumulative volume delta and volume footprint techniques that I use below to determine very accurate demand regions, you can send me a private message. I help anyone who wants it completely free of charge.
🔑I have a long list of my proven technique below:
🎯 ZENUSDT.P: Patience & Profitability | %230 Reaction from the Sniper Entry
🐶 DOGEUSDT.P: Next Move
🎨 RENDERUSDT.P: Opportunity of the Month
💎 ETHUSDT.P: Where to Retrace
🟢 BNBUSDT.P: Potential Surge
📊 BTC Dominance: Reaction Zone
🌊 WAVESUSDT.P: Demand Zone Potential
🟣 UNIUSDT.P: Long-Term Trade
🔵 XRPUSDT.P: Entry Zones
🔗 LINKUSDT.P: Follow The River
📈 BTCUSDT.P: Two Key Demand Zones
🟩 POLUSDT: Bullish Momentum
🌟 PENDLEUSDT.P: Where Opportunity Meets Precision
🔥 BTCUSDT.P: Liquidation of Highly Leveraged Longs
🌊 SOLUSDT.P: SOL's Dip - Your Opportunity
🐸 1000PEPEUSDT.P: Prime Bounce Zone Unlocked
🚀 ETHUSDT.P: Set to Explode - Don't Miss This Game Changer
🤖 IQUSDT: Smart Plan
⚡️ PONDUSDT: A Trade Not Taken Is Better Than a Losing One
💼 STMXUSDT: 2 Buying Areas
🐢 TURBOUSDT: Buy Zones and Buyer Presence
🌍 ICPUSDT.P: Massive Upside Potential | Check the Trade Update For Seeing Results
🟠 IDEXUSDT: Spot Buy Area | %26 Profit if You Trade with MSB
📌 USUALUSDT: Buyers Are Active + %70 Profit in Total
🌟 FORTHUSDT: Sniper Entry +%26 Reaction
🐳 QKCUSDT: Sniper Entry +%57 Reaction
📊 BTC.D: Retest of Key Area Highly Likely
📊 XNOUSDT %80 Reaction with a Simple Blue Box!
📊 BELUSDT Amazing %120 Reaction!
I stopped adding to the list because it's kinda tiring to add 5-10 charts in every move but you can check my profile and see that it goes on..

ALTCOINS | Alt Season | BUY ZONES1️⃣ATOM / BINANCE:ATOMUSDT
Ideal buy zone is the lower area, unless it CLOSES daily candles above the upper area - then the bottom is likely in and chance for lower entry is slim
2️⃣ Litecoin LTC / BYBIT:LTCUSDT
This likely means a longer wait until ideal entry points, weighted heavier towards the lower zones:
3️⃣ Fantom FTM / BITSTAMP:FTMUSD
Seeing a trendline here that should be noted for a likely buy:
4️⃣ DOGE / BINANCE:DOGEUSDT
DOGE price has not yet begun to trade UNDER moving averages in the weekly either, meaning the bearish cycle is still in early days:
DOGE ideal entry for me would be for accumulation, long-term:

Litecoin Breakout and Potential RetraceBINANCE:LTCUSDT : Hey Traders,
In today's session, we're keeping a close eye on LTC/USDT as it approaches the $77 area, a key support-turned-resistance zone.
Litecoin recently broke below its previous uptrend, indicating a potential shift in momentum. It is now in a corrective phase, with price retracing back toward the broken trendline and horizontal resistance around $77.
This level could act as a strong rejection zone, offering a potential selling opportunity if bearish confirmation shows up.

LTC: The 8 Years Long Triangle#LTC has been forming a corrective triangle since 2017. Price action from 2022 to now indicates the triangle is nearing completion, which indicates a nearing bullish breakout.
Even a dip below $50 wouldn’t invalidate the setup, as long as the triangle holds.
#Litecoin

LTC/USDT:BUYHello friends
Due to the good price growth, we see that the price has hit a lower ceiling and has fallen, which we can buy in stages during the price decline, within the specified ranges and move with it to the specified targets.
Observe capital and risk management.
*Trade safely with us*

Litecoin Set Up For Massive Move LTCUSD A chart showing a big move along the lower band of this overarching channel
I expect price to come near or hit $1000 which moves well with the previous ATH in 2017/18
Sleeping giant

Short-Term Short Position LTC/USDT🔥 LTC/USDT – Approaching Key Short Zone
Litecoin (LTC) has formed a rising wedge structure after rebounding sharply from local lows. Price now faces a critical short zone near 81.62 - 84.16, where sellers could potentially step in if LTC fails to break above with conviction.
🟣 Zone to Watch
“Possible Short Zone” (in purple) — a high-probability entry area for short trades given the overhead resistance and wedge convergence.
Entry Points:
Entry 1: ~81.62 (initial level within the wedge)
Entry 2: ~84.16 (upper boundary, near resistance)
📉 Momentum & Setup
Chart Formation: The rising wedge implies potential exhaustion of bullish momentum if price fails to continue upward. A break below wedge support often signals a bearish turn.
Volume Consideration: Look for a sell-volume uptick or a clear rejection around Entry 1 or 2 or within the short zone to confirm a likely reversal.
🟢 Take-Profit Zones
✅ TP1: ~79.25
✅ TP2: ~75.08
✅ TP3: ~69.55
✅ TP4: ~63.53 (Extended downside if momentum persists.)
❌ Invalidation Level: 87.30+
(A strong close above this level indicates a breakout from the short window)
🧠 Narrative
This setup showcases a potential bearish retest, as LTC’s swift rebound has led price into a narrowing wedge. If buyers fail to push beyond 81.62 – 84.16
Savvy traders may anticipate a correction. A volume-backed rejection in this zone could send LTC back toward its lower support levels.
🎲 Market Context
Monitor broader market sentiment and Bitcoin’s performance; a strong BTC rally could invalidate downside expectations.
📌 Risk Management
Position Sizing: Trade responsibly according to your risk tolerance.
❌ Stop-Loss: Place it above the invalidation level (e.g., around 87.30+ to mitigate unforeseen breakouts.
Reevaluate if the market shows signs of bullish continuation beyond the wedge.

LTC/USDT 1W ChartHello everyone, I invite you to review the current situation on LTC. When we enter the one-week interval, we can see how the price is struggling to return above the upward trend lines.
Here you can see how the current rebound is going towards resistance at $ 82.82, then resistance is visible at $ 95, but an important resistance point will be around $ 115.
Looking the other way, you can see that the price has gone below the support level at $ 70, however, we could see a quick rebound, in a situation where the price continues to go down, the next very strong support is around $ 50.
It is worth looking at the RSI indicator, which shows another descent in the week interval to the level where we could previously see strong price rebounds, which could potentially repeat itself.

Litecoin: Your Altcoin ChoiceAn ultra long-term accumulation zone has been activated. Litecoin has been producing higher lows since 2018.
Right now we are looking at a major, major buy opportunity. Likely the lowest price before the start of the 2025 bull-market.
Litecoin just activated its 2022-2024 buy-accumulation-support zone. A very long, wide and strong zone.
I don't think there is much to say about Litecoin other than the time is right and the time is ripe. Growth can only happen after the completion of a bearish wave. A bearish wave is exactly what is seen on the chart now between December '24 and present day, with the bottom being hit just two days ago on April 7. This is no "bear market" as Litecoin has been sideways long-term as it can be seen clearly on this chart.
Long-term consolidation can only happen for so long. Litecoin bottomed in June 2022, almost three years and a half ago. This is the longest accumulation phase ever, and this in-turn will produce a bull market that is equally strong.
A new All-Time High is definitely on the cards for this year. This is true for Litecoin as it is true for Bitcoin, Ethereum, Cardano and most of the Altcoins market.
It is still early though and I know it is easy to doubt, and this is ok. But this long-term view of the chart leaves no room for doubt, the market has been rising from its base. Long-term higher lows, since December 2018, a signal of strength. The last bullish jump was the "initial bullish breakout," it tends to happen before the bull market phase.
The bull market is the cycle when everything grows.
A bull market tends to end in a bull-run.
A bull-run means euphoria across the market. Maximum bullish momentum accompanied with maximum growth.
We are getting so close now. We are looking good and we are looking up.
My recommendation stays, buy and hold.
Go all-in 100% Crypto.
Plan ahead if you decide to trade anything other than spot.
Spot is an easy buy and hold focusing on the long-term.
Leverage (margin) can be more complex and everything can be lost with a mistake. If you have any doubts, do not use this system for now. Only use it with profits or money to spare.
Right now is the time to secure very good and strong entry prices before the best since 2021. It will be amazing.
Thank you for reading.
Litecoin, a great Altcoin Choice!
Namaste.

LTCUSDT 1WLTC ~ 1W Analysis
#LTC Buy gradually when re -testing this support with a short -term target of at least 15%+.

Litecoin Approaching Resistance: 20% Drop to $70 Support ExpecteHello and greetings to all the crypto enthusiasts, ✌
Let’s dive into a full analysis of the upcoming price potential for Litecoin 🔍📈.
Litecoin is situated within a parallel channel and is nearing an important trendline and resistance zone. Given the current market conditions, I foresee a potential correction of approximately 20%, with a key support level at $70. This price point not only holds psychological significance but also acts as a crucial technical support area.📚🙌
🧨 Our team's main opinion is: 🧨
Litecoin is near a key trendline and resistance, and I expect a 20% drop to $70, a strong support level with psychological significance.📚🎇
Give me some energy !!
✨We invest hours crafting valuable ideas, and your support means everything—feel free to ask questions in the comments! 😊💬
Cheers, Mad Whale. 🐋

LTCUSD Litecoin OH NO TARIFFS! Everyone SELL NOW!The market reacted to the tariffs negatively as expected. I don't think these tariffs will last long. Countries will cave and remove their tariffs. Bottom line is they need us more than we need them. Once global free and easier trade starts you're going to see a boom cycle like never before. This is the bottom and the beginning of the biggest bull run you'll ever see. I don't get involved in politics but this move that Trump made with the tariffs is going to be a major positive for the USA and the world moving forward. This isnt 1929, we live in a much more advanced world now. Collapses and depressions are a thing of the past in my opinion.
As for Litecoin I see it coming down to test around $70 dollars by the middle of April. This is also timed almost perfectly to the 2017 run Litecoin had, coincidentally trump was starting his first term in 2017 as well. Also timed perfectly to when tax day is over for USA.
Many have capitulated and sold everything thinking a giant recession is coming, or a war, or a collapse, or aliens, or you name it people are scared of their own shadows lately. Like a plague of Grackles where one gets spooked and the whole lot of them get scared and take off when they dont even know why. This is how the markets work though, most will make the wrong decision so the few who made the right decision can profit from their mistakes. Once the market starts to run again those who sold will think its just a fake pump or dead cat bounce and wont buy in. Then the market will continue to rise and rise and finally when its near an all time high those who capitulated and sold early will fomo back in and buy the top to provide liquidity for those who were called crazy for buying the bottom. Its a cycle thats been happening since markets started.
So Im sticking with my predictions for Litecoin, I am not falling for this bear trap crap. Im doubling down. This is not financial advice. This is just my opinion.
LTC Targets $70: A High-Probability Reversal SetupLitecoin (LTC) has just broken below the critical $80 low, signaling that bearish pressure is firmly in control. Currently trading at $79—just beneath the swing low at $80—LTC is also sitting below the monthly open at $82.98. With the bears flexing their dominance, traders are left wondering: Where does the price head next? What’s the target for the bears, and where can bulls find an opportunity to re-enter the market? Let’s dive into the charts, pinpoint the key levels, and craft a plan that could turn this downturn into a golden opportunity.
The Current Market Picture
LTC’s recent breach of $80 confirms the bearish momentum that’s been brewing since its peak at $147.06 on December 5, 2024. Litecoin enjoyed a stellar 122-day bullish run, soaring +195% from $49.80 to high at $147.06. Now, we’re on the 122nd day of a downtrend—a poetic symmetry that hints at a potential turning point. The question is: where will this descent find its floor, and how can we position ourselves for what’s next?
Support Zone: The $70 Fortress
To identify a robust support zone, we need confluence—multiple technical factors aligning to form a level that’s tough to crack. Here’s what the chart reveals:
Fibonacci Retracement: Using the Fib tool from the 2024 low at $49.80 to the high at $147.06, the 0.618 retracement at $86.95 has already been lost, turning our focus to the 0.786 level at $70.61. This deep retracement is a classic spot for reversals, making it a prime candidate for a support zone.
Yearly Level: At $70.14, this pivot is nearly identical to the 0.786 Fib level, adding significant weight to the area.
Volume Profile: The Point of Control (POC) from a 1.5-year trading range sits right around $70, just above the Fib level. This is the price with the highest traded volume over that period—a natural magnet for price action.
Yearly Order Block: Visualized as a green channel, this order block reinforces the $70 zone, suggesting past institutional buying interest or significant support.
Together, these factors create a $70 support zone that’s brimming with confluence. It’s not just a random level—it’s a fortress where bulls could mount a serious stand.
Long Trade Setup:
Entry Strategy: Use a Dollar-Cost Averaging (DCA) approach to build your position. Start with small buys around $75, laddering down to $70, and increase your position size as price nears the core of the support zone. Aim for an average entry of $73/72.
Stop Loss (SL): Set it below $68 to protect against a deeper breakdown while giving the trade room to breathe.
Take Profit (TP): First Target: $80 (the swing low and monthly open not far off). Main Target: $100 (a key psychological and resistance zone).
Risk-to-Reward (R:R): With an average entry at $73 and SL at $68, you’re risking $5 to gain $27 (to $100)—a stellar 5:1 R:R or better. This is a high-probability setup that rewards patience.
Execution Tip: Watch for bullish signals in the $70-$75 range—candlestick pattern, volume spikes, or RSI divergence. This isn’t about chasing; it’s about precision.
Resistance Zone: The $100 Battleground
If bulls reclaim control and push LTC higher, the $100 psychological level looms as a major resistance zone. Here’s why it’s a HOTSPOT:
Yearly Open: At $103.28, this level is close enough to $100 to bolster its significance.
Anchored VWAP: Drawn from the 2024 low at $49.80, the VWAP currently sits around $102.4, adding another layer of resistance.
Historical Context: The $100 mark has been a recurring battleground, with bulls and bears clashing repeatedly. It’s a price that carries weight.
A rally to $100 wouldn’t just be a recovery—it’d be a statement. A clean break above could hint at a broader trend reversal, but until then, it’s a ceiling to respect.
What’s Next? Bears vs. Bulls
For now, the bears are driving LTC lower, with the break below $80 opening the door to the $70 support zone. That’s their likely target—a level where selling pressure could exhaust itself. For bulls, $70 isn’t just a floor; it’s a launchpad. The DCA long setup offers a low-risk, high-reward entry.
Wrapping It Up
Litecoin’s drop from $147.06 to $79 has been brutal, but the chart is screaming opportunity. The $70 zone—backed by Fibonacci, levels, volume, and order blocks—is where bulls could turn the tide. With a DCA entry at around $73/72, SL below $68, and a main target at $100, you’ve got a trade setup that could deliver a 5:1 payoff. Meanwhile, $100 stands as the bears’ next big test if momentum shifts.
So, will you wait for LTC to hit $70 and strike, or watch the action unfold? The levels are clear—now it’s your move. Use this analysis to sharpen your edge, and let’s see where Litecoin takes us in the days, weeks, and months ahead.
________________________________________
If you found this helpful, leave a like and comment below! Got requests for the next technical analysis? Let me know, I’m here to break down the charts you want to see.
Happy trading =)

LTC - Bulls Getting Ready!Hello TradingView Family / Fellow Traders. This is Richard, also known as theSignalyst.
📈 Long-term, LTC has been overall bullish, trading within the rising channel marked in red.
📍 As it retests the lower bound of the channel — perfectly intersecting with the blue support—I will be looking for medium-term longs.
🚀 For the bulls to take over long-term and initiate the next bullish phase, a breakout above the last major high marked in orange at $97 is needed.
📚 Always follow your trading plan regarding entry, risk management, and trade management.
Good luck!
All Strategies Are Good; If Managed Properly!
~Rich

3-Phase Litecoin FractalWe are experiencing 2017 again. coins like CRYPTOCAP:LTC just go sideways for infinity while CRYPTOCAP:ETH gets sent to hades. i have no idea what will trigger a pump but it just feels so familiar. the phases of the fractal from LTC in 2017 are almost identical (excluding timing).

Bitcoin BTCUSD The Move Down Is OverI posted this chart in February 2027, I was unable to update it. This is playing out exactly how I predicted. Bitcoin loves these double tops and the corrections are textbook almost every time. Bitcoin may double bottom but on a closing basis on the 5 day I am predicting that Bitcoin will NOT close lower than the measured move. Wicks below sure but on a cloing basis which the Line chart shows we are right on track. I think that by the middle to late April we are above the previous high and en route to new all time highs. There is no bear market coming any time soon. Bitcoin is going to astronomical numbers, numbers most cant fathom. None of this is financial advice this is just my opinion. Like and follow for updates. Thank you

LONG Position LTC/USDT#Singal
LTC/USDT
🟢 LONG Position
🎲 Entry1 @ 76.19
🎲 Entry2 @ 74.62
✅ Target1@ 79.35
✅ Target2 @ 84.66
✅ Target3 @ 91.46
✅ Target4 @ 104.39
❌ Stop Loss @ 69.56
Leverage: 5X_15X
Margin: 10% of Wallet Balance
⚠️"Take Care of Risk Management for Your Account"

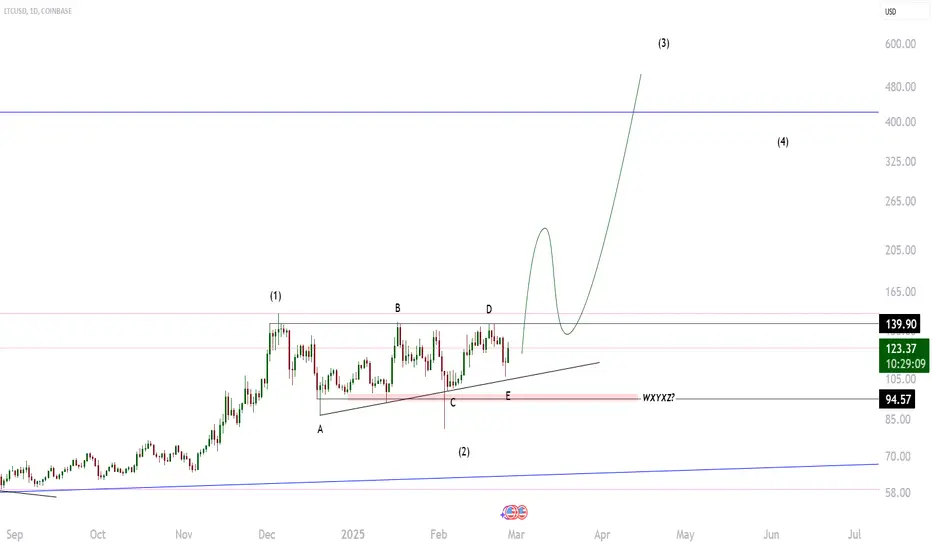
LTC new trendglobal idea graph
completion of the correction in the form of ABCDE and continuation of the trend !
It is possible to expand into a WXYXZ correction when the minimum of the E point is broken - then the impulse wave will be even stronger.