DOT & LTC TRADE SET UPDOT LONG
Entry Price 1: $4.60
Entry Price 2: $4.40
Stop Loss: $4.10
Take Profit 1: $4.80
Take Profit 2: $5.00
Take Profit 3: $5.20
Take Profit 4: $5.50
Status: ACTIVE
LTC NEUTRAL WAITING FFOR BREAK OUT
LTC

Litecoin $LTC to 109$?⚠️ RISK TRADE ⚠️
👑 #LTC/USDT BUY 👑
Entry price:
91 🟩
Targets:
1️⃣ 97🎯
2️⃣100🎯
3️⃣106🎯
4️⃣109🎯

LTCUSDT Breakout Loading….BINANCE:LTCUSDT has been consolidating for several days, repeatedly testing resistance levels. This pattern suggests a potential breakout is on the horizon. With ETH already gaining momentum, Litecoin could follow suit. Once the market starts moving, plenty of trading opportunities may arise.
Trade Smart: Always use a stop loss and manage your risk effectively.
BINANCE:LTCUSDT Currently trading at $91.5
Buy level: Above $91
Stop loss: Below $83
Target : $130
Max Leverage 3x
Always keep Stop loss
Follow Our Tradingview Account for More Technical Analysis Updates, | Like, Share and Comment Your thoughts

LTC Long SetupWould like to see a liquidity grab at $89.60 before moving to fill the gap.
Entry: 89.60
TP: 94.31 | 95.34 | 96,49

LTC Ready for PUMP or what ?The price can encounter a strong pump after declining to the bottom of the triangle, and after breaking the triangle, it can reach the desired targets.
Give me some energy !!
✨We spend hours finding potential opportunities and writing useful ideas, we would be happy if you support us.
Best regards CobraVanguard.💚
_ _ _ _ __ _ _ _ _ _ _ _ _ _ _ _ _ _ _ _ _ _ _ _ _ _ _ _ _ _ _ _
✅Thank you, and for more ideas, hit ❤️Like❤️ and 🌟Follow🌟!
⚠️Things can change...
The markets are always changing and even with all these signals, the market changes tend to be strong and fast!!

DOGE RUN IS OVER! TAKE PROFITS OR HOLD YOUR BAGS TILL 2025!Its clear that the doge run is pretty much over. DOGE is headed back down to $.05 and possibly lower over the next few years to maybe below 1 cent, till the next potential crypto run around 2025. These little pumps from Elon and friends is all just a joke so they can empty their bags and have the liquidity to do it while everyone else is buying in to these hypes. I said this weeks ago if you look at my other chart that this thing needs years to consolidate and correct. It outpaced the market in its run and went straight up and in this market anything that goes straight up comes straight down. Also there is no use case and DOGE is not being used, this is all a hype run and a get rich quick pump and dump. Once the rest of the market starts the next run up DOGE may have a bounce but only in dollar value as everything is pegged to Bitcoin but its BTC/DOGE ration will fall. If you believe in the tech then hold your bags and stop looking at the price. If you are just trying to make some money then this may be the time to get out and take profits if you haven't already or cut your losses if you bought in at the top. Good Luck.
If you have any questions or just appreciate this idea then leave me a comment. Follow me for frequent updates as well and if you have a chart you would like me to look at then let me know. Thank you all and good luck.
NOT FINANCIAL OR TRADING ADVICE JUST MY OPINION.

Litecoin is in a bearish cycle (12H)From the point where we placed an arrow on the chart, it appears that Litecoin's complex correction has begun.
Currently, we seem to be in wave C of this correction.
Wave C, based on the 3D structure, could end at demand 1, leading to wave D, which is a bullish wave.
However, ultimately, wave E could conclude within the demand 2 zone.
Liquidity pools for waves C and E are marked on the chart, and it is expected that each will be swept in turn.
For risk management, please don't forget stop loss and capital management
Comment if you have any questions
Thank You

Final Minutes of Overtime - LTC - POW + Ready for One?**Final Minutes of Overtime - LTC - POW: Is the Market Ready for One Last Move?**
As the market continues to move through uncertain and volatile conditions, many investors and analysts are beginning to wonder: Are we approaching the final minutes of overtime? In the world of cryptocurrency, the game feels like it’s in its final stretch, with significant movements happening across assets like Litecoin (LTC) and Proof of Work (PoW) consensus mechanisms. The question on everyone's minds: Is the market gearing up for one final, significant move?
### The Current State of the Market
We’re witnessing a market that has undergone substantial fluctuations over the past months, with assets like Litecoin (LTC) showing resilience despite periodic downturns. LTC, in particular, has been on the radar of many long-term investors due to its potential for significant growth, bolstered by an increasing demand for privacy and decentralized transactions. With its unique position in the crypto ecosystem, LTC’s price has been heavily influenced by both macroeconomic trends and the movement of Bitcoin, often seen as a bellwether for the broader market.
On the other hand, Proof of Work (PoW) systems, while facing increasing scrutiny due to energy consumption concerns, still remain at the heart of the crypto world. The debate between Proof of Stake (PoS) and PoW has been a hot topic, but despite this, PoW remains a tried-and-true consensus mechanism, with Bitcoin, Litecoin, and Ethereum (prior to its transition to PoS) all operating on this model. As institutional interest grows, the market is at a crossroads, with many wondering if PoW systems will continue to dominate, or if PoS alternatives will ultimately take over.
### Overtime in the Market: A Final Push?
The analogy of "overtime" is fitting here, as the cryptocurrency market often feels like a game of high stakes, constantly on the edge of dramatic swings. Historically, the final minutes of an overtime game in sports tend to be the most intense, as teams push for one final victory. Could the market be poised for a similar finale?
Many are looking at the current market indicators — from on-chain analysis to price movements — and asking if there is one last rally in store. While we’ve seen some signs of stabilization in recent weeks, there’s an underlying sense of uncertainty. Will Litecoin make another push upwards, leveraging its unique use cases? Will institutional investors begin to take greater positions in PoW-based coins as regulations become clearer? These are the questions that are driving market sentiment.
### The Role of Institutional Investors
Institutions are becoming an increasingly important part of the crypto landscape, and their involvement could be a decisive factor in this final move. As more established financial institutions dive into the cryptocurrency space, they may help provide the liquidity and stability needed for another price surge. However, institutional involvement also brings the possibility of increased regulation, which could dampen the explosive potential the market has seen in the past.
In particular, Litecoin has seen growing attention from institutions due to its low transaction fees and relatively faster transaction times compared to Bitcoin. As more legacy financial systems explore ways to integrate blockchain technology, could Litecoin’s relatively light energy footprint and established infrastructure make it an attractive option for institutional adoption?
### Technological Developments: Will They Catalyze the Last Move?
As the market moves toward its final minutes of overtime, several technological developments could help to catalyze that final, dramatic move. Key among them are scalability solutions, interoperability enhancements, and increased privacy features. For instance, the potential launch of Layer 2 scaling solutions for Litecoin could boost its usability, allowing the coin to be used for daily transactions more efficiently.
In addition, Proof of Work systems are still at the core of many projects, with developers continuously working on ways to make them more energy-efficient and less controversial. If these advancements gain traction, they may alleviate concerns surrounding the environmental impact of PoW, potentially boosting investor confidence and causing a rally.
### The Final Push: What to Expect?
As we move into the final moments of overtime in the cryptocurrency market, the future remains uncertain. While some analysts predict a final surge, others believe the market may be due for a cooling period. What we do know is that Litecoin (LTC), along with Proof of Work systems, will continue to play an important role in shaping the market’s direction.
The question isn’t necessarily whether the market is ready for one last move — it’s how that move will unfold. Will the market rally as we’ve seen in previous cycles, or will it cool off and take a step back for further consolidation?
### Conclusion
The final minutes of overtime in the cryptocurrency market present a fascinating and nerve-wracking scenario for investors, with assets like Litecoin and PoW mechanisms positioned for what could be one last push. As the market navigates these uncertain waters, only time will tell whether we’ll see a dramatic finish or a slower, more controlled progression toward stability. Whatever the outcome, it’s clear that the next move will have significant implications for the future of cryptocurrency.
For now, all eyes are on the market, waiting for the final whistle to blow.

Litecoin Set to Break Below Support Point- $60 in Sight?Litecoin ( CRYPTOCAP:LTC ) a cryptocurrency that was designed to provide fast, secure and low-cost payments by leveraging the unique properties of blockchain technology is set to go bearish amidst dipping down to the support point should the market continue its bearish pattern, CRYPTOCAP:LTC is set to tanked finding support in the $60- 65 support.
With buying pressure decreasing and Relative Strength Index (RSI) at 31.92, CRYPTOCAP:LTC could be on the cusp of a selling spree.
Similarly, a breakout above the $140 resistance zone could liberate CRYPTOCAP:LTC from the bears thereby aiming new resistant points.
However, data from DefiLama shows about $2.23 million has been locked in Total Value lock (TVL) on the Litecoin ecosystem hinting on a development on the Litecoin chain in the long term. This value shows a level of trust placed on the Litecoin Blockchain.
About Litecoin
Litecoin was released via an open-source client on GitHub on Oct. 7, 2011, and the Litecoin Network went live five days later on Oct. 13, 2011. Since then, it has exploded in both usage and acceptance among merchants and has counted among the top ten cryptocurrencies by market capitalization for most of its existence.
The cryptocurrency was created by Charlie Lee, a former Google employee, who intended Litecoin to be a "lite version of Bitcoin," in that it features many of the same properties as Bitcoin—albeit lighter in weight.
Litecoin Price Live Data
The live Litecoin price today is $87.46 USD with a 24-hour trading volume of $508,275,483 USD. Litecoin is down 3.21% in the last 24 hours, with a live market cap of $6,608,334,524 USD. It has a circulating supply of 75,558,468 LTC coins and a max. supply of 84,000,000 LTC coins.

LTC Litecoin: Is the bottom in? Bottom in on LITECOIN? Are you bullish?
Long term im bullish on this coin as a side gig. Look how the ws are forming.. juicy?
Question is, have we bottomed or is more room to drop down to under 60EUR? It could drop even more, with the lunar eclipse coming on friday.. but we have hit the 78.6 already... RSI 44...
What do you think?

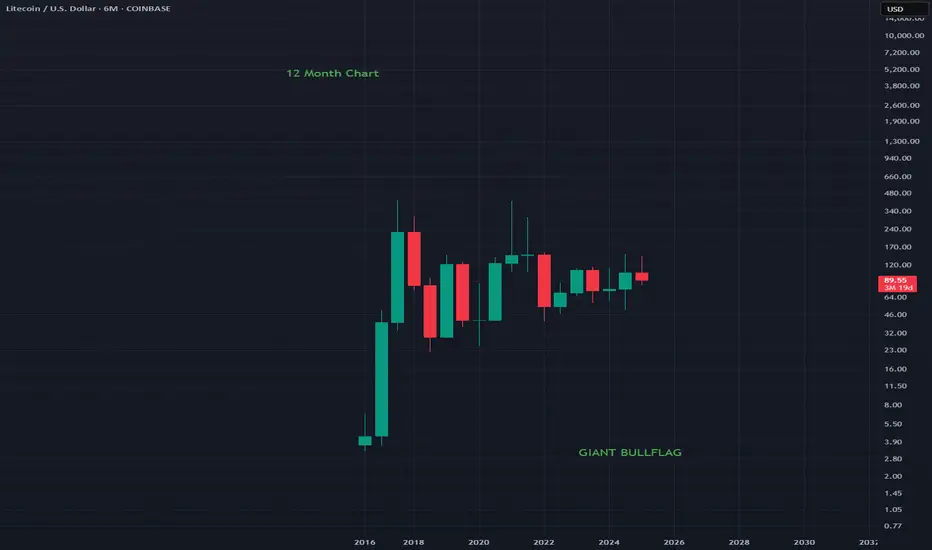
LTCUSD - 12 Month Chart Litecoin has produced a beautiful Bullflag on the 12 Month chart
Its honestly crazy how great this looks on a yearly timeframe
If you want to go very very long this is a great option
MASSIVE BULLFLAG
Litecoin (LTC): Last Crash Before New ATH?We are seeing yet another rejection from upper resistance zone, which can send price back for another -20%...
More in-depth info is in the video—enjoy!
Swallow Team

LTCUSD BUY AND SELL ZONES FOR SHORT TERM GAIN.Charting the buy and sell areas for a short term upside move in Litecoin.


Short Term Could Drop Be Careful Here - Possible $100Some bad news came out. Bybit got hacked for a lot of Ethereum. How this happens I dont understand but more than likely an inside job. These run out a basement exchanges are dangerous never leave your crypto on an exchange, NONE OF THEM.
Anyways I dont like the break of this rising wedge or potential bear flag. If this deosnt break back into the wedge and close in it then we could se another drop to about 100 or so if the measured move plays out. Be cautious here.
Not Financial advice.

LTCUSDT 1WLTC ~ 1W Analysis
#LTC This support block continues to be maintained so far.
Buy gradually from here with a minimum target of 20%+.

LTC Long OpportunityMarket Context:
LTC is testing the range's low support level, which presents a strong buying opportunity if support holds. A potential bounce from this level could lead to a move toward the next resistance zones.
Trade Details:
Entry Zone: $102.00
Take Profit Targets:
$109.00 - $115.00
$132 - $140
Stop Loss: Just below $98.00
This setup offers a good risk-to-reward ratio, making it an attractive trade for a possible reversal. 🚀

LTCN Litecoin Grayscale Trust Cup & Handle Target $500LTCN has created a giant cup and handle pattern. If this measured move plays out which i believe it will we could a prior all time high at least. This is all dependent on what Litecoin will do obviously and if you read my in depth analysis you see that I believe Litecoin will be worth more than 10k in the coming years.
Grayscale has also filed to convert its Litecoin Grayscale Trust to an ETF, which will almost certainly happen. This is also why the price of LTCN has lost most of its premium and is coming down to its NAV price. LTCN will follow Litecoin to its NAV price from here on out more than likely so dont expect wild swings unless Litecoin makes wild swings.
There is a bearish scenario I must tell you about as well. The chart pattern you see is a cup and handle but also the triangle price action has been in since the pump is a descending triangle. Descending triangles are normally bearish. A break below the support line and a closure below would mean LTCN comes down to probably 3 to 6 dollars. This is highly unlikely unless the entire crypto market tanks and Litecoin comes down to 30 dollars. I dont see that happening but I thought I would point that out. There are instances where the descending triangle is bullish. This is probably one of them, where the price continues to bounce off the lower support line but fails to break through finding support and eventually breaking out of the triangle to the upside. There could be a false breakdown trapping short traders before the move up as well so dont be fooled. BBWP is indicating a sizeable move coming it just doesnt tell us what direction. From my analysis I believe its a 90% chance we break up.
This is not financial advice this is just my opinion. Follow me for more updates. Thank you and good luck my friends.

LTCUSDT on the Edge – Major Breakdown or Fakeout?Yello, Paradisers! Is LTCUSDT on the verge of a major drop? The signs are stacking up, and if you’re not watching closely, you could miss a big move.
💎Right now, LTCUSDT is looking bearish as it forms an M-pattern near the resistance trendline of a descending channel. At the same time, a bearish divergence is confirming the weakness in momentum. On top of that, we’re seeing a triple-three wave pattern playing out, which further increases the probability of a downside move. All these signals combined suggest that sellers are gaining control.
💎If LTCUSDT breaks down and closes candle below the support level, the M-pattern will be validated, opening the door for a significant move lower.
💎However, if the price consolidates around this level without breaking down, the setup loses its strength, and in that case, it’s best to ignore it as a low-probability trade.
💎On the flip side, if LTCUSDT manages to break out and close candle above the resistance zone, the entire bearish outlook would be invalidated. In that scenario, waiting for fresh price action before making any moves would be the smartest approach.
🎖 Discipline and patience separate the pros from the amateurs. Stay sharp, Paradisers—trade only high-probability setups, and you’ll always stay ahead of the game!
MyCryptoParadise
iFeel the success🌴

LTC Litecoin Could Do One More Round Of Bouncing Within WedgeThis is a possible scenario here. This is in line format not candles so wicks could be lower than than this. Lines remove all the wicks and are just on an open and close basis, kind of cleaning up the noise. This is not guaranteed to happen but it is a possible scenario before we break out again around the end of March. I'll post below a candle chart as well so you can see those levels. As long as we stay within this wedge on a closing basis and within the channel on the candle format then we should be fine. If we break down below the wedge or channel and close below it then thats not going to be very good. I don't see this happening thats just worst case scenario.
Follow me for more updates. Not financial advice. Thank you

The key is to rise near 134.91
Hello, traders.
If you "Follow", you can always get new information quickly.
Please also click "Boost".
Have a nice day today.
-------------------------------------
(LTCUSDT 1M chart)
The key is to maintain the price above the M-Signal indicator on the 1M chart and rise above 163.89.
-
(1W chart)
Since the M-Signal on the 1W chart > M-Signal on the 1M chart has changed, if the price maintains above the M-Signal indicator on the 1W chart, it is expected to maintain an upward trend.
Accordingly, the key is whether it can maintain the uptrend by receiving support near 95.73-102.34.
-
(1D chart)
In order to maintain the uptrend, the key is whether it can maintain the price by rising above the Fibonacci ratio point of 0.618 (133.53).
If not,
1st: 113.39-117.30
2nd: 95.73-102.34
We need to look at whether it receives support near the 1st and 2nd points above.
Based on the current price position, I think the start of a full-scale uptrend is likely to begin when it rises above the HA-High indicator point of 163.89 on the 1M chart.
-
Thank you for reading to the end.
I hope you have a successful trade.
--------------------------------------------------
- Big picture
I used TradingView's INDEX chart to check the entire range of BTC.
(BTCUSD 12M chart)
Looking at the big picture, it seems to have been maintaining an upward trend following a pattern since 2015.
In other words, it is a pattern that maintains a 3-year upward trend and faces a 1-year downward trend.
Accordingly, the upward trend is expected to continue until 2025.
-
(LOG chart)
Looking at the LOG chart, you can see that the upward trend is decreasing.
Accordingly, the 46K-48K range is expected to be a very important support and resistance range from a long-term perspective.
Therefore, I expect that we will not see prices below 44K-48K in the future.
-
The Fibonacci ratio on the left is the Fibonacci ratio of the uptrend that started in 2015.
That is, the Fibonacci ratio of the first wave of the uptrend.
The Fibonacci ratio on the right is the Fibonacci ratio of the uptrend that started in 2019.
Therefore, this Fibonacci ratio is expected to be used until 2026.
-
No matter what anyone says, the chart has already been created and is already moving.
It is up to you how to view and respond to it.
Since there is no support or resistance point when the ATH is updated, the Fibonacci ratio can be appropriately utilized.
However, although the Fibonacci ratio is useful for chart analysis, it is ambiguous to use it as a support and resistance role.
The reason is that the user must directly select the important selection points required to create the Fibonacci.
Therefore, it can be useful for chart analysis because it is expressed differently depending on how the user specifies the selection point, but it can be seen as ambiguous for use in trading strategies.
1st: 44234.54
2nd: 61383.23
3rd: 89126.41
101875.70-106275.10 (when overshooting)
4th: 134018.28
151166.97-157451.83 (when overshooting)
5th: 178910.15
-----------------

LTCUSDT LONG 1H (Update/Results)From the main review, in which I indicated personal expectations, new market variables arrived both in terms of goals and entry.
On the 1D chart, the price interacted with the key area of interest (poi), removed the liq of the nearest min. and hit the order block 15m TF
New goal on CHoCH target, has been achieved.
stop moved to profit!

UniversOfSignals | LTCUSDT Let's go for spot buying?👋 Welcome to UniversOfSignals Channel!
Let's go together to analyze and review Litecoin analysis, one of the oldest coins in the market, and let's go to update the triggers of the previous analysis!
🌐 Overview Bitcoin
Before starting today's altcoin analysis, let's look at Bitcoin on the 1-hour timeframe. Since yesterday, Bitcoin experienced a correction, which was necessary for the market, and it pulled back to the 102135 range. The next trigger for a long position will be a breakout above 104714.
Yesterday's correction, coupled with an increase in Bitcoin dominance, caused noticeable declines in some altcoins. This highlights the importance of monitoring BTC pairs in your checklist these days.
📊 Weekly Timeframe
On the weekly time frame, it is one of the coins that is in a good position compared to the coins and has had the least correction in recent declines and is in this position due to the possibility of ETF approval
There is no need to complicate things in this time frame and after the break of 136.45, we will buy and be above 98.44. This trigger is valid and we do not have much of an exit trigger for the conditions of these days on this chart and for now it is better to continue holding
📈 Daily Timeframe
On the daily time frame, we are also in a good position and we had a good return after the recent market decline due to the Bybit hack and Trump's tariffs and this is a good thing!
After breaking the 75.01 level and exiting the daily box and breaking its ceiling, we moved up to the resistance of 136.45 and are now fluctuating between the 98.44 to 136.45 boxes.
We also had a curve line in this time frame that was a good support for this event and every time we hit it, we made a good move upwards, but after its failure, it can be said that the upward trend moved into the range and went to form a new structure.
To buy spot after the 136.45 trigger is broken, we can buy for spot with a stop loss of 98.44 and as long as we are above 114.38, the 136.45 trigger is very important for us and it shows us more the strength of buyers and in case of a 98.44 break, we will go for 89 and 80 and we will have a price correction.
📝 Final Thoughts
Stay calm, trade wisely, and let's capture the market's best opportunities!
This analysis reflects our opinions and is not financial advice.
Share your thoughts in the comments, and don’t forget to share this analysis with your friends!
