LTC/USD Secondary trend (part). 09 12 2023Logarithm. Time frame 1 day. Part of the secondary trend. Channel to work, price consolidation in its lower part. A high probability of an upward exit from it. Key levels are shown by arrows. Percentages for clarity and target orientation similarly.
This is how it looks like on a line chart without "market noise". .
Double bottom with a flat top in an accumulation channel. Post-halving time.
A local uptrending channel that has a double bottom with a flat top. This is a strong bullish pattern that says price is (this accumulation zone) at the lows of the trend initiation. The last cycle after the capitulation (end of the participation phase) of all liquid instruments (this is important) began with this structure, which is a display of the actions, first of all, of large market participants that have an impact on pricing (holding). For example, look at the bitcoin 2020 chart and this structure. Similar to what happened on LTC a few months after the halving.
Major trend. Cycles. Super profits.
LTC is a cryptocurrency that has survived many cycles and has not depreciated completely, although it can be seen that the capitalization and leadership positions are not able to compete with the new 2 cycle HYIP giants.
From the position of the cycle before last (distributions, i.e. highs) 2017, this cryptocurrency is on a big super profit. There are very few cryptocurrencies in the crypto market that are in their main trend in an uptrend and are on super profits relative to previous cycles. LTC is one of them. As a rule, the opposite is true. It is clear that the main major holders in most cases for such a long period of existence in the crypto market, LTC has already been repeatedly changed. But with this logic of the price chart, which is displayed on a long history and on a large time frame, should be considered and taken into account in its risk management.
Major trend. Time frame 1 month.
LTC

LTC/USD Main trend. Halving. Cycles The psychology of repetitionMain trend. The graph is logarithmic. The timeframe is 1 month. This idea is relevant both for understanding the secondary trend work and as a training in simple cyclic, logical manipulation processes. Note also the halving of the LTC and the designated time zones between cycles.
The primary trend is an uptrend in which a huge butterfly is forming (forming part 2)
Secondary trend is a downward channel.
Local trend in the secondary trend is a wedge.
Coin in the coin market : Litecoin
The chart is taken from the Bitfiniex exchange, I used it because of the long price history (the coin has been traded on this exchange for a long time). Of course, the chart is relevant for all exchanges with liquidity. The coin and the pair are liquid, it is acceptable to set large positions. The price behavior is predictable. Ups/Downs are similar. Let's consider them below.
Everything is unpredictable only for absolutely predictable people, it always was, is and will be.
Same time frame on a line chart (no market noise, pure trend direction)
A close-up of this area on the line chart.
And this area on the candlestick chart.
What matters is the average buy/sell. Approach the market regardless of the size of your deposit as a major market participant. Stop thinking like a "hamster". You don't need to guess, you need to know and be prepared for any outcome, even unlikely scenarios.
Psychology of behavior in the market.
Expectation. Reality. "Stop-loss resets. Cyclicality of predictable behavior. .
Predictable price behavior. "Knockouts" of obedient (acting by the rules) and naughty (acting on emotion) fools are as logical and predictable as anything else everywhere else. Increase your knowledge and experience, and it won't affect you.
Remember, theory without practice is nothing. Real trading is very different from theory, you should understand that. That's why all "programmed traders" lose money or their earnings are quite modest.
You should not ask anyone where to buy/sell this or that crypto-asset. You should initially know yourself under what conditions you will buy and under what conditions you will sell.
Past "stop-losses" before secondary trend reversals .
Secondary trend reversal zones and "takeout" before pullbacks in 2019 (+450 average) and 2021 (+900% average).
Candlestick chart. 3-day timeframe. Fear peak zones.
Line chart. Three-day timeframe. Fear peak zones. (without market noise).
As we can see, this "fear peak" on the line chart evaporates, all these local "super resets" have no effect on the trend. It's just the "death of hamsters." The capitulation of human stupidity and greed. You can add predictability and submissiveness to this. The train always leaves without such marketable characters.
Such always sell (fear) at the lowest prices, shortly before the trend reverses. It is worth adding that they buy at the highest prices "at the behest" of the pump to get fabulously "rich. This makes the cryptocurrency market super profitable. Such fuel is the basis of profit. "Market fuel flows" lend themselves to cycles.
Price management is the psychology and manipulation of people's minds through basic instincts through price values. All of this is real and as old as the world. A foolish person keeps stepping on the same rake, each time telling himself that this is the last time, or this is a special case.
This "last case" must be repeated systematically, but in different conditions that you create. Your effectiveness depends on how masterful you are at forming such obsessive thoughts in the mind of such market characters.
Fundamentals of Trading. Trading strategy. Capital management. Price forecasting.
It is your trading strategy and money management, based on your experience, that is the basis of trading, not guessing the price. But guessing is what most people want. Such people should have no money. As a rule, such people in real life are very poor, do not have their own business, go "to work" (do not want to take responsibility).
They think real life doesn't give them many resources, but market speculation will quickly make them fabulously rich. Rather the opposite is true. Total impoverishment regardless of the direction of the trend due to the reinforcement of destructive qualities of a person with financial instruments. The behavior of such people in the market is a projection of what they are like in real life.
The behavior of people in financial markets is a projection of what they are in real life. That is, their positive and negative psychological qualities. You can't run away from yourself. A stupid person will be overtaken by his own stupidity, a greedy person by greed, an intolerant person by intolerance, an indecisive person by indecision, an irresponsible person by irresponsibility.
Such will be punished by their own destructive qualities. The main thing is that the victim draws conclusions from this and it is an incentive to correct the root cause and basis of the failures, rather than looking for the culprit of his own stupidity in "random events" and other people.
You guessed once, second time, third time zeroed in and hit your own self-confidence with your own stupidity and predictability. Consequently, all your previous guesses at the distance equals zero.
Trading is a probability game. It is impossible to guess everything because of the many components of pricing. It is possible not to guess, but to know the more and less potentially realizable probabilities because of certain market conditions.
No one knows the exact future, there is only an assumed more likely future and the work that leads to it.
The basis of profit/loss is what you are in the here and now. Your knowledge and experience are projected onto the chart. The symbiosis of these two parameters makes or loses money in practice.
Read these 6 points carefully:
1) The first problem most marketers have is that everyone wants to get a lot of money in the moment and, most importantly, without effort. That's what most people want, so it's not rational or dangerous to satisfy their desires.
2) The second problem is that they can't be "out of the market" until they find a good entry point. "Fear of missing out" does its destructive work.
3) The third problem is, of course, the disease from "childhood," which manifests itself in adulthood. People begin to collect various crypto coins, endowing them with different values according to their beliefs and, above all, their desires.
4) The fourth problem is greed, insatiability combined with inexperience. People don't want to protect their profits, they want more and more and more and more and more, eventually from greed and inexperience they completely (more greedy) or partially (less greedy) nullify themselves.
5) Lack of knowledge and experience. Lack of desire to develop and learn. The less experienced a market participant is, the more confident he is in his competence and "screams text".
6) The sixth most serious problem - laziness. It manifests itself in the fact that few people want to work, everyone wants to have.
Under ideas are captured my trading ideas for this trading pair over the past 3 years. Most of them are previously closed trade ideas. There are 3 learning ideas that I have shown on this trading pair (based on publicly published simple trading ideas) .

LTC REJECTED Analysis 🚨
CRYPTOCAP:LTC is getting rejected from the resistance zone and is likely to pull back to the blue zone 🔵.
🎯 Next Target: Blue zone (support level)

DOGE The Next To Die In This Flush Of Crap Down The ToiletDoge had an amazing run, those who made money and got out I applaud you. Those still holding these bags of coal are about to get wrecked. Memes are dying, no one cares about them anymore. People are beginning to realize that these things have ZERO utility and no future. No ETF will ever get approved, its too inflationary. Take a look at the Grayscale trust thats a great insight to how many institutional investors want this thing. Its Total assets under management are less than $2 million dollars. Thats laughable compared to their other holdings. So even in the slim chance this turd gets an ETF it'll be an epic failure.
Your messiah Elon has abandoned this thing, the onyl real hope you all had for real world utility. Litecoin miners are dumping this as soon as they get it. The meme coin frenzy has died down. In January alone this year there were 600,000 meme coins created thats an all time record for a single month. That meme bubble is about to collapse as people move toward more utility driven cryptos and this space gets wrangled in a bit. Many people including myself have made a bunch of money playing in the meme coin casino, it was fun when it first started. 100x's everywhere. Now its pretty much over. The future for Doge is a slow and steady decline back to NAV under a penny. It was a great pump and dump. Dont marry your investments especially ones that are just memes with no utility they are made to get in and out, make money and rotate into something of value to preserve your wealth.
None of this is financial advice, just my opinion.

The fate of Litecoinhello friends
Here we have two scenarios:
1_ Channel failure and reaching specified goals.
2_ Falling from the roof of the channel and buying in steps.
Considering the high probability of approval of Litecoin ETF, the first scenario is more tolerant.
*Trade safely with us*

LTC - Short play I have entered short on LTC as it is now overbought, while in a major downtrend and has reached an hourly resistance.

LTCUSDT 1H LONGOn higher timeframes, the asset forms many liquidity pools and has aggressive market purchases, thereby protecting the break levels of the structure!
Previously, the asset went under the POI range , but returned on good volume with full-bodied candles.
I am considering a long position at the specified price on a trading chart with targets:
$123.69
$131.20
$141.22
Risk management - 1% on stop order

LTC sideways consolidation continuesThe LTCUSD price action sentiment appears neutral, supported by the longer-term sideways trading range.
The key trading level is at 1,286. An oversold rally from the current levels and a bearish rejection from the 1,286 level could target the downside support at 1,174 followed by the 1,086 and 973.6 levels over the longer timeframe.
Alternatively, a confirmed breakout above 1,375 resistance and a daily close above that level would negate the bearish outlook, opening the way for further rallies higher and a retest of 1,488 resistance followed by 1,576 levels.
This communication is for informational purposes only and should not be viewed as any form of recommendation as to a particular course of action or as investment advice. It is not intended as an offer or solicitation for the purchase or sale of any financial instrument or as an official confirmation of any transaction. Opinions, estimates and assumptions expressed herein are made as of the date of this communication and are subject to change without notice. This communication has been prepared based upon information, including market prices, data and other information, believed to be reliable; however, Trade Nation does not warrant its completeness or accuracy. All market prices and market data contained in or attached to this communication are indicative and subject to change without notice.

LTC analysis (12H)From the point where we placed the red arrow on the chart, it seems that LTC's correction has begun. Due to ETFs, there is a lot of FOMO around this asset, but it's better to analyze it technically.
It appears that LTC is in an ABC correction or a more complex pattern. Currently, it is in wave B, which is forming as a diametric. We can look for buy/long positions in the green zone.
A daily candle closing below the invalidation level will invalidate this analysis.
For risk management, please don't forget stop loss and capital management
Comment if you have any questions
Thank You

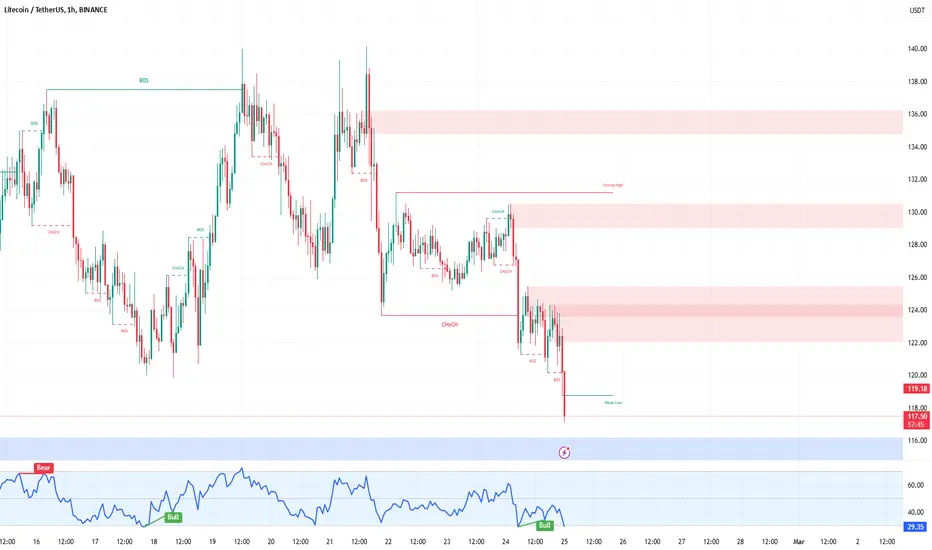
LTC/USDT 1H: Bearish Breakdown – Short Setup Targeting $115.50?LTC/USDT 1H: Bearish Breakdown – Short Setup Targeting $115.50?
🚀 Follow me on TradingView if you respect our charts! 📈 Daily updates!
Current Market Analysis:
Price at $119.85 showing strong bearish momentum.
Market makers appear to be in a distribution phase with clear lower highs.
Hidden bearish divergence on RSI confirms the downtrend.
Risk Score: 8/10 – High risk environment.
Market Maker Activity:
Distribution pattern is evident with lower highs.
Declining volume on bounces suggests persistent selling pressure.
Expect continued downside until testing support around $115.50.
Trade Setup (Confidence 8/10):
Recommendation: Short position with high confidence.
Entry: At current price ($119.85).
Targets:
T1: $118.00
T2: $115.50
Stop Loss: Set at $122.40 (above recent swing high).
Key Resistance Zones: $124.00, $128.50, $136.00
Recommendation:
Wait for confirmation of entry with a rejection around $122. This setup aligns perfectly with SMC principles, indicating strong institutional selling pressure.
🚀 Follow me on TradingView if you respect our charts! 📈 Daily updates!
Litecoin likely heading to $260.. Its one of the few cryptos with a monthly cross happening.. It is because this is one of the original 3 cryptos and it takes this long for some to have a monthly cross which is the most powerful cross possible next to a weekly or daily. So it should be extremely bullish if it breaks out.

Litecoin LTC Still Out Of Wedge Potential Drop Still In The CardAs you can see Litecoin is still out of the wedge. It looks like also on the BBWP a large move is coming. It doesn't tell us which way. You can see the two potential scenarios. The blue line shows that Litecoin could make a move back up to the trend line it may get rejected there but it also may break into the the wedge and then break down in a fake out. The other scenario would be it breaks into the wedge then breaks above that white trend line and stays above that, which would indicate to me that a downside break probably wouldn't happen. Just keep an on those levels. I would think this move happens tomorrow and Tuesday. I have buy orders down around 101-104. I also have a few down at 95-101 in case of a stray wick. In my opinion its a good opportunity to stack more. None of this is financial advice just my opinion.
Follow me for more continued updates and charts of your favorite coins. If you have any requests let me know and Ill try and do a chart and analysis for you. Thank you and have a wonderful day.

LTC/USDTHello everyone, let's look at the 4H LTC chart to USDT, in this situation we can see how the price moves in the local high -ranking channel in which we quickly saw the return to the lower border of the channel. However, let's start by defining goals for the near future the price must face:
T1 = $ 129
T2 = $ 132
Т3 = $ 138
Let's go to Stop-Loss now in case of further declines on the market:
SL1 = $ 125
SL2 = $ 121
SL3 = $ 118
SL4 = $ 114
Looking at the RSI indicator, we see
As we entered the lower part of the range again, which may indicate a new growth movement, but here you can see the city so that any correction deepens.

Litecoin LTC Will Repeat The Same Pattern?Hello, Skyrexians!
Today it's time to update our BINANCE:LTCUSDT idea. It has formed the same pattern like we have seen before 2021 altseason. We know that patterns usually play out in the opposite direction than we saw in the past because of the trader's expectations, but this time we have some proofs that this pattern can play out the same.
Let's take a look at the weekly time frame. First of all we wanna you to notice the green dot on Bullish/Bearish Reversal Bar Indicator at the very bottom. This signal increases probability of a strong bull run until the red dot flashes. We also can count the Elliott waves. Wave 1 was in 2022-2023, and after that wave 2 was tricky flat correction and now price is in wave 3. Wave 3 has the target between 1.61 and 2.61 Fibonacci extension levels. The conservative target is $174, the optimistic is almost $250.
Best regards,
Skyrexio Team
___________________________________________________________
Please, boost this article and subscribe our page if you like analysis!

DOGE RALLY IS OVER Multi Year Correction/Consolidation ComingDOGE was fun if you knew how to trade it. The run and hype is over. The retail FOMO investors that completed wave 5 blow off top are the only ones holding the bags now. Indicators are showing real weakness and heavy selling pressure. The symmetrical triangle in a downtrend means continuation to the downside. Not financial advice. Have fun and don't lose your shirt.

BCHG Looks Good For A Run To $50 At LeastBCHG has broken through all the resistance levels. Next one is around $24.50 and if it can get through that then I see a straight shot to $43 and then $55. At those levels I would expect a decent pullback perhaps up to 50% before its attempt to break the high. BCHG is much further along than LTCN in its run. LTCN still has a long ways to go to reach the level that BCHG is at. So upside on BCHG is limited in the short term perhaps another 100% vs LTCN could do a 1000% move to reach the same level as BCHG as far as nav value to price. Keep an eye on news and developements surrounding the space and specifically securities and SEC stuff. The Proof Of Work coins are about to make a comeback. I think Litecoin will far outperform Bitcoin Cash but Bitcoin Cash will have a decent run as well. Good luck out there my friends. Ill update this chart throughout the cycle. Please like and follow me and this idea so you can be notified when i update it. Thank you and please know that none of this is financial advice its just my opinion and observations. Good luck my friends.

LTC BUYhello guys
Considering the good growth of the price and after its correction, now is a good opportunity to enter into a transaction with capital management.
We have specified a target for you.
*Trade safely with us*

LTC BUYhello friends
According to the good trend we have, now we can buy in steps with risk and capital management in the price correction in the lower time frame.
*Trade safely with us*

LTC has completed the accumulation phase! LTC completes its accumulation phase of more than 896 days and is preparing for a breakout! I would expect a hike to the 0.786 Fibonacci level, as this is a project with huge capitalization, but with poor usability. With spillovers from Bitcoin, Ethereum and Solana it could show huge growth!
Horban Brothers.

LTCUSD - First Target This first target has been the peak several times for bulls before during bull markets and I think price will hit some resistance here
If I am correct and the alt bullrun ensues then LTC will target this area first
Price is currently within a bullflag type structure, looking to breakout.
4Hr chart

BTC > ETH > LTC 2021 Cycle Price ActionHere is an idea with the price action of BTC > ETH > LTC during the last cycle as it relates to out recent cases on BTC.

LITECOIN 4H (LTC)Litecoin is one of the best performing majors in recent weeks and finds itself around the mini range highs in an area of key resistance. The way I'm looking at this chart is in two separate sections of the same mini range, a lower range and upper range with an area of indecision between that separates the two.
Despite how choppy the market has been price can be clearly analyzed in this format:
Lower range - Clear level of support where buyers are stepping into the market aggressively to rebound any sell off and pushing price up further towards the 1D 200 EMA. There is one instance of price sweeping below range low and quickly reclaiming back above, that move has been a catalyst for bullish PA ever since with a strong bullish structure.
Upper range - The top of the upper range has yet to be retested as there is major resistance area position just before it, this bearish orderblock has rejected 4 times and is now being tested for a 5th at time of writing. It is important to note that the 1D 200 EMA is currently at its highest point during this rangebound environment, coupled with higher highs and higher lows on the low time frames, Litecoin is looking good currently.
However, bitcoin is still very much the dominant force in the market, and without bitcoin paving the way I can't see LTC making a breakout move just yet. In order for Litecoin to make a run for the highs I would like to see BTC @ $98,000 with a full reclaim of the weekly midpoint (See weekly outlook).
To conclude, Litcoin is in better shape than most other coins but this rangebound environment should be treated as such until proven otherwise, no action needs to be taken in the main bulk of either the upper or lower range, just the tops and bottoms are worth acting on IMO.

LONG(ER)TERM HOLD LITECOIN IDEALitecoin 2 week chart, so this will take time to play out--
Sitting nicely ontop of a 3 year base!
I've personally been holding LTC since $60 (Spot) Going to add to my spot bag here.
**Accumulate in this range ($135-$100) and SELL ($220 - $300 - $400^^^)
***Theoretically, cut the trade if price falls below 1week or 2week 100 MA
***Depending on your risk tolerance.
