LTCBTC


Litecoin about to go- Higher highs & higher lows
- Double retest of previous S/R flip
- 50 EMA crossed with 200 EMA
- MACD leading line curling up
TP: $185 = 4H resistance

$LTC - to grow faster than its big brother soon?Here, similar to the ETH chart but a bit, we are in the bottom range, and very bottom of that range
If we start reclaiming these range line/SR's we should be able to push on in the higher range, and the weekly chart setup I posted a month ago or so might finally play out.
$LTC is essentially a better version of $BTC in terms of transaction speed, fees etc. but not the face of crypto and so not been as good a return for investments
I think its time will come though, and soon. Lets see...

LTC Is About st Start the Value CycleHEY GANG,
It's been a while! Back again to talk about a very significant Litecoin development. As we know from history, LTC tends to go on cyclical runs where it's value against BTC soars. On this LTC/BTC chart, we can clearly see that the cycle is about to start yet again.
We have already had confirmation of the cycle starting, but now we are looking at what could be the last correction before the LTC value does its moon thing. The stochastic is peaked on both the USD chart and the LTC/BTC chart. My prediction (complete guess) is that the correction will end when the stochastic completes the cycle and dips down into the oversold zone. HOWEVER, there is a chance that the stochastic will flip and not even dip down into the bottom zone before the pump happens.
For now, we don't have any significant volume. That means the price line is weak. Without the surge of volume, the stochastic should complete the cycle and allow price to dip one last time. I think this is when I will grab my ever so humble bag of Litecoins and ride it through the bull market. Being that I'm not a BTC whale, this is the better investment strategy to catch up on multiplying my piggy bank holdings. I'm still kicking myself for not buying 5 ETH when the price was in the $300 last fall, so this is the only train that has not left the station that I can board for maximum gains.
The On Balance Volume indicator shows steady accumulation going on from the big institutional investors. The OBV is just an approximation, but we DO KNOW that there are 2 or 3 big institutions that are accumulating LTC. So I would say the OBV is fairly reliable, and reflecting what is actually going on as far as buying and holding.
What are YOUR thoughts about the current Litecoin price positioning? How far down do you think it will correct? I'd love to see a price of $130 before liftoff. But I can't be too sure. Also, what are your thoughts on the fall peak price for LTC? My best guess based on past performance would be $1500. That might not be monumental, but the one thing I can hang my hat on is the fact that LTC is a fairly safe investment compared to the more risky alts that are out there.
Post your thoughts and let me, CryptoProCarlton, know what you think is the next move for LTC!
Carlton Flowers
Thee one and only CryptoPro
p.s. This ain't no financial advice. Do your own DD. I'm just tryin' to get the kids some new shoes and get my hustle on

My love and personal plan for LitecoinHey folks, I'm sharing my plan for LTC
First I'll go into why I'm holding for the long term and then I'll
dive into my thoughts of the current markets and my short term set up.
First let me state Litecoin is one of my absolute favorite ALTs.
I've held a position in LTC since the 55$ level. LTC doesn't typically get
the hype/attention (or growth) like BTC or ETH but I believe it still has tremendous potential.
Why? Well gather 'round kids.
It's appealing to the new investor with the all too common "unit bias" issues with BTC.
It has practical uses, speed, support and a generous but limited supply double that of BTC.
While many coins have approached and surpassed their ATH, LTC has not
So new Litecoin investors will be happy to find themselves "in" early.
LTC is 140$ currently and that is still LESS THAN HALF of its ATH from $360 in 2017.
People looking for a little less volatility and a little more sustained growth I think will
find the community and supporters of Litecoin with open arms. And I only hope that LTC
won't come prey to these pump n' dump scams although.. it's a very real probability.
In this case I would stay very vigilant with dynamic stop losses as it goes parabolic.
To be honest If I see an enormous and quick rise in LTC I would likely transfer the position
over to bitcoin as the LTC/BTC market spikes for safe keeping rather than back into USD.
Now will LTC hit $360 this month?!?
Perhaps, but imo it's doubtful. But will it hit it's ATH gradually over this year or the next?!?
Well now we can start taking some small, but meaningful longs as the dips allow.
Slowly, but surely increasing positions and generating money that works for
you rather than explodes and vanishes....
I know DCA isn't the most exciting thing, but it works very well over time.
Now for the short term.
Currently Litecoin is trading at 140$ trying to push out of its weekly channel.
If LTC rejects the 150$ level I expect it to continue to oscillate between the $148-120 parallel channel pictured.
If my time allows I would sell partial positions to try and buy back in at the support. But I do plan on holding 85%
of my coins as day trading these levels could prove profitable however missing the breakout could negate these trades...
The support it holds at the $115-120 area is over a month long and well tested. Dips into these areas push me to
further my long position in small increments. Multiple candles below the $115 mark would to me signify a larger
push down to about a $100 and even less. I do not think this will be the case near or long term however it never
hurts to be prepared. My stop loss hovers near the 100$ mark which would still about double my initial investment.
These are my personal viewpoints and they remain flexible.
I hope you found them just a bit informative.
Cheers & Stay safe friends.
-Bruce

Litecoin #LTC Looking to Make Massive Gains on #Bitcoin and #USDFor the past 3 years every time this Bullish divergence has shown up in the LTC/BTC pair Litecoin makes massive gains against Bitcoin....Can we escape this Wedge like extended bull flag this time? Who knows...but my hunch is we will at least test it and soon....Making my LTC price target roughly $280.

💡LTC: BUY Trade🚀🚀🚀🚀🚀🚀 #ALTSEASON2021After strong accumulation at demand zone finally LTC is showing strong upside move, once ltc breaks from upper trendline, it will give massive breakout and it will easily achieve our targets.
HOLD strong it will take 1-2 months to hit the respective targets

LTC: double bottomit broke out of the double bottom neckline and retested it.
time to go long!
please hit LIKE if you find this useful!

LTC BIG POTENTIAL ACTUALLY AWESOME POTENTIAL! Dont MISS THIS ONEAs you see in chart symetrical triangle here if we are broke the triangle very safe way to open long position
its seriously awesome powerfully coin and awesome formation here dont miss this !

LTCUSDT (LITECOIN) - POSSIBLE PRICE ACTIONS ANALYSIS 🔎
- LTCUSDT is building up in a descending triangle pattern.
- A relatively big move is imminent.
POSSIBLE PRICE ACTIONS
- Uptrend ⬆️: breakout above the descending triangle's inclined resistance.
-Downtrend ⬇️: breakdown below the descending triangle's horizontal support.
TARGETS 🎯
- Uptrend ⬆️: horizontal resistance levels (R1, R2, R3).
- Downtrend ⬇️: fibonacci extension levels.

Litecoin (LTC) This Will Be A Big Chain Reaction Of Bull RunHey friends, hope you are well and welcome to the new update Litecoin.
Support and resistance levels:
After getting rejected by $170 resistance now the price action is breaking down the $140 support. The next support is at $110.
Up-trend line support:
The priceline of LTC has found good up trendline support on the 2-day chart and testing this support at the moment. At the same support level, there are also exponential moving averages 10 and 21 supports.
Down channel:
On the weekly chart, the LTC with BTC pair has formed a down channel and the priceline is at the support of this channel at the moment. There are 25 and 50 simple moving averages resistance levels above the priceline.
Shark Move:
The priceline has completed a Shark move on the weekly chart and entered in the potential reversal zone.
A bullish Butterfly move:
If we zoon out the same weekly time period chart, then the price action has completed another bullish harmonic bullish Butterfly move. The final leg is retraced up to 1.269 Fibonacci level whereas we need a retracement up to 1.27 so there is a difference of 0.001 Fib level. Therefore it is possible that the price line may drop a little down and then start a powerful rally to the upside.
Big BAT move:
On the very long-term 2-month chart the price action has completed a big BAT pattern and entered in potential reversal zone:
Conclusion:
The price action has formed a small shark then a big butterfly and then the biggest BAT harmonic moves. Therefore there can be a big chain reaction started that will lead the price line to set a new high.

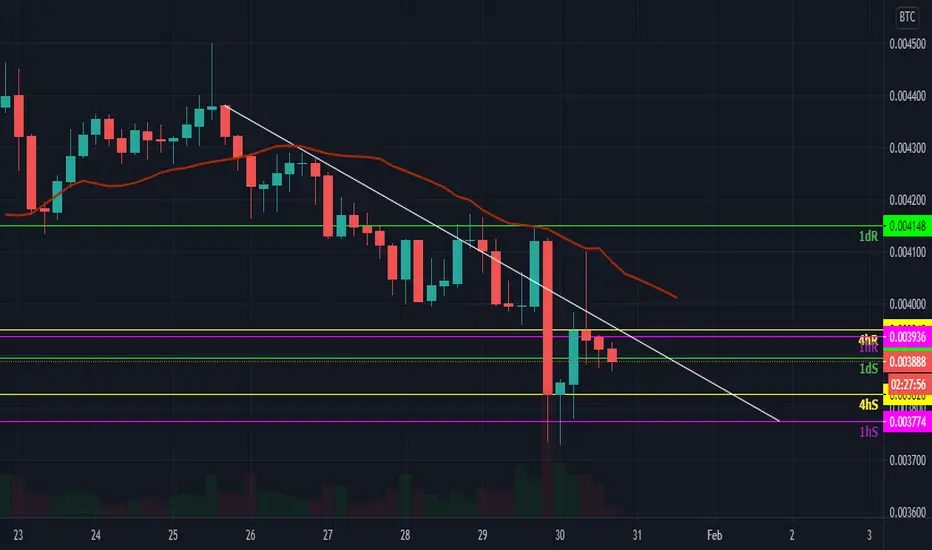
LTC BTC - further downwards movement to support levelsLTC BTC - further downwards movement to support levels
LTC vs USD & BTC 🚀Hello dear friends, just quick update on LTC/USD vs LTC/BTC😊
For me still looks promising
Try to catch the price at the bottom of triangle on the LTC/USD chart and the bottom of falling wedge at LTC/BTC chart by splitting buy orders.
If You don't know how to do that, I leave Edu post here 👇
Looks very simple, but it works for Us😉
If You have any questions, I'm waiting for You in the comments 💋
Stay with me forever💋
Thank you for staying with me🧡
Sincerely Yours Rocket Bomb🚀💣

$LTC Litecoin building bullish momentum ( @LitecoinProject )Hello there ladies and gentlemen, BulloTaurus here with an important update for today.
I have been watching Litecoin for a long time to time a perfect entry with a big % of my portfolio.
At the moment Litecoin is very undervalued project by crypto community but highly appreciated by big companies like Grayscale.
During last 30 days the added more than 111585 LTC in their Investments Holdings that is at a 2238.35% Premium rate right now!
A gigantic triangle is broken and at the moment Litecoin sits at the accumulation zone.
Another reason why i think we might see a bigger explosive movement is MACD .
RSI, EMA and STOCH is also bullish.
Huge gains are possible, just over 300%+
Risk: 3
Reward: 9
Peace.
🍌 Please read the description 1-2 times including the Disclaimer before commenting 🍌
P.S. You're awesome! You can't be successful in all your trades, 30-40% is already higher than average traders you see!


LTCUSDT (LITCOIN) - POSSIBLE PRICE ACTIONS ANALYSIS 🔎
- LTCUSDT is printing a descending triangle pattern.
- Price is testing the descending triangle's inclined resistance.
- We could see a rejection of the inclined resistance or breakout above the inclined resistance.
POSSIBLE PRICE ACTIONS
- Uptrend ⬆️: Breakout above the descending triangle's inclined resistance and the horizontal resistance level (R1).
- Downtrend ⬇️: Breakdown below the horizontal support level (S1).
TARGETS 🎯
- Uptrend ⬆️: Horizontal resistance level (R2).
- Downtrend ⬇️: Descending triangle's horizontal support.

Litecoin to catch-up with Bitcoin's riseLitecoin vs Bitcoin has followed a pitchfork pattern nicely.
Just as Bitcoin Litecoin has not been premined. From day one anyone could download the software from Github, install it and mine Litecoin.
Whereas Ethereum was premined to the tune of 70 mln ETH by Vitalik and his cofounders. The incoming SEC chair Gary Gensler stated repeatedly that Ethereum was premined. If the SEC goes after Ripple for premining XRP they must go after Ethereum as well.
Furthermore CME starts trading ETH futures on Feb 8th 2021. Market makers on CME have built-up their positions on ETH and are ready to sell. Remember what happend when the CME started trading Bitcoin back in Dec 2017 ? Bitcoin crashed.
I expect the SEC to go after Ethereum and if not, Ripple will use this comparison in its defense leaving the SEC no choice. The law must equally apply to all.
Hence I expect people to rotate into legal crypto coins of which Bitcoin and Litecoin are the purest and cleanest.
Also Litecoin has some of the widest community spread and community mining. Is listed on most exchanges worldwide and constantly has a top 5 to top 3 volume & liquidity.
Grayscale just filed to list a few more coins potentially wrapped into a trust. One of the coins was privacy coin Monero. Litecoin has built-in MimbleWimble which can be activated at any time offering optional privacy and fungability which even Bitcoin lacks > Caitling Long who stamped out Wyoming's new crypto laws has recently explained in an interview the importance of fungability to protect from rogue liens.


GrayScale Accumulating LitecoinDear Traders,
In the last 30 days Grayscale has bought a bunch of litecoins.
This information is updated daily and you can be found here: www.bybt.com
If we look at the chart a clear double bottom formation is drawn.
It's time to do something about it.
Entry: @141$
Profit Targets:
TP1: 184$
TP2: 213$
TP3: 234$
TP4: 252$
Stop-Loss
SL: 135$


Don't bet against the chickenThe blue box is where price will head to next, then potentially sooner than expected it will rocket.
LTC is BTC 1 cycle behind 1/4 the price, the UTXO confirms 70% of the circulating supply going back 3 months to over 5 years have been accumulated.
These trendlines will be important, the top ones may not hold any longer after this and the bottom may get moved up.
LTC/BTC has been setting up for quite a while maybe next month or march/april perhaps the longer the ratio coils the higher USD value LTC will become.
Waiting for 8/1 break out for new all time highs, quite literally any month now.
LTC/BTC has a bigger Gann Fan pattern which leads me to believe the LTC/USD breakout will be biblical when the ratio and the USD pairs break the 8/1 Gann Fan
