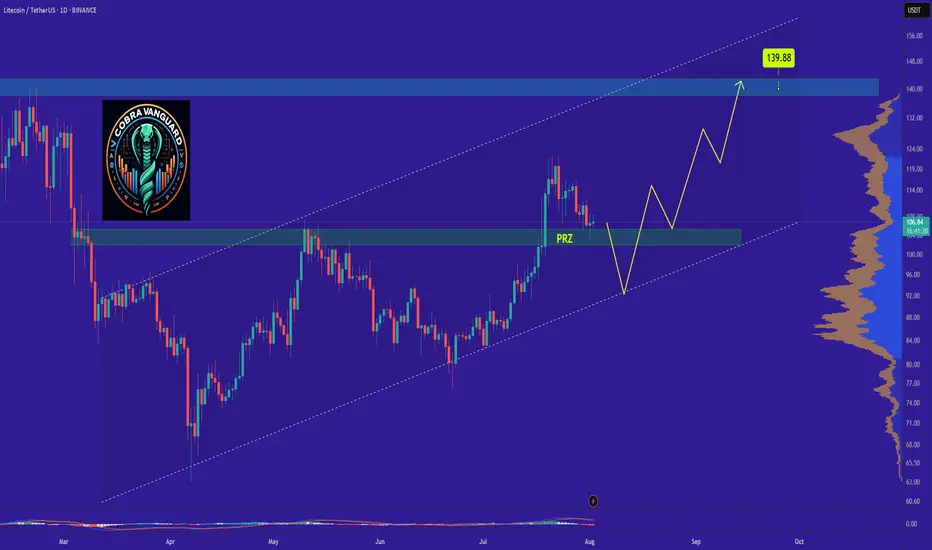
LTCs Situation (Daily) !!!If the price loses the PRZ range, it will drop to the bottom of the channel and then rise to the top of the ascending channel, which will take some time.
Best regards CobraVanguard.💚
LTCUSD
Litecoin H4 | Bullish bounce off 50% Fibonacci supportLTC/USD is falling towards the overlap support and could bounce to the take profit
Buy entry is at 101.85, which is an overlap support that lines up with the 50% Fibonacci retracement.
Stop loss is at 97.43, which is a pullback support that aligns with hte 61.8% Fibonacci retracement.
Take profit is at 110.38, an overlap resistance.
High Risk Investment Warning
Trading Forex/CFDs on margin carries a high level of risk and may not be suitable for all investors. Leverage can work against you.
Stratos Markets Limited (tradu.com ):
CFDs are complex instruments and come with a high risk of losing money rapidly due to leverage. 65% of retail investor accounts lose money when trading CFDs with this provider. You should consider whether you understand how CFDs work and whether you can afford to take the high risk of losing your money.
Stratos Europe Ltd (tradu.com ):
CFDs are complex instruments and come with a high risk of losing money rapidly due to leverage. 66% of retail investor accounts lose money when trading CFDs with this provider. You should consider whether you understand how CFDs work and whether you can afford to take the high risk of losing your money.
Stratos Global LLC (tradu.com ):
Losses can exceed deposits.
Please be advised that the information presented on TradingView is provided to Tradu (‘Company’, ‘we’) by a third-party provider (‘TFA Global Pte Ltd’). Please be reminded that you are solely responsible for the trading decisions on your account. There is a very high degree of risk involved in trading. Any information and/or content is intended entirely for research, educational and informational purposes only and does not constitute investment or consultation advice or investment strategy. The information is not tailored to the investment needs of any specific person and therefore does not involve a consideration of any of the investment objectives, financial situation or needs of any viewer that may receive it. Kindly also note that past performance is not a reliable indicator of future results. Actual results may differ materially from those anticipated in forward-looking or past performance statements. We assume no liability as to the accuracy or completeness of any of the information and/or content provided herein and the Company cannot be held responsible for any omission, mistake nor for any loss or damage including without limitation to any loss of profit which may arise from reliance on any information supplied by TFA Global Pte Ltd.
The speaker(s) is neither an employee, agent nor representative of Tradu and is therefore acting independently. The opinions given are their own, constitute general market commentary, and do not constitute the opinion or advice of Tradu or any form of personal or investment advice. Tradu neither endorses nor guarantees offerings of third-party speakers, nor is Tradu responsible for the content, veracity or opinions of third-party speakers, presenters or participants.

LTCUSD H4 | Bearish reversal off pullback resistanceLitecoin (LTC/USD) is rising towards the sell entry that lines up with the 23.6% Fibonacci retracement and could drop lower.
Sell entry is at 110.45, which is a pullback resistance that aligns with the 23.6% Fibonacci retracement.
Stop loss is at 120.08, which is a swing high resistance.
Take profit is at 102.00, which is an overlap support that aligns with the 50% Fibonacci retracement.
High Risk Investment Warning
Trading Forex/CFDs on margin carries a high level of risk and may not be suitable for all investors. Leverage can work against you.
Stratos Markets Limited (tradu.com ):
CFDs are complex instruments and come with a high risk of losing money rapidly due to leverage. 65% of retail investor accounts lose money when trading CFDs with this provider. You should consider whether you understand how CFDs work and whether you can afford to take the high risk of losing your money.
Stratos Europe Ltd (tradu.com ):
CFDs are complex instruments and come with a high risk of losing money rapidly due to leverage. 66% of retail investor accounts lose money when trading CFDs with this provider. You should consider whether you understand how CFDs work and whether you can afford to take the high risk of losing your money.
Stratos Global LLC (tradu.com ):
Losses can exceed deposits.
Please be advised that the information presented on TradingView is provided to Tradu (‘Company’, ‘we’) by a third-party provider (‘TFA Global Pte Ltd’). Please be reminded that you are solely responsible for the trading decisions on your account. There is a very high degree of risk involved in trading. Any information and/or content is intended entirely for research, educational and informational purposes only and does not constitute investment or consultation advice or investment strategy. The information is not tailored to the investment needs of any specific person and therefore does not involve a consideration of any of the investment objectives, financial situation or needs of any viewer that may receive it. Kindly also note that past performance is not a reliable indicator of future results. Actual results may differ materially from those anticipated in forward-looking or past performance statements. We assume no liability as to the accuracy or completeness of any of the information and/or content provided herein and the Company cannot be held responsible for any omission, mistake nor for any loss or damage including without limitation to any loss of profit which may arise from reliance on any information supplied by TFA Global Pte Ltd.
The speaker(s) is neither an employee, agent nor representative of Tradu and is therefore acting independently. The opinions given are their own, constitute general market commentary, and do not constitute the opinion or advice of Tradu or any form of personal or investment advice. Tradu neither endorses nor guarantees offerings of third-party speakers, nor is Tradu responsible for the content, veracity or opinions of third-party speakers, presenters or participants.

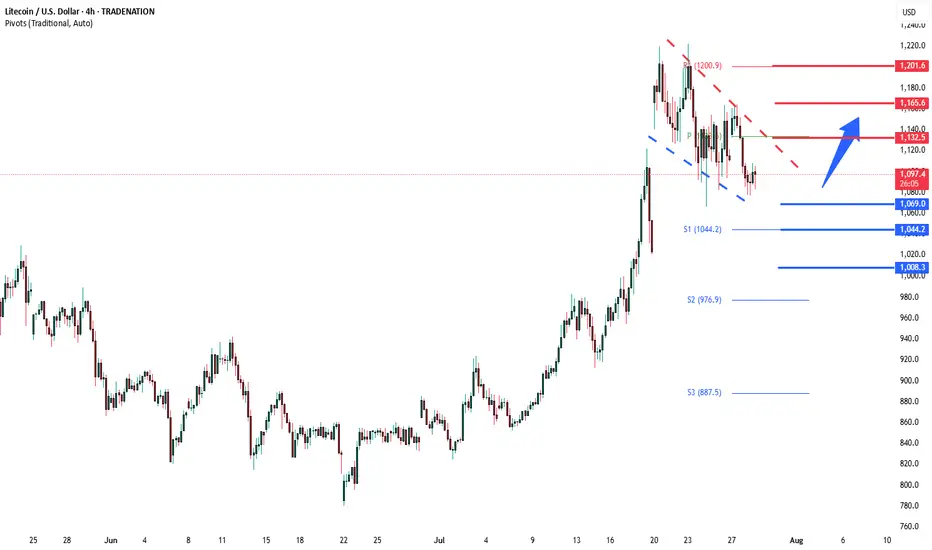
LTCUSD corrective pennant support at 1,070The LTCUSD remains in a bullish trend, with recent price action showing signs of a corrective pullback within the broader uptrend.
Support Zone: 1,070 – a key level from previous consolidation. Price is currently testing or approaching this level.
A bullish rebound from 1,070 would confirm ongoing upside momentum, with potential targets at:
1.132 – initial resistance
1,165 – psychological and structural level
1,200 – extended resistance on the longer-term chart
Bearish Scenario:
A confirmed break and daily close below 1,070 would weaken the bullish outlook and suggest deeper downside risk toward:
1,044 – minor support
1,008 – stronger support and potential demand zone
Outlook:
Bullish bias remains intact while the Gold holds above 1,070. A sustained break below this level could shift momentum to the downside in the short term.
This communication is for informational purposes only and should not be viewed as any form of recommendation as to a particular course of action or as investment advice. It is not intended as an offer or solicitation for the purchase or sale of any financial instrument or as an official confirmation of any transaction. Opinions, estimates and assumptions expressed herein are made as of the date of this communication and are subject to change without notice. This communication has been prepared based upon information, including market prices, data and other information, believed to be reliable; however, Trade Nation does not warrant its completeness or accuracy. All market prices and market data contained in or attached to this communication are indicative and subject to change without notice.
LTC Litecoin USD Textbook Cup & HandleLitecoin should finish its correction over the weekend and as we get into August the momentum will shift back to the upside. This is a washout of over-leveraged positionsbefore the next massive leg up. I still see a correction down to about 100 dollars. Could be a wick lower but not too confident. There is quite a bit of strength in Litecoin, and for good damn reason.
Not financial advice just my opinion. Thank you

Litecoin - Expecting Bullish Continuation In The Short TermH4 - We have a clean bullish trend with the price creating a series of higher highs, higher lows structure.
This strong bullish momentum is followed by a pullback.
No opposite signs.
Until the two Fibonacci support zones hold I expect the price to move higher further.
If you enjoy this idea, don’t forget to LIKE 👍, FOLLOW ✅, SHARE 🙌, and COMMENT ✍! Drop your thoughts and charts below to keep the discussion going. Your support helps keep this content free and reach more people! 🚀
--------------------------------------------------------------------------------------------------------------------

Trading balanceTrading balance The price of the asset has rebounded from the balance zone. With the prospect of growth into the resistance zone.

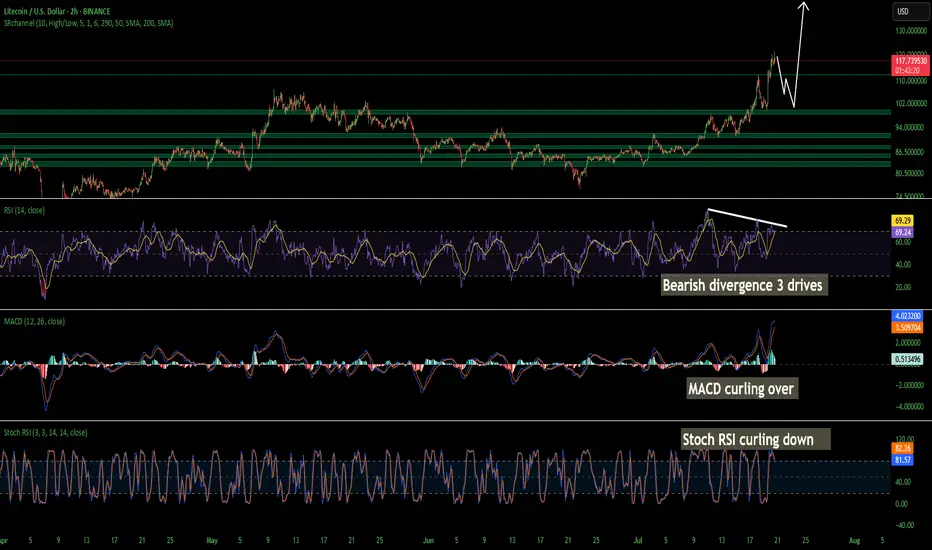
LTC Litecoin Short Term Pull Back Quick and SharpI believe Litecoin Is topping out on the 2 hour. Looks like we may come back down and tap support at around 104 but I wouldn't be surprised a wick hits 100. I have buy orders around 103-106. I am not super confident on a deeper pullback so thats why my buys are there is so i don't miss the dip. Id rather make a little less money than miss a buy in trying to nail the bottom. Litecoin is starting its breakout from a 7 year consolidation and accumulation phase. This should be pretty massive. Litecoin is going to benefit considerably from these new bills that are being signed and many of the favorites in the top 100 will soon disappear!
The time for Litecoin to shine as I have been talking about for years is now. I am almost certain that this is that time. My predictions all still hold if you would like to go read them. I was just off on timing. Timing is the hardest thing to predict especially with how wild this planet has been lately. None of this is financial advice its just my opinion.
LTC (the most dangerous chart in crypto)LTC / USDT
8 years of accumulation in this triangle and price is being squeezed around apex.. What is the result of this long accumulation?
It reminds me of XRP chart before the big breakout in last November
Keep an eye of it…

LITCOIN BUY OR SELL !!!Hello friends🙌
🔊According to the price drop, you can see that the price has been below the specified resistance for a while and when it was able to break the resistance, it shows us the power of the buyers. Now, when we return to the previous resistance, which has now become a support, you can see that the buyers are providing good support and the price is expected to move to the specified targets.
Note that the most important rule in trading is capital and risk management So make sure to follow it.
🔥Follow us for more signals🔥
*Trade safely with us*

Litecoin has maintained it's HVF and can STILL do a 10X...in the coming years.
This is a massive pattern formed over 7 years and I expect over performance of target 3 ultimately.
The day to week price action really does not matter when you have beautiful setups like this.
Keep stacking at these low prices.
@TheCryptoSniper
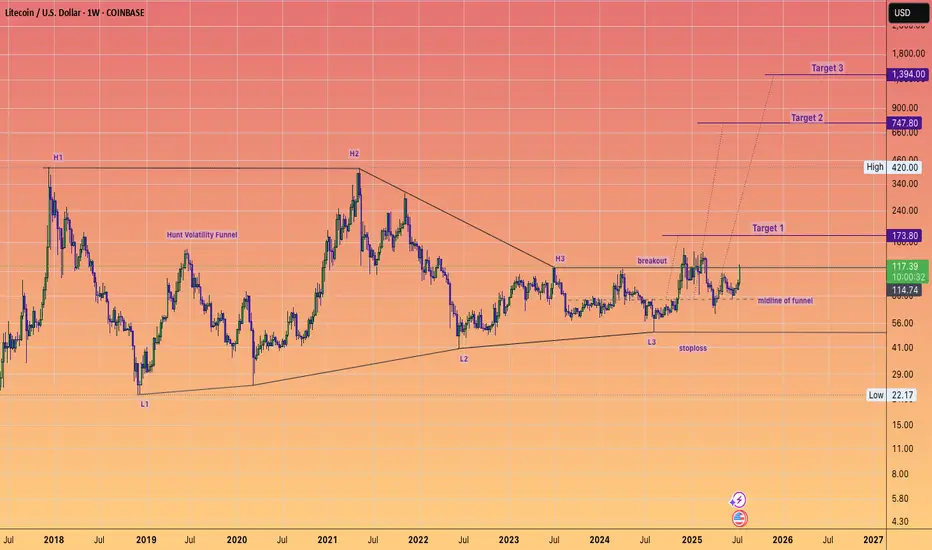
LTC/USD LITECOIN Adam & Eve Pattern On WeeklyThe Adam and Eve pattern is quite effective and usually signals a trend change to bullish. Once this pattern breaks the neckline I think its straight to $200 before any sort of pullback.
Haven't done a chart in a while cause its been the same old stuff, sideways. We are starting to ignite now. Silver is running which means something is breaking in the background financial system. I see the biggest blow off top you've ever seen coming, its the only way out of this, print print print until it doesn't work anymore.
Also I was reading that Bitcoin is removing its cap for spam in each block in October? This could spell disaster for fees and congestion. Litecoin will skyrocket during that time I believe because the fees will be so high it will price out the little guy trying to send a grand or two. I see an influx of people coming to Litecoin. Good luck , none of this is financial advice just my opinion

LTC - Time to buy again! (Update)Finally, this pattern was broken and had a positive impact, leading to significant growth. Now, with a slight price correction, higher price levels can be reached.
PREVIOUS ANALYSIS
Best regards CobraVanguard.💚

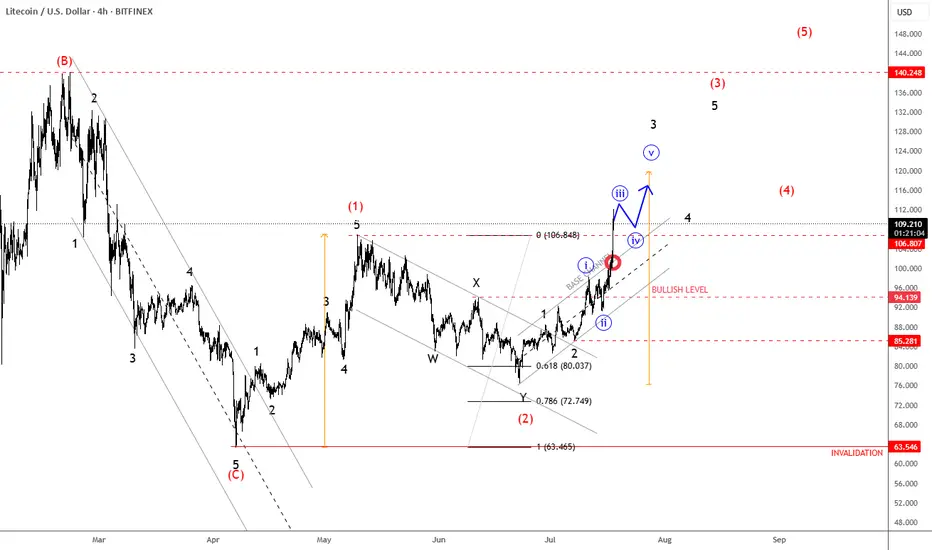
Litecoin Continues Its Bullish Cycle As ExpectedLitecoin Continues Its Bullish Cycle As Expected, which can send the price even higher from technical point of view and by Elliott wave theory.
We talked about Litecoin back on May 30, when we spotted a bullish setup formation with waves (1) and (2) that can extend the rally within wave (3) of a five-wave bullish impulse.
As you can see today on July 18, Litecoin with ticker LTCUSD is now breaking strongly back above May highs after we noticed a complex W-X-Y correction in wave (2). Now that ALTcoin dominance is stepping strongly in, we may easily see more gains within a projected five-wave bullish cycle during the ALTseason, just be aware of short-term pullbacks.
LITCOIN : So what is an ETF ?Hello friends
Be careful with the recent fluctuations of this coin because the movements of this coin have become unpredictable and we suggest that if you want to buy, buy in the specified support areas and in steps, of course with capital and risk management...
We have also specified targets for you.
*Trade safely with us*

Is This the Perfect Moment to Rob the LTC/USD Vault?🏴☠️ LTC/USD Heist Mode: The Moving Average Break-In Plan 💰📈
🌟Hi! Hola! Ola! Bonjour! Hallo! Marhaba!🌟
Calling all Market Bandits, Crypto Hustlers & Chart Raiders! 🤑💰🚀
🚨Mission Briefing
We’re eyeing a bullish breakout hit job on the LTC/USD chart — all based on the elite 🔥Thief Trading Style🔥 with a touch of candle science, moving average vault-cracking, and some solid day/swing setups. This ain’t your grandma’s trade plan — this is high-level lootin’ with precision.
🕵️♂️ 🎯 ENTRY PLAN — Unlock the Vault at $86.00
Wait for the MA breakout + candle close above that sneaky Moving Average line.
➡️ Execute Buy Stop orders above MA
➡️ OR place Buy Limit during a pullback to swing low/high zones in 15m–30m timeframe.
📌 Pro tip: Set an alert – catch the breakout live, don’t chase it later.
🛑 STOP LOSS — Your Getaway Route
Place your Thief SL near the recent swing low (82.00 using 3H chart).
🎤“If you’re entering like a pro, stop loss goes where it should – not where fear lives. But hey, it's your ride or die. Choose wisely.” 🔥
💡Adjust SL based on lot size, risk %, & how deep your robbery goes.
🏴☠️ TARGET ZONE — Exit the Scene at $92.00
Get your bags packed, profits stacked, and be ready to escape before the market catches on.
💸 Grab the loot and bounce before the reversal gangs arrive!
📈 Why the Heist?
The LTC/USD crypto market is showing bullish momentum, backed by key analysis angles:
🔍 Fundamentals
📊 COT Report
💥 On-Chain Metrics
🧠 Sentimental Heat
🌍 Intermarket Structure
👉 Check your intel. React. Don’t sleep. 🔗🔗
⚠️ News Alert & Risk Tip
🗞️ Stay clear of trades during volatile news releases
🔐 Use trailing stops to lock in gains
🚫 Protect your positions – don't let profits slip through cracks.
📌Disclaimer:
This ain’t financial advice — it’s just a shared plan for market raiders. Trade at your own risk, and don’t forget to bring your own map. Market shifts faster than a getaway car — so adapt & react smartly. 🧠💡
💖 BOOST the Plan 💥
Hit that Boost Button if you're vibin’ with the robbery crew. It powers up the strategy and supports the movement. Together, we trade to take — The Thief Trading Way. 💸💪🎉
🚀 Catch you on the next breakout. Stay sneaky, stay sharp. 🐱👤🤑

When YouTubers Say 'No'… We Say 'LTC Go!'I’m not here to drop some fancy technical analysis today.
I’m here to tell you… this might just be it.
A big, popular YouTube channel just announced they’re not too bullish on Litecoin this cycle.
And guess what? That might actually be our ultimate buy signal.
The chart’s looking bullish now — the trap has been set, and left behind us. 😎
They FUD, We Flood (Our Bags)
Why Litecoin? Beyond its unshakable fundamentals, if you genuinely understand and believe in crypto and digital freedom, Litecoin is the purest expression of that vision
That's it, that's the idea" - Good night !

LTC starting wave 3This wave will bring us to the break out level, charts looking fantastic and overall bullish. Btc.d still didn't start to melt and the LTC pair is looking to recover the 0,001 and higher for the run. The LTC run from 4 to 420 lasted around 9 months ,the runs from 40 to 420 lasted around 6 months, if me start running now we have get 6 months till the bull ends... Lets keep our eyes open.

Altseason, just a thought ! Basically, right now we’re chilling in a major confluence zone — a whole bunch of important levels are stacked right here.
We’ve got:
The 0.78 Fib retracement holding it down
Volume profile support giving us a comfy cushion
That good old accumulation support from 2019–2021 saying “welcome back”
…just to name a few.
IMO, we’re in that sneaky “deviation/manipulation” phase before the real markup begins — a.k.a. altseason is warming up in the locker room.
If we actually hit the bull flag target… well, let’s just say the numbers start looking spicy. But hey, let’s not get ahead of ourselves — things can (and probably will) move faster than you think.
Alright, that’s the vibe. Let’s see how it plays out. Good night! 😴🚀

Trading balanceTrading balance The price of the asset has rebounded from the balance zone. With the prospect of growth into the resistance zone.

Litecoin:Is the main climb coming?hello friends👋
As you can see, the price, after falling in the support area specified by the buyers, has been supported and returned, forming an upward pattern.
Now we don't enter into a transaction with just one pattern, we also check the entry of buyers and the amount of currency and other factors and draw conclusions.
According to the points we have said, we have identified very important support points for you to buy step by step with capital and risk management and move to the specified goals.
🔥Follow us for more signals 🔥
*Trade with us safely*

LTC, he Hidden Strength Beneath the Retrace Ma dudes, we might just be witnessing something big and beautiful here. 🤌✨
Okay okay, I might sound like a total degen, but hear me out:
✅ Double bottom (check those two green arrows)
✅ Bullish divergence on the RSI
✅ MACD on the monthly just crossed bullish — for the first time ever on this pair!
✅ OBV stayed strong, didn’t collapse even during that nasty monthly retrace
✅ Notice how volume was climbing during the uptrend, but fell off during the retrace? That means the drop lacked real conviction.
We’re also sitting at an ATL (all-time low) — the lowest we've been.
Check out that red arrow pointing at the volume: that's the first sign of a burst. The next bursts? 💥 They should be explosive.
…And that’s just to name a few.
See you somewhere up there 🚀 — once we break through that T1 level, we should start trending higher fast.
That's it, that's the idea" - Good night !

LITECOIN (LTC) - On The Verge Of Exploding - ETF Catalyst?Litecoin: A Decentralized Network with a Differentiated Risk Profile
Litecoin (LTC), launched in 2011 by former Google engineer Charlie Lee, is one of the oldest and most active Layer-1 blockchain networks in the cryptocurrency space. Often referred to as the “digital silver” to Bitcoin’s “digital gold,” Litecoin was designed to offer faster transactions, lower fees, and broader accessibility while maintaining a similar monetary policy and codebase.
This post aims to provide an overview of Litecoin’s technical structure, usage, risk profile, and current developments—without speculative bias—so readers can form their own assessments.
1. Transparent Origins and Founder Dynamics
One key difference between Litecoin and Bitcoin lies in the identity of their respective creators. Bitcoin was developed by Satoshi Nakamoto, a pseudonymous and still-unknown individual or group, who is estimated to hold 750,000 to 1.1 million BTC—a significant portion of the total supply that has never moved. The dormant status of these holdings has occasionally raised concerns about future market impact if they were ever activated.
In contrast, Litecoin was founded by Charlie Lee, a known and public figure who was active in the community before, during, and after the launch. In 2017, Lee announced he had sold or donated nearly all his LTC holdings to avoid any potential conflict of interest. Today, no founder or insider is known to hold a disproportionate share of the Litecoin supply. This level of transparency and decentralization has been interpreted by some as a factor that lowers long-term governance and concentration risk.
2. Structural Simplicity and Leverage Exposure
Another distinction between Litecoin and Bitcoin lies in market structure and exposure to leverage.
Bitcoin is widely used as collateral in crypto lending markets and institutional derivatives, including perpetual futures and structured products. This has introduced significant systemic risk during periods of market stress, as high leverage has historically led to cascading liquidations across centralized and decentralized platforms.
Litecoin, in contrast, has relatively limited exposure to leveraged products and collateralized lending. It is not commonly used as collateral in CeFi or DeFi protocols, and institutional futures markets for LTC are smaller and less active. As a result:
Litecoin is less likely to trigger or be affected by mass liquidations
It has reduced systemic risk due to lower market entanglement
Its price tends to reflect more organic supply/demand dynamics
It is less involved in cross-collateralized or rehypothecated loan systems
This simpler structure may appeal to risk-aware investors looking for cleaner exposure without the reflexivity effects common in heavily leveraged markets.
3. Scarcity and Monetary Policy
Litecoin shares a similar deflationary model with Bitcoin, with a hard cap of 84 million LTC and scheduled halving events every four years. The most recent halving occurred in August 2023, reducing the block reward from 12.5 to 6.25 LTC per block.
With over 75 million LTC already mined, fewer than 9 million remain in future issuance. The protocol’s monetary policy is deterministic and cannot be altered unilaterally, which may appeal to those who prioritize predictable supply and inflation resistance.
While Litecoin’s cap is four times higher than Bitcoin’s, the relative issuance schedule and halving dynamics mirror Bitcoin’s design. Some investors view this as a hedge against fiat currency debasement, although the asset's volatility and adoption context should be taken into account.
4. Network Fundamentals and Real-World Use
Litecoin has maintained near 100% uptime since inception, and its transaction throughput and fee structure are generally favorable compared to many competing networks.
In 2024, Litecoin became the most used crypto for payments via BitPay, surpassing Bitcoin in transaction volume, driven by its fast 2.5-minute block times and low transaction fees. It is supported by major platforms including PayPal, and accepted by thousands of online and retail merchants.
From a security perspective, Litecoin’s hashrate reached all-time highs in 2025, partly due to merge-mining with Dogecoin, which has helped strengthen its proof-of-work infrastructure. Network upgrades like MWEB (MimbleWimble Extension Blocks) have added optional privacy layers to Litecoin’s UTXO model, while Lightning Network integration supports instant payments.
These developments suggest that Litecoin continues to evolve, with emphasis on efficiency, user privacy, and practical usability.
5. Institutional Presence and ETF Outlook
Litecoin has seen modest but growing institutional involvement. Products such as the Grayscale Litecoin Trust (LTCN) have existed for several years, and Coinbase introduced Litecoin futures trading in 2024. Fidelity also offers LTC trading and custody to institutional clients.
More notably, a Spot Litecoin ETF application is currently under review by the U.S. Securities and Exchange Commission (SEC), with analysts from Bloomberg estimating a 95% probability of approval before the end of 2025. If approved, this would make Litecoin one of the first proof-of-work assets outside of Bitcoin to gain direct exposure through a regulated ETF vehicle.
Should that happen, it may increase access, liquidity, and legitimacy among traditional investors. However, as always, regulatory decisions remain uncertain and subject to broader political and market conditions.
6. Technical Structure and Long-Term Price Action
From a macro-technical perspective, Litecoin has historically followed a pattern of higher lows and higher highs across each market cycle. This structure remains intact as of 2025, with a strong support at 81 USD on a 6 months timeframe.
Summary
Litecoin presents a combination of characteristics that differentiate it from other crypto assets, including:
✅ A public, transparent founder and no major insider dominance
✅ Limited exposure to leveraged lending, reducing systemic risk
✅ Deterministic monetary policy with a fixed supply and halving schedule
✅ Real-world usage in payments and retail adoption
✅ Strong network security and development activity
✅ Potential ETF approval that may broaden accessibility
These features do not necessarily imply outperformance, but they form the basis for an asset with a relatively clean structure, historical resilience, and a distinct position in the crypto ecosystem.
🔎 Disclaimer:
The information presented here is for educational and informational purposes only and should not be interpreted as financial advice.
Always conduct your own research, assess your individual risk profile, and make investment decisions based on your own analysis and objectives.
