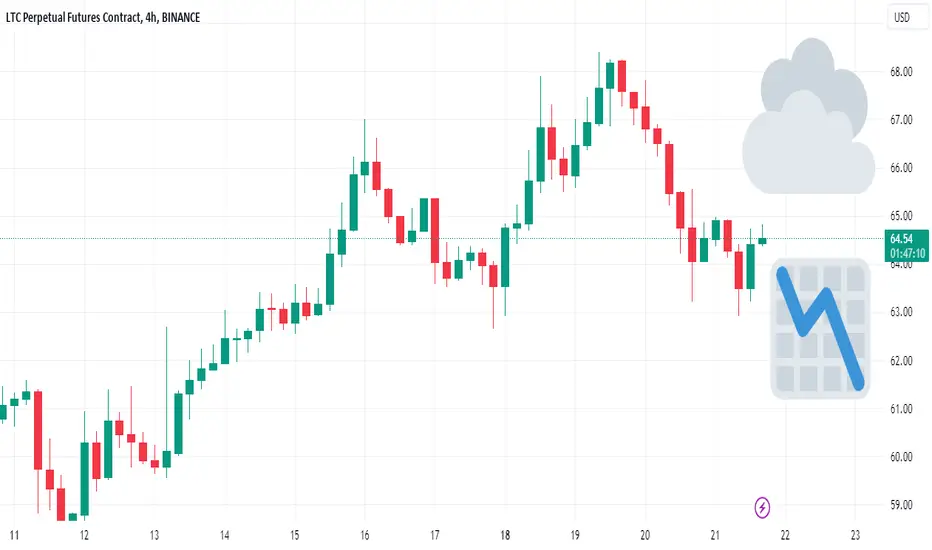
LTCUSD ❕ declineTD Sequential has formed a reversal signal to the downside (4H TF)
Price broke down through 50EMA (1H TF)
RSI is moving in the sellers zone (1H and 30m TFs)
I believe that LTC will continue to decline.
LTCUSD

LTC Under Pressure 📉, 24H & 1-Week Horizons Cloudy ☁️Cloudy ☁️, rainy 🌧️, and even stormy ⛈️ trading conditions lie ahead in the next 24 hours. This translates into a bearish market with downside risk for cryptocurrencies. Particularly Litecoin, Ethereum, Cardano, Uniswap, and Polkadot may come under pressure. Chainlink bucks this negative trend and has upside potential, according to ATTMO.
Over a one-week horizon, the bearish trend will continue to linger over the crypto universe, except for Bitcoin, Polygon, and Chainlink. Slightly bullish sun ☀️ will shine over this trio, indicating a possible upside in their prices.
Follow us for more crypto weather reports!

LTCUSDT at monthly support, likely to bounce soon.The price has been going down since it hit the monthly resistance MR1 a few months back. The price came back to monthly support and bounce from there. Now it is experiencing a pullback from that bounce and the price is currently trading at weekly support WS1 which is also close to monthly support MS1. I think the current setup is offering a good long opportunity on high time frame. The last monthly candle close has been bullish and indicates that the current or next monthly candle is going to be a green one. The price is also at the support level which is providing a good confluence. Some indicators are also indicating the direction for the price to be up side in the coming days. There can be a bit of dip into the MS1 but not necessary. Overall it is looking good for a long on high time frame.

Litecoin on weekly chart💥With the ever-evolving crypto landscape, it's easy to get caught up in the latest trends and tokens, but sometimes the most valuable gems are right in front of us. Litecoin, often referred to as the "silver" to Bitcoin's "gold," is one such cryptocurrency that has been quietly making strides in the digital currency world.
Here are a few reasons why Litecoin might be considered an undervalued asset:
Digital Silver: Litecoin is often referred to as the "silver" to Bitcoin's "gold" in the world of cryptocurrencies. It offers similar benefits but is primarily used for smaller transactions and everyday purchases.
Swift Transactions: Litecoin is known for its fast transaction processing. New blocks are generated approximately every 2.5 minutes, making it ideal for quick and discreet payments.
Strong Security: Litecoin uses the same cryptographic protocol as Bitcoin, ensuring a high level of security and protection.
Experienced Development Team: The Litecoin team consists of experienced developers who actively improve the network and work on new features.
Longevity: Litecoin has been in the market since 2011, and this longevity has added to its stability and trustworthiness.
Global Acceptance: An increasing number of companies and payment systems accept Litecoin, making it more useful for everyday transactions.
Ongoing Development: The crypto community continues to actively develop Litecoin, implementing new technologies and updates to keep it relevant.
Mined: Litecoin can be mined, making it accessible to those who wish to participate in the network and receive coins as a reward.
Useful for International Transactions: Thanks to its speed and low fees, Litecoin is an excellent choice for international transactions and money transfers.
Creative Applications: Litecoin is used for various applications, from digital collectibles to the execution of smart contracts.
As the crypto world evolves, it's essential to keep an eye on assets that may be overlooked. While Litecoin may not always grab headlines, its combination of speed, security, and adoption could make it a hidden gem in the cryptocurrency market.
What are your thoughts on Litecoin? Do you believe it's undervalued, or is there another cryptocurrency you think deserves more attention? Share your insights in the comments below!
Always sincerely with You,
Yours, Kateryna💙💛

LTC - 10/10 23LTC - 10/10/23
**Trade setup:**
LTC is trapped in between this supply and demand zone since the fall from $84, if it is broken there is a FVG to tap into around $72 a break of $72 will turn the trend bullish again!
If this DEMAND zone is broken it will head for the low it created 16th AUG!

LTCUSD Buy/LongLTC/USD futures is currently sitting upon on support.
Support shows its current stability can rise towards $104.68
LTCUSD
BUY/LONG
Entry: $63.63
Stop Loss: $58.84
Targets:
TP 1: $84.63
TP 2: $104.68
SWING TRADE
Risk: 2-5% of Capital

Buying LTC HereTraders,
In addition to breaking out of the triangle, LTC has now formed and broken the neckline of an Inverse Head and Shoulders. The target here takes us straight to the underside of that RED TL (major resistance) and that will be my target.
Entry = 67.67
Target = around 78-80
SL = under 63
R/R = 2.5
Additionally, I have move the stops of ALL my other trades up to capture at least half the profit of each trade. ALL are in the profit now.
Best,
Stew

LTCUSD - Double Bottom LevelLTCUSD will double bottom along this horizontal line
This allows for a bullish reversal
Currently LTCUSD is a bargain, buy up!

LTC halving- Litecoin (LTC) experiences intense volatility prior to its halving event.
- The halving event is expected to reduce the mining reward for LTC from 25 to 12.5 coins.
- Price fluctuations are observed as investors panic sell and others hold on to their positions.
- The trading range remains relatively tight during this period.
- Uncertainty surrounds the impact of the LTC halving, especially when compared to historical Bitcoin halvings.
- The halving event is scheduled to occur at 16:34 UTC today.

Litecoin Elliott wave Daily countLitecoin may turn upside for wave d from a triangle pattern if will keep 65.39 level.
Wave b rejected at 0.854 fib retracement of wave a and now probably will bounce from 0.854 retracement of wave b(71.09)
If will break above 79.77 It will will strengthen our count!
Hit the like button if you like my analysis and follow me for future updates!
Good luck!

Litecoin Short Term Sell IdeaH4 - Bearish trend pattern followed by a double wave correction.
Bearish divergence.
Most recent uptrend line breakout.
Until the strong resistance zone holds I expect short term bearish moves to happen here.

Litecoin (LTC) Technical Analysis: Long Term Target $1000 ?Litecoin (LTC) Technical Analysis: Navigating Short-Term Challenges for Long-Term Gains
Introduction:
Litecoin ( NYSE:LTC ) is currently trading at $65, and it's crucial to dissect its high-timeframe (HTF) chart to understand the potential short-term hurdles and long-term prospects. In this comprehensive technical analysis, we will explore what lies ahead for NYSE:LTC and identify strategic buying opportunities.
Short-Term Outlook:
While the current price of $65 suggests some short-term downside potential, there is a silver lining.
In the HTF chart, a strong support zone is emerging between $25 and $35. This presents an ideal accumulation zone for investors. If the price enters this range, it should not be overlooked as a buying opportunity.
Strategic Accumulation:
Timing the exact market bottom is challenging. Therefore, accumulating NYSE:LTC within this robust support zone offers a strategic advantage. This approach aims to capture potential gains as the cryptocurrency market evolves.
Future Targets:
Looking ahead to the next bull run, Litecoin has promising potential. With its focus on micro payments and a strong team, I anticipate price targets ranging from $500 to $1000 in the next bull market. However, this is a longer-term projection and should be approached with patience.
Critical Price Levels:
Resistance: $117/$376
Support: $50/$36/$25
In Conclusion:
Litecoin ( NYSE:LTC ) faces short-term challenges but holds immense long-term promise. The $25-$35 accumulation zone provides an enticing entry point for investors. While it's impossible to predict the exact market bottom, accumulating at strong support levels can prove rewarding. In the next bull run, NYSE:LTC could potentially reach impressive price targets.
Disclaimer:
This analysis reflects my personal opinion and should not be considered financial advice. Always conduct thorough research and consult with a financial advisor before investing in cryptocurrencies or any other assets.
BITFINEX:LTCUSD #Crypto #Litecoin

LTCUSD ❕ ascending wedgeLitecoin broke down through the 50EMA (1H TF)
The chart has formed long upper shadows (1H TF)
RSI is near neutral values.
Price will continue to decline after exiting the wedge.

Litecoin: Short Signal Active.Litecoin is poised to test the low 60's over the coming week. My trade scanner has called a signal to go short from 64.90 with a stop at 66.25 and take profit at 62.90 approximately. This was shared yesterday around 6:30 PM EDT. These signals are private but I am sharing it here so that as a community we can evaluate the context and observe the outcome.
Having a tool like this makes it a LOT easier to compete in a highly random environment. Since it generates the signals for the same exact reasons every time, it removes a great amount of indecision and confusion on your part. You can focus more on the bigger picture like managing the trade.
So let's evaluate the context, and see if this signal is sensible. By the way, all you need to properly evaluate context are horizontal lines, and the ability to highlight price patterns by drawing squares, etc. If you are consuming charts polluted with colors, oscillators, cartoons, etc., you are being entertained, NOT properly informed. It's like eating pizza with vegetables on it and thinking it's "healthier" for you.
First is the broader trend. Is it bullish or bearish? Based on this chart, going back a number of months, the broader structure is bearish (lower highs, lower lows). As long as this structure stays intact, it is reasonable to expect resistances to hold and support to break.
The scanner signal is clearly in line with the broader trend. An advanced trader can use this fact to justify moving the take profit to an even lower price like 60 or maybe high 50's. Why? A lower low has a greater probability and that translates into greater profit potential.
Second, lets look at levels. Notice the two lower highs in recent weeks (blue arrows). They highlight the 70 whole number resistance area. If the trend is going to stay bearish, price should NOT compromise this resistance. Knowing this should help prevent you from getting long too soon, and from over reacting to any temporary noise (like a quick short squeeze).
One other consideration is inter market relationships: Bitcoin and economic environment. It is not necessary to look this far when it comes to short term momentum trades, but it certainly doesn't hurt. Bitcoin is the leader, not Litecoin. As long as Bitcoin continues to maintain a bearish bias, Litecoin is likely to follow. And on top of that, interest rates are pushing new highs. NOT a favorable sign for speculative assets like Bitcoin and alt coins.
Add all this up and the Litecoin short idea is sensible. This is what bolsters confidence when considering such trades. Being able to focus on these bigger picture elements is where the educational value is, not chartoons.
Some form of automation within your trade effort can change your outcome significantly especially for beginners. Worry less about getting the setup right and focus more on managing the outcome.
Thank you for considering my analysis and perspective. And if you liked this article, please let me know by pressing the boost button!

Opportunity for a swing trade might be arisingAfter a big drop in Litecoin from nearly $115 to less than $58, the opportunity for a swing trade in the opposite direction might be arising. The setup we are watching would involve taking a long position with the breakout above Resistance 1 and tight stop-loss below it. The idea behind this trade would be to ride the price retracement toward the 50-day SMA. The first price target would be at Resistance 2 and the second at Resistance 3.
Technical analysis gauge
Daily time frame = Neutral/Slightly bullish
Weekly time frame = Bearish
*The gauge does not necessarily indicate where the market will head. Instead, it reflects the constellation of RSI, MACD, Stochastic, DM+-, ADX, and moving averages.
Please feel free to express your ideas and thoughts in the comment section.
DISCLAIMER: This analysis is not intended to encourage any buying or selling of any particular securities. Furthermore, it should not be a basis for taking any trade action by an individual investor. Therefore, your own due diligence is highly advised before entering a trade.

long idea on $LTCI expect another dip to local lows, which will serve as a good entry point for a long time. you cannot set a stop above the level of $56 (if the candle is fixed below this price, exit the position)

LTC 24-Hr ☁️ Forecast (Bearish Trend); Reversal In One Week 🌞Bullish sun 🌞 continues to shine over the global crypto market in the next 24 hours, signaling upside potential. Yet, some altcoins, such as Litecoin, Avalanche, and Binance, face cloudier ☁️, slightly bearish trading conditions.
ATTMO signals bullish sun 🌞 for Bitcoin, Litecoin, Cardano, Chainlink, and Uniswap over a one-week horizon. Ether, XRP, and Binance, however, face bearish scattered clouds ☁️ indicating a downward risk. 🚀🔍
Follow us for more crypto weather reports!
For past gloryHello?
Hello traders!
If you "Follow" us, you can always get new information quickly.
Please also click “Boost”.
Have a good day.
-------------------------------------
(LTCUSDT chart)
(1D chart)
While trading futures, there are times when you need to check the big picture movements.
That's when a trade doesn't go well or when a big uptrend is expected.
Looking at the big picture of the LTC chart, we can see that the current HA-High indicator point at 99.58 corresponds to an important turning point.
This roughly means that we need to consider whether we can hold it during the 52% uptrend.
Long-term holding like this is only possible when there is low leverage or a small investment proportion, but in reality, there is little chance of overcoming this upward trend.
If you hold it, it is expected that you will have to overcome two major crises.
1st: 78.47
2nd: 90.43
We need to check whether the price will rise in the 1st and 2nd areas above.
(1h chart)
It touched the HA-Low indicator and rose, and continued its upward trend along with the HA-High indicator.
However, now the HA-Low indicator has been touched again.
Therefore, we can see that we have reached a trend reversal section.
Therefore, the key is whether it can be supported and rise in the 64.06-64.92 range.
If not, there is a high possibility that it will turn into a downward trend.
However, since the 62.35 point is the point where the HA-Low indicator on the 1D chart was formed, there is a high possibility that a rebound will begin around this point, so caution is required when entering a SHORT position.
If the price rises above 64.92 and holds, the target range is around 67.35-67.18.
--------------------------------------------------
- The big picture
The full-fledged upward trend is expected to begin when the price rises above 29K.
This is the section expected to be touched in the next bull market, 81K-95K.
-------------------------------------------------- -------------------------------------------
** All explanations are for reference only and do not guarantee profit or loss in investment.
** Trading volume is displayed as a candle body based on 10EMA.
How to display (in order from darkest to darkest)
More than 3 times the trading volume of 10EMA > 2.5 times > 2.0 times > 1.25 times > Trading volume below 10EMA
** Even if you know other people’s know-how, it takes a considerable amount of time to make it your own.
** This chart was created using my know-how.
---------------------------------

Plan Ahead: SETUPS for ETH, LTC and DISHi Traders, Investors and Speculators of Charts📈📉
The markets are trading in the red and it can be hard to spot good trading opportunities during bloodbaths. However, that doesn't mean that you can't still find good trading opportunities.
Some of the setups in the video might come sooner than others; because crypto is more volatile than stocks I always expect crypto to move first, or with more extreme movements than stocks.
A few more high-reward low-risk setups here:💥
_______________________
📢Follow us here on TradingView for daily updates and trade ideas on crypto , stocks and commodities 💎Hit like & Follow 👍
We thank you for your support !
CryptoCheck

LTCUSDT Sell Limit we see consolidation on Litecoin 101.53 is sell limit level, TP around $92,50 ... Hope all moves will be bullish in crypto world...

LTC☀️ Ahead - Slightly Bullish Market; Yet, 🌧️ Week for Crypto Clouds and rain ☔ forecast for the global crypto market in the next 24 hours and week as bond yields surge to decade highs. Bearish sentiment looms for crypto coins.
Litecoin and Chainlink, however, bring a glimmer of ☀️, hinting at a slightly bullish trend.
Follow us for more crypto weather reports!

LTC/BTC ~ 4-years channelPlan > retest 4-years channel (0,0032-0,0030 = ~ Fib 0,382) and moon
Target > ~ 0,010 - 0,013
Time > ~ 5-8 months (april-july 2023)
P.S. I know in the previous forecast I overestimated the bulls, it's because I thought we still have time before the start of the bear market.
But look how perfectly the channel worked.
I think that we will still test it, as a correction, before the moon.
--------------------------------------------------------------
The first reason is that Bitcoin has not bottomed out. (13,000$ - 10,000$, perfect - 12,000$)
The second is that Litecoin has not bottomed in the USD pair (experience tells me that it is somewhere between $40-25, but if you see $30, don't wait for $25) or has not tested the intermediate bottom ($40).
--------------------------------------------------------------
I don't think the bear will last long, it may take a few days or hours to resolve.
Maybe I'm wrong, and from here we will leave $ 100 or even more, you always need to have a back-up plan.
Keep abreast of the market

Fast Rabbit or Smart TurtleOk, let's try to figure out what's going on.
First, I would like to start with my previous chart (published Jan 13, 2021) which I am constantly updating, tired of updating.
The bullish parabola worked, although not in the way I expected, summer suddenly popped up and ruined our plans to be rich. And the 5th Elliott wave turned out to be shorter than the 3rd, and did not even reach 400. After that, a bear market began, and we will talk about it.
So, I have doubts that the bear market is over, maybe it is, and we are in the accumulation phase, but here's what gives me peace of mind:
1) Bitcoin, did not finish the final candles.
2) LTC/USD just touched $40, flew off in a bullish channel (which looks like a bear flag twin), and trades at 2x its low.
3) LTC/BTC broke through the 4-year down channel and flew quite high, didn't even test it, and all that's holding it back now is candle shadow resistance and bitcoin uncertainty.
What's next?
1) The red channel is over, that's understandable
2) As a resistance, we have an ascending green channel, and the level of $78 (1 weekly close). I want you to understand that this is what is holding back growth in this piece.
3) Below the main green, we have a supporting green, and a yellow resistance channel (from the tops of 2021 where the 3rd and 5th Elliot waves ended). Below they are in contact, the price will not necessarily come there, but this is the place of a potential fall - IF IT WILL.
PS: I want to note that the upper part of the YELLOW channel can be a problem for us, a good resistance (about $100) if we break through $78 and the green channel. I am sure that there will be NO problems if we charge below before growth.
<--- I also have a theory, in favor of the bear, that this correction is quite difficult, and now it looks like a 4 bear wave, wave 5 will complete it somewhere between $40-25. (wxyxz) --->
Results: I don't know for sure where the market will go. I remember about the halving, but it doesn't hurt to throw out everyone who is holding a long in the end.
So let's buy it for $40... or $140.
Not long left waiting!
