LTC Livermore coneThis is a bullish view of LTC. LTC has consolidated at around $50 for 6 months after dropping 85%. Now price has broken over the range and seems to find support from the bottom of the range.
Furthermore, it appears that price action is printing a livermore cone that can breakout. Breakout of the cone will push the price in the upper ranges between 235 and 310.
I don't encourage trading LTC. LTC was the first coin in crypto history to be rugged by its founder.
LTCUSD

🚀Litecoin: the third wave of the ending diagonal.●● Preferred count
● Litecoin / U.S.Dollar (BITFINEX), 🕐TF: 2D
Fig.1
The long-term waves counting has not undergone any changes. It is assumed that the cycle wave V unfolds the ending diagonal , subdividing into sub-waves ①-②-③-④-⑤ . At the moment, the market is at an early stage of development of sub-wave ③ . Wave ③ should exceed the length of wave ② , taking the form of a zigzag.
_________________
● Litecoin / TetherUS (BINANCE), 🕐TF: 6h
Fig.2
For the last six months, the waves have been unfolding according to our expectations on the six-hour timeframe as well. The completion of waves ② and 2 , as well as the beginning of the development of wave 3 , were predicted.
At the moment the market is ready for acceleration in the wave (iii) of ((iii)) of 3 . As a local alternative, it is allowed to complicate the structure of wave 2 to a combination .
_________________
_________________
●● Alternative count
● Litecoin / U.S.Dollar (BITFINEX), 🕐TF: 2D
Fig.3
As you know, correctional structures are more variable, in contrast to impulse waves. The downward zigzag A-B-C can be identified as a sub-wave (W) within the unfolding double zigzag (W)-(X)-(Y) of ② .
Get ready for the second wave of the diagonal to transform into a multiple zigzag .
📚 Elliott Wave Guide & Ellott Wave Archive ⬇️⬇️

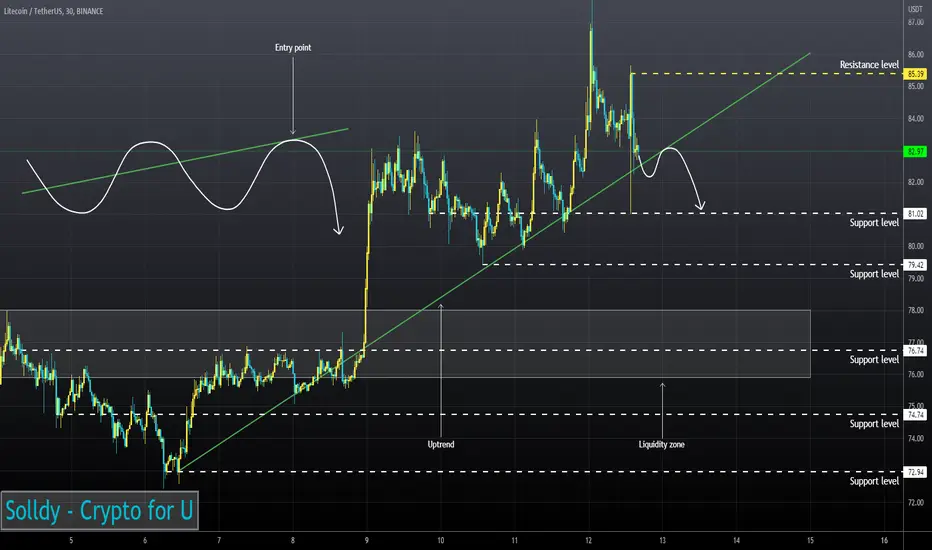
LTCUSD ❕ tests the uptrend lineLitecoin continues to move above liquidity.
I expect the asset to unload into liquidity area or sideways movement to the nearest support level before further growth.
ETHUSD and LTCUSD Technical Analysis – 12th JAN, 2023ETHUSD: Bullish Harami Pattern Above $1237
Ethereum was unable to sustain its bearish momentum and after touching a low of 1237 on 06th Jan, the price started to correct upwards against the US dollar crossing the $1400 handle today in the European trading session.
The prices are ranging near a new record high of 1 month.
We have seen a bullish opening in the markets this week.
We can clearly see a bullish harami pattern above the $1237 handle which is a bullish pattern and signifies the end of a bearish phase and the start of a bullish phase in the markets.
ETH is now trading just above its pivot level of 1398 and moving in a strongly bullish channel. The price of ETHUSD is now testing its classic resistance level of 1401 and Fibonacci resistance level of 1403 after which the path towards 1500 will get cleared.
We have also seen the formation of an upside gap in the 15-minute time frame indicating the bullish nature of the markets.
The relative strength index is at 70.66 indicating a strong demand for Ether and the continuation of the buying pressure in the markets.
The Williams percent range is indicating an overbought market, which means that the price is expected to decline in the short-term range.
Most of the technical indicators are giving a STRONG BUY market signal.
Most of the moving averages are giving a STRONG BUY signal at the current market levels of $1399.
ETH is now trading Above both the 100 hourly simple and 200 hourly exponential moving averages.
Ether: bullish reversal seen above the $1237 mark
The short-term range appears to be strongly bullish
ETH continues to remain above the $1350 level
The average true range is indicating HIGH market volatility
Ether: Bullish Reversal Seen Above $1237
ETHUSD continues to trade higher against the US dollar and bitcoin. The price of Ethereum remains supported above the $1300 level and now we are testing the break of the $1500 handle.
The momentum Indicator is back over zero in the weekly time frame.
We can see the formation of a bullish price crossover pattern with moving average MA20 in the weekly time frame.
The resistance of the channel is broken in the daily time frame indicating bullish trends.
ETHUSD touched an intraday low of 1341 in the Asian trading session and an intraday high of 1417 in the European trading session today.
The daily RSI is printing at 75.77 indicating a STRONG demand for Ether in the long-term range.
The key support levels to watch are $1275 at which the price crosses 9-day moving average and at $1313 which is a 38.2% retracement from a 4-week high.
ETH has increased by 4.62% with a price change of 61.65$ in the past 24hrs and has a trading volume of 9.607 billion USD.
We can see an increase of 74.76% in the total trading volume in the last 24 hrs which is due to the heavy buying pressure seen in the global markets.
The Week Ahead
ETH has already made a successful attempt at crossing the $1400 level and the next targets are located at $1500 and $1600 levels in the medium-term.
We can see the formation of an ascending channel from $1237 towards $1421.
The immediate short-term outlook for Ether has turned strongly bullish, the medium-term outlook has turned bullish, and the long-term outlook for Ether is neutral under present market conditions.
The resistance zone is located at $1413 which is a 1-month high, and at $1442 which is a 38.2% retracement from a 13-week high.
The weekly outlook is projected at $1550 with a consolidation zone of $1500.
Technical Indicators:
The STOCH (9,6): is at 57.42 indicating a BUY
The MACD (12,26): is at 16.00 indicating a BUY
The ultimate oscillator: is at 51.75 indicating a BUY
The rate of price change: is at 4.24 indicating a BUY
LTCUSD: Bullish Engulfing Pattern Above $72.59
Litecoin was unable to sustain its bearish momentum last week and after touching a low of $72.59 on 06th Jan, the price started to move upwards against the US dollar crossing the $85 handle today in the European trading session.
We have seen a bullish opening of the markets this week.
We can clearly see a bullish engulfing pattern above the $72.59 handle which is a bullish pattern and signifies the end of a bearish phase and the start of a bullish phase in the markets.
Litecoin is now trading above its 100 hourly simple moving average and below its 200 hourly simple moving averages. The price of LTCUSD is just below its pivot level of 83.97.
The relative strength index is at 60.79 indicating a STRONG demand for Litecoin and the continuation of the buying pressure in the markets.
The price of Litecoin continues to remain above most of the moving averages, which are now giving a BUY signal at the current market level of 83.81.
The price of Litecoin is nearing a NEW record high of 1-months.
The MACD indicator is back over zero in the weekly time frame.
The RSI indicator is back over 50 in the 30-minute time frame indicating a bullish trend.
The short-term outlook for Litecoin has turned strongly bullish.
Most of the technical indicators are giving a buy signal
Litecoin: bullish reversal seen above the $72.59 level
STOCH is giving a NEUTRAL signal
The average true range is indicating LESS market volatility
Litecoin: Bullish Reversal Seen Above $72.59
The price of Litecoin continues to move in a strongly bullish momentum against the US dollar having already crossed the $80 and $85 levels. We are now looking to breach the $90 level.
The super trend indicator is giving a bullish reversal signal in the weekly time frame.
We can see the formation of the moving average bullish crossover pattern with the adaptive moving averages AMA20 and AMA50 in the daily time frame.
The price of LTCUSD is now facing its classic resistance level of 84.62 and Fibonacci resistance level of 85.49 after which the path towards $90 will get cleared.
Litecoin touched an intraday low of $82.19 in the Asian trading session and an intraday high of $86.43 in the European trading session today.
Litecoin is now facing its resistance zone at $83.68 which is a 38.2% retracement from a 52 week low and at $85.37 which is a 3-10 -day MACD oscillator stalls.
LTCUSD has increased by 2.11% with a price change of 1.73$ in the past 24hrs and has a trading volume of 0.717 billion USD.
Litecoin’s trading volume has increased by 17.85% compared to yesterday which appears to be normal.
The Week Ahead
The price of Litecoin has been successful in clearing the $85 resistance and now the next potential upsides are located at $90.
Some of the technical indicators are also giving a neutral stance.
The price of Litecoin needs to remain above the important support levels of $76.83 which is a 38.2% retracement from a 4-week high and at $77.56 at which the price crosses 9-day moving average.
The short-term outlook for Litecoin has turned strongly bullish, the medium-term outlook is bullish, and the long-term outlook is neutral at present market conditions.
The weekly outlook is projected at $90 with a consolidation zone of $85.
Technical Indicators:
The relative strength index (14): is at 60.79 indicating a BUY
The average directional index (14): It is at 30.14 indicating a BUY
The rate of price change: is at 0.603 indicating a BUY
Bull/bear power (13): is at 3.27 indicating a BUY
Disclaimer: This forecast represents FXOpen Companies opinion only, it should not be construed as an offer, invitation or recommendation in respect to FXOpen Companies products and services or as financial advice.

EtheriumCOINBASE:ETHUSD once again is attempting to trade above the 150 EMA, two previous attempts failed. Is it different this time? COINBASE:LTCUSD is having a nice time above this level.

LTCUSD Market Map For A 97.98 TestIn this update we review the recent price action in LTCUSD and identify the next high probability trading opportunity and price objectives to target

Joe Gun2Head Trade - Swing failure on LTCUSDTrade Idea: Selling LTCUSD
Reasoning: Swing failure
Entry Level: 83.04
Take Profit Level: 77.94
Stop Loss: 84.45
Risk/Reward: 3.37:1
Disclaimer – Signal Centre. Please be reminded – you alone are responsible for your trading – both gains and losses. There is a very high degree of risk involved in trading. The technical analysis , like all indicators, strategies, columns, articles and other features accessible on/though this site is for informational purposes only and should not be construed as investment advice by you. Your use of the technical analysis , as would also your use of all mentioned indicators, strategies, columns, articles and all other features, is entirely at your own risk and it is your sole responsibility to evaluate the accuracy, completeness and usefulness (including suitability) of the information. You should assess the risk of any trade with your financial adviser and make your own independent decision(s) regarding any tradable products which may be the subject matter of the technical analysis or any of the said indicators, strategies, columns, articles and all other features.

Litecoin #LTC having pumpLitecoin (LTC) is a cryptocurrency that was designed to provide fast, secure and low-cost payments by leveraging the unique properties of blockchain technology.
To learn more about this project, check out our deep dive of Litecoin.

LtcusdExpecting LTC to tap 123 coming into halving narrative, 1st ever altcoin etc
Should occur q1 or q2

Litecoin- Where to buy for 100 target?In my video from Sunday and yesterday, in my outlook for Bitcoin, I said that I've become bullish crypto market.
Litecoin is not an exception and, in fact, I'm bullish on this coin since November when I first bought it at 50.
My target for this coin remains 100 zone and with the price facing resistance at this moment, a correction could follow.
This correction could offer us a good buying opportunity and 75 could be a great place considering a stop loss under 65.

LiteCoin LONGthink this will be one of the safest trades of the 1st half of 2023
-Litecoin halving Aug 2023. Price has a history of rising up to halving (see prior $LTC and $BTC halvings)
-Will be looking to TP between $150-$250

VIEW ON LTCLTC will probably bounce in blue zone for a while if it gets rejected then we might see a slight retracement down back to 72 or below if support doesn't hold. but if doesn't get rejected then we might be looking at higher move upward considering we are in the trending market at the moment.

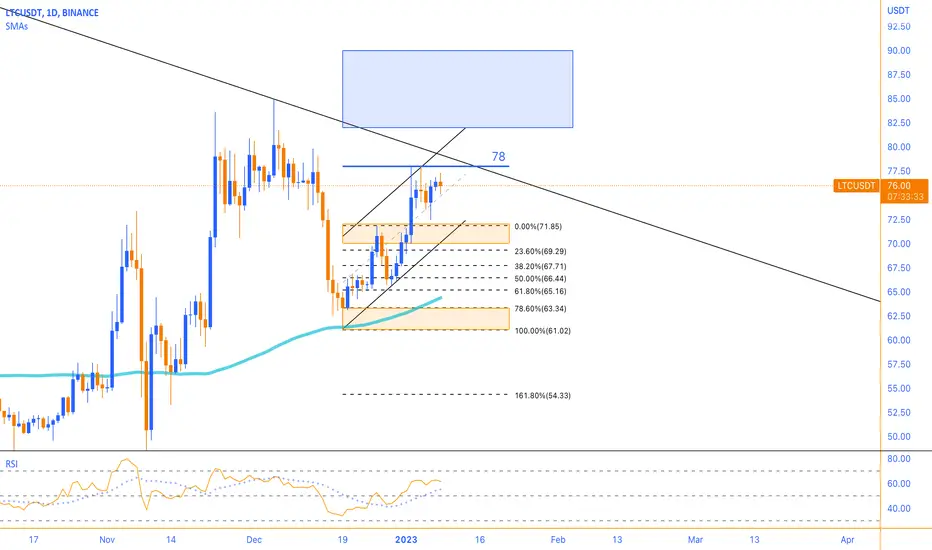
The trend is upward in the daily timeframeLTC continued its price increase last week. Maintaining the uptrend line it intended for broke the resistance of the $70-$72 range, and the price continued to rise to the $78 level. We can consider an ascending channel for the current price. Breaking the resistance of the $78 range could create a new bullish wave in the 4-hour timeframe and activate the next target in the $82-90 range. Considering that the trend is upward in the daily time frame, breaking the upcoming resistance, if accompanied by strong ascending candles in the daily time frame, can bring the price to the next target. Finally, to break the ceiling of the descending channel, a strong bullish candle needs to be closed above the $90 resistance zone in the weekly time frame. Otherwise, the failures can be fake.
Litecoin TurtleLitecoin is the slowest coin to grow.
After the whole market rises, it wakes up and starts to overtake everyone.
He is like a turtle, from the cartoon "The Tortoise and the Hare", and no matter how fast the hare is, the turtle will reach the finish line before him.

GOING SHORT IN LTCUSDBearish Indications
1. Double Top Formation
2. Significant Resistance
3. Bearish ABCD Pattern
4. Bearish Divergence
Bullish Indications
1. Higher Highs and Lows

Litecoin LTC bullish ahead of the FOMC Press ConferenceI am bullish on Litecoin LTC ahead of the FOMC Press Conference.
Those are my price targets:
LTC/USDT
Entry Range: $57 - 61
Price Target 1: $65
Price Target 2: $71
Price Target 3: $75
Stop Loss: $53

LTCUSD Will Move Higher! Buy!
Hello,Friends!
In this market situation, I am looking at multiple indicators
And I can see bullish momentum accumulating on the pair right now
This setiment makes me bullish biased and I am considering a long!
Like and subscribe and comment my ideas if you enjoy them!

LITECOIN 2021-2022 FINAL BULLGreetings. As always i'm happy to share my long charts. Seeing how i've been developing the price action and sentiment on Litecoin all year its pretty clear to me now that it's November 2021 that the price will move up and same as Bitcoin, Litecoin is in the middle of Wave 5. This is a major rising wedge due for breakout and overshoot to parabolic on or around February 2022. LTC can't get much lower from here, or the bull market quickly converts to Bear Market. But I say we are close. TARGETING a final price of 2590 USD at the very top. This price for Litecoin is not a shocker, especially with the developments Litecoin has been releasing especially MWEB (Mimble Wimble) Privacy, smart contracts, and more.
I am targeting a final dip to 290 - 202 USD LTC. We can not sustain much lower or we will have issues declaring a bull market.

Litecoin Holding SupportLitecoin has held the key support. Looking for monthly MACD to cross up to confirm. Early days but could be epic rally coming. Target up to the Kijun @ $228

✅TS ❕ LTCUSD: fixed above the resistance✅✅ Litecoin has fixed above the mirror resistance level.
The asset keeps its momentum and trend.
Growth will continue✅
🚀 BUY scenario: long to the resistance area.🚀
----------------------------------------------------------------------------
Remember, there is no place for luck in trading - only strategy!
Thanks for the likes and comments.

LTCVery simple ... Very clear!
Everything is marked on the chart.
This is my personal opinion. Please do not trade based on my analysis and data.

ETHUSD and LTCUSD Technical Analysis – 05th JAN, 2023ETHUSD: Bullish Engulfing Pattern Above $1181
Ethereum was unable to sustain its bearish momentum and after touching a low of 1181 on 30th Dec, the price started to correct upwards against the US dollar moving into a consolidation channel above the $1200 handle today in the European trading session.
We can see the formation of bullish engulfing lines in the weekly time frame.
We can clearly see a bullish engulfing pattern above the $1181 handle which is a bullish pattern and signifies the end of a bearish phase and the start of a bullish phase in the markets.
ETH is now trading just below its pivot level of 1251 and moving into a consolidation channel. The price of ETHUSD is now testing its classic resistance level of 1254 and Fibonacci resistance level of 1257 after which the path towards 1300 will get cleared.
The relative strength index is at 69.10 indicating a STRONG demand for Ether and the continuation of the buying pressure in the markets.
The average directional index is indicating a NEUTRAL level, which means that the price is expected to remain under consolidation in the short-term range.
Most of the technical indicators are giving a BUY market signal.
Most of the moving averages are giving a BUY signal at the current market levels of $1250.
ETH is now trading Above its 100 hourly simple and 200 hourly exponential moving averages.
Ether: bullish reversal seen above the $1181 mark
The short-term range appears to be mildly bullish
ETH continues to remain above the $1250 levels
The average true range is indicating HIGH market volatility
Ether: Bullish Reversal Seen Above $1181
ETHUSD continues to move higher against the US dollar today and we are looking at $1300 as the immediate target.
We can see a bullish trend reversal pattern with the adaptive moving averages AMA20 and AMA50 in the daily time frame.
We have seen a bullish opening in the markets this week.
We have also detected the formation of a bullish harami cross pattern in the 2-hour time frame.
ETHUSD touched an intraday high of 1259 in the Asian trading session and an intraday low of 1248 in the European trading session today.
The daily RSI is printing at 55 indicating a NEUTRAL demand for Ether in the long-term range.
The key support levels to watch are $1228 at which the price crosses 18-day moving average, and $1233 which is a 14-3 day raw stochastic at 50%.
ETH has decreased by 0.04% with a price change of 0.5494$ in the past 24hrs and has a trading volume of 4.869 billion USD.
We can see a decrease of 7.00% in the total trading volume in the last 24 hrs which appears to be normal.
The Week Ahead
ETH’s price has started to break above the $1250 and is now looking at $1300 level. The potential upsides are $1300 to $1400 in the medium-term.
The prices of Ethereum are ranging near the support of the channel in the 15-minute time frame indicating bullish trends.
The immediate short-term outlook for Ether has turned mildly bullish, the medium-term outlook has turned neutral, and the long-term outlook for Ether is neutral under present market conditions.
The resistance zone is located at $1259 at which the price crosses 18-day moving average stalls, and at $1281 which is a 14-3 day raw stochastic at 80%.
The weekly outlook is projected at $1350 with a consolidation zone of $1300.
Technical Indicators:
The STOCHRSI: is at 63.54 indicating a BUY
The Williams percent range: is at -28.52 indicating a BUY
The rate of price change: is at 2.869 indicating a BUYThe bull/bear power (13): is at 26.01 indicating a BUY
LTCUSD: Bullish Harami Cross Pattern Above $65.61
Litecoin was unable to sustain its bearish momentum last week and after touching a low of $65.61 on 29th Dec, the price started to move upwards against the US dollar crossing the $75.00 handle on 04th Jan.
We have seen a bullish opening of the markets this week.
We can clearly see a bullish harami cross pattern above the $65.61 handle which is a bullish pattern and signifies the end of a bearish phase and the start of a bullish phase in the markets.
Litecoin is now trading above its 100 hourly simple moving average and below its 200 hourly simple moving average. The price of LTCUSD is just below its pivot level of 75.91.
The relative strength index is at 60.92 indicating a STRONG demand for Litecoin and the continuation of the buying pressure in the markets.
The price of Litecoin continues to remain above most of the moving averages, which are now giving a BUY signal at current market levels of 75.05.
The prices of Litecoin are nearing a NEW record high this week.
The aroon Indicator is giving a bullish trend in the 1-hour time frame.
The short-term outlook for Litecoin has turned strongly bullish.
Most of the technical indicators are giving a buy signal
Litecoin: bullish reversal seen above the $65.61 level
STOCHRSI is giving an OVERBOUGHT signal
The average true range is indicating LESS market volatility
Litecoin: Bullish Reversal Seen Above $65.61
The price of Litecoin is staging a recovery against the US dollar and the immediate visible targets are $80 and $85 levels.
We can see the formation of the moving average bullish crossover pattern with the adaptive moving averages AMA20 and AMA50 in the daily time frame.
The price of LTCUSD is now facing its classic resistance level of 75.33 and Fibonacci resistance level of 79.25 after which the path towards $80 will get cleared.
Litecoin touched an intraday high of $76.26 in the Asian trading session and an intraday low of $74.82 in the European trading session today.
Litecoin is now facing its resistance zone at $76.20 at which the price crosses 18-day moving average stalls and at $78.76 which is a 3-10 day MACD oscillator stalls.
LTCUSD has decreased by 1.89% with a price change of 1.44$ in the past 24hrs and has a trading volume of 0.443 billion USD.
Litecoin trading volume has decreased by 31.23% compared to yesterday which appears to be normal.
The Week Ahead
The price of Litecoin has failed to clear the resistance of $77 this week and is ranging near the NEW record high of 1 month.
After the current consolidation wave gets over, we are looking at $80 to $85 levels as the next potential targets.
Some of the technical indicators are also giving a neutral stance.
The price of Litecoin needs to remain above the important support level of $68.98 which is a 38.2% retracement from 4-week low.
The short-term outlook for Litecoin has turned strongly bullish, the medium-term outlook is neutral, and the long-term outlook is neutral at present market conditions.
The weekly outlook is projected at $85 with a consolidation zone of $80.
Technical Indicators:
The MACD (12,26): is at 0.872 indicating a BUY
The Williams percent range: is at -21.88 indicating a BUY
The ultimate oscillator: is at 59.89 indicating a BUY
The commodity channel index (14): is at 138.89 indicating a BUY
Disclaimer: This forecast represents FXOpen Companies opinion only, it should not be construed as an offer, invitation or recommendation in respect to FXOpen Companies products and services or as financial advice.

Litecoin to turnaround?Litecoin - 24h expiry - We look to Sell a break of 73.78 (stop at 75.81)
We are trading at overbought extremes.
Although the bulls are in control, the stalling positive momentum indicates a turnaround is possible.
A higher correction is expected.
A break of bespoke support at 74, and the move lower is already underway.
Our profit targets will be 69.01 and 68.01
Resistance: 76.00 / 77.55 / 79.50
Support: 74.00 / 71.00 / 69.00
Please be advised that the information presented on TradingView is provided to Vantage (‘Vantage Global Limited’, ‘we’) by a third-party provider (‘Signal Centre’). Please be reminded that you are solely responsible for the trading decisions on your account. There is a very high degree of risk involved in trading. Any information and/or content is intended entirely for research, educational and informational purposes only and does not constitute investment or consultation advice or investment strategy. The information is not tailored to the investment needs of any specific person and therefore does not involve a consideration of any of the investment objectives, financial situation or needs of any viewer that may receive it. Kindly also note that past performance is not a reliable indicator of future results. Actual results may differ materially from those anticipated in forward-looking or past performance statements. We assume no liability as to the accuracy or completeness of any of the information and/or content provided herein and the Company cannot be held responsible for any omission, mistake nor for any loss or damage including without limitation to any loss of profit which may arise from reliance on any information supplied by Signal Centre.
