XRP & LTC - Profitable Altcoins for 2023Hi Traders, Investors and Speculators 📈📉
Ev here. Been trading crypto since 2017 and later got into stocks. I have 3 board exams on financial markets and studied economics from a top tier university for a year. Daytime job - Math Teacher. 👩🏫
If I haven't already told you, Happy New Year 🥂
I'll be making a series of updates on Altcoins that have decent upside potential during 2023. I'll specifically select alts that are trading low and altcoins that are known to pump and dump independently of the overall market trend (bearish or bullish). It will be in your best interest to watch these alts, especially with talks of a recession on the rise. Good opportunities will be few and far apart, but you can still count on a few coins to rally during bear markets. Today's picks are XRPUSDT and LTCUSDT.
Check out my NEAR TERM view on BTC here : 👀
_______________________
📢Follow us here on TradingView for daily updates and trade ideas on crypto , stocks and commodities 💎Hit like & Follow 👍
We thank you for your support !
CryptoCheck
LTCUSD


LTCUSDT: Elliot Wave analysis tradeAccording to the chart, we are in the fifth wave of "wave c" and it is expected to support at $69 and move towards $109.

LTCUSD ❕ inverted hammerLitecoin is trading under liquidity.
Price is in the overbought RSI zone (4H TF)
At the peak of the current move, LTC formed an inverted hammer candlestick pattern (4H TF)
TD Sequential formed a reversal signal downwards (4H TF)
Price and RSI chart formed a bearish divergence at 1H and 30m Timeframes.
On the 30m Timeframe, price has broken down 50EMA and is testing the support level on the RSI chart.
I expect further price declines after it fixes under the liquidity zone.

A MAN CAN DREAM 2.0Looks more like a continuation pattern to me (ascending triangle)
i dont know if i have the patience, but i'm very excited ))
My dream,is it too wild??

Litecoin to find support at previous resistance?Litecoin - 22h expiry - We look to Buy at 71.01 (stop at 69.14)
Short term bias has turned positive.
20 8hour EMA is at 70.60.
Previous resistance at 71 now becomes support.
We look to buy dips.
Our profit targets will be 75.69 and 76.69
Resistance: 76.34 / 78.00 / 79.50
Support: 74.00 / 71.00 / 70.00
Please be advised that the information presented on TradingView is provided to Vantage (‘Vantage Global Limited’, ‘we’) by a third-party provider (‘Signal Centre’). Please be reminded that you are solely responsible for the trading decisions on your account. There is a very high degree of risk involved in trading. Any information and/or content is intended entirely for research, educational and informational purposes only and does not constitute investment or consultation advice or investment strategy. The information is not tailored to the investment needs of any specific person and therefore does not involve a consideration of any of the investment objectives, financial situation or needs of any viewer that may receive it. Kindly also note that past performance is not a reliable indicator of future results. Actual results may differ materially from those anticipated in forward-looking or past performance statements. We assume no liability as to the accuracy or completeness of any of the information and/or content provided herein and the Company cannot be held responsible for any omission, mistake nor for any loss or damage including without limitation to any loss of profit which may arise from reliance on any information supplied by Signal Centre.

Litecoin - LTC at important volume profile POC year end 2022👀🐻Litecoin
Bears will try to defend $76.76 - important volume profile POC year end 2022👀🐻🚨🚨
Will LTC get the bullish breakout or come down with US markets from tomorrow on dear Crypto Nation❓
Let me know your thoughts in the comments🤗
⬇️⬇️⬇️
Likes and Follow for updates appreciated🤗
Disclaimer:
Not financial advice
Do your own research before investing
The content shared is for educational purposes only and is my personal opinion

LTC.D First Big Breakout Litecoins first big breakout after a long bear period
A bullish reversal in the works? perhaps.
I like it


LTC - Positive momentumLTC has been trading in a range with positive momentum over the past week. LTC trades below the $70-$72 resistance range and the $62.1-$64.3 support range. But if you pay attention to the chart, the trend was downward before entering the range area. Therefore, we can draw a downward trend line, and if this dynamic support breaks, we can receive a price reduction signal. Also, in the 4-hour time frame, double ceiling patterns are forming under the roof of this resistance, which will be confirmed if the trend line is broken.
More accurate linear support can be considered at the price of $67.5. We can consider this range almost as the midline of the channel range, which in case of collision, there is a possibility of reacting to this level for minor fluctuations. But in the bullish scenario, if the current resistance is broken by buying pressure and the price growth continues to the level of $73.6, we can consider the resistance broken, and after the pullback to this level, expect to continue the upward movement to the $77 range. to be

Pre halving potential ROI for LITECOIN Today, I wanted to show similarities between the last halving and this one.
If we were to get the same ROI that we saw in 2015 and 2019, that we saw 6 months leading up to the halving, we could see a 200-300 LTC by the next halving 8-2023.
We closed above the POC, momentum is moving up.
The only thing I do not see yet is volume coming in.
I also do not know what LTC will do if BTC keeps tanking.
Let me know what you guys think and please like, comment and follow!
Thanks and God bless.

LTC 4H BUY and Support ZoneLTC 4H support is now at ~$66.5
Enter 50% at the current price
and try to set some BUY orders near the support zone
If LTC stays above the trendline,
the Take-Profit target would be 5%, 10%, and 15% from your entry
Cheers

LTC/USD BULLS WILL DOMINATE THE MARKET|LONG
Hello, Friends!
After some time of sending us mixed signals
LTC/USD is finally giving us a solid bullish bias
And judging by the price action at the lower timeframes
The pair is about to go up!
BUY!
✅LIKE AND COMMENT MY IDEAS✅

LTCUSD Will Move Higher! Long!
Hello,Friends!
LTCUSD is bullish right now
And I think that the market conditions are right
For the pair to move up
Therefore, I think it is sensible to go long!
Like and subscribe and comment my ideas if you enjoy them!


Litecoin forming Bullish Pennant on 3 month chartthis is a very large time frame 3 month, so this could take years to reach tarrget price.
we hawe 3 touches on trendline (the rule of 3) and allso volume is going down.
Pennant usualy make a false break to the down side, what is even more bullish, because it leads to higher momentum when it breaks up.
Please tap on a like button and coment below.
Happy new year 2023

Wait till it drops here before you buy!As LTC long term investor you've gotta wait for it to drop below 50 and then wait till price gets back here with a strong bullish candle. So far we can see it's clearly drawing a head and shoulder pattern which if complete will make price drop further but legendary support for LTC it's 50 so wait for bullish set ups when price comes back to this point then potential target would be at about 70 yay so wait and see!

LTC SHORT SETUPHello, dear traders. how are you ? Today we have a setup to SELL/SHORT the LTC symbol.
For risk management, please don't forget stop loss and capital management
When we reach the first target, save some profit and then change the stop to entry
Comment if you have any questions
Thank You

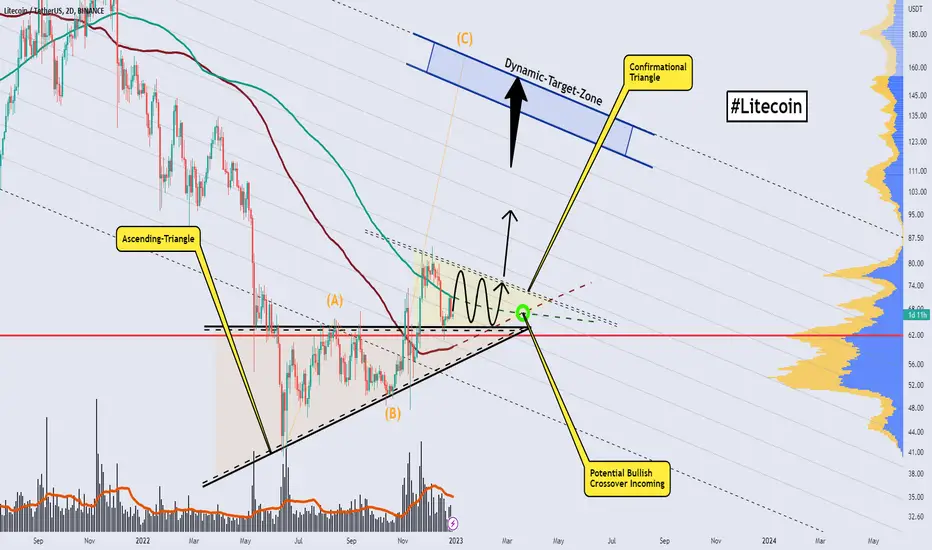
LITECOIN, Triangle Completion Points to Further Volatility!Hello Community,
as the year of 2022 is coming to an end the market shows up with important structures and developments that are necessary to watch and in this case there are coins in the market showing opportunities to move forward with. It is always necessary to look at the cryptocurrencies in the market with an increased pump potential in the market which other cryptocurrencies in the market do not show. In this case I detected a crucial formational structure developing in Litecoin with a determining potential to watch out, especially in the next times.
As when looking at my chart we can watch there how Litecoin recently completed this main ascending triangle formation with a breakout above the upper boundary and now Litecoin has come to an important point in the structure here as it is trading above the point of control marked in red within the volume profile in my chart, this is the point in which the most volatility is staying and as long as Litecoin holds above this area it is a good level and setup for further continuations to move forward with.
The longer Litecoin stays above this area and builds up as it is seen in my chart the stronger the preceding breakout and volatility continuation will be and once Litecoin also broke out above the upper boundary of the confirmational triangle this will be a setup from where Litecoin is going to accelerate heavily and activate the target zones seen in my chart. Once these targets have been reached it will be central on how Litecoin approaches the areas and if the volatility is high or not, in either of these scenarios further assumptions can be made.
In this manner, thank you everybody for watching. Let's move forward together.
The information provided is only educational and should not be used to take action in the markets.
LTCVery simple ... Very clear!
Everything is marked on the chart.
This is my personal opinion. Please do not trade based on my analysis and data.

LTCUSD Will Move Lower! Short!
Hello,Friends!
In this market situation, I am looking at multiple indicators
And I can see bearish momentum accumulating on the pair right now
This sentiment makes me bearish biased and I am considering a short!
Like and subscribe and comment my ideas if you enjoy them!

✅TS ❕ LTCUSD: the fall✅✅ LTC rested on the level.
The price has already bounced down from it.
I expect the fall to continue.✅
🚀 SELL scenario : short to 60.🚀
----------------------------------------------------------------------------
Remember, there is no place for luck in trading - only strategy!
Thanks for the likes and comments

LTC - Recent growth was a fake breakout!The price movement in the daily time frame shows that the price has returned below the resistance level of 73.90-70.20.
Therefore, we can conclude that the recent growth was a fake breakout.
The failure of $63.36 confirms the possibility of continuing the downward trend and the expectation for the continuation of the decline to the previous support range of $51 - $47.
