Litecoin Tests Key Support: Reversal or Further Drop?Litecoin is currently testing a key support zone between $80.0 and $83.0, which previously marked its February low. The overall trend remains bearish, but this support level could trigger a price rebound, potentially shifting momentum in favor of buyers.
If Litecoin holds above $80.0, there is a possibility of a recovery toward $100.0.
LTCUSD

LTCUSD INTRADAY, sideways consolidation capped at 960.00Trend Overview: LTC/USD exhibits a neutral sentiment within a prevailing range-bound trading structure. The recent price action suggests an oversold bounce-back, forming a bearish sideways consolidation. This indicates indecision in the market, with neither bulls nor bears taking full control.
Key Levels:
Resistance: 960.00, 988.50, 1031.40
Support: 883.00, 840.10, 808.80
Price Action Analysis: The key resistance level at 960.00 serves as a crucial pivot point. An oversold rally from current levels could face rejection at this zone, leading to further downside movement. Failure to break this resistance may result in renewed bearish momentum, targeting lower support levels at 883.00, followed by 840.10 and 808.80 in the longer timeframe.
Alternatively, a confirmed breakout and daily close above 960.00 would shift sentiment to bullish, potentially opening the door for an upward move towards 988.50 resistance. Further bullish momentum could drive LTC/USD to 1031.40, reinforcing a stronger uptrend.
Conclusion: LTC/USD remains in a consolidation phase, with the 960.00 level acting as a decisive point for future price direction. A bearish rejection at this level could reinforce a downward trajectory, while a breakout above it would invalidate the bearish bias, signaling potential further gains. Traders should closely monitor price action near 960.00 to assess the next significant move.
This communication is for informational purposes only and should not be viewed as any form of recommendation as to a particular course of action or as investment advice. It is not intended as an offer or solicitation for the purchase or sale of any financial instrument or as an official confirmation of any transaction. Opinions, estimates and assumptions expressed herein are made as of the date of this communication and are subject to change without notice. This communication has been prepared based upon information, including market prices, data and other information, believed to be reliable; however, Trade Nation does not warrant its completeness or accuracy. All market prices and market data contained in or attached to this communication are indicative and subject to change without notice.

Litecoin LTF Signals Potential Bullish Catapult in PlayWith SEC decision day for the Litecoin ETF delayed until May 5, 2025 , seems those idle hands are idle no more with Litecoin.
From a fundamentals perspective, the hash rate for Litecoin is in overdrive since November, racing to the 2.37 PH/s handle, and continues to dominate as the most used cryptocurrency for transactions on Bitpay (34.7%), surpassing Bitcoin, Ethereum, and USD stables.
From a very basic fundamentals perspective, it seems Litecoin should be primed for a move higher in the near term.
Potential Bullish Catapult & Target Price
In Point & Figure Charting “a typical Bullish Catapult forms with a Triple Top Breakout, a pullback, and then a Double Top Breakout.”
The formation is showing a clear triple top followed by a Sign of Strength (SOS) on the breakout to the $97 handle. It appears to be a textbook Bullish Catapult formation. The Horizontal Price Count suggests that if this formation plays out, the target price for this move would be the $120 handle.
Always remember this is not trading advice.
Outside of that, Happy Trading.

LTCUSD INTRADAY at decisive point Technical Analysis of LTC/USD
Trend Overview: LTC/USD exhibits a neutral sentiment within a prevailing range-bound trading structure. The recent price action suggests an oversold bounce-back, forming a bearish sideways consolidation. This indicates indecision in the market, with neither bulls nor bears taking full control.
Key Levels:
Resistance: 960.00, 988.50, 1031.40
Support: 883.00, 840.10, 808.80
Price Action Analysis: The key resistance level at 960.00 serves as a crucial pivot point. An oversold rally from current levels could face rejection at this zone, leading to further downside movement. Failure to break this resistance may result in renewed bearish momentum, targeting lower support levels at 883.00, followed by 840.10 and 808.80 in the longer timeframe.
Alternatively, a confirmed breakout and daily close above 960.00 would shift sentiment to bullish, potentially opening the door for an upward move towards 988.50 resistance. Further bullish momentum could drive LTC/USD to 1031.40, reinforcing a stronger uptrend.
Conclusion: LTC/USD remains in a consolidation phase, with the 960.00 level acting as a decisive point for future price direction. A bearish rejection at this level could reinforce a downward trajectory, while a breakout above it would invalidate the bearish bias, signaling potential further gains. Traders should closely monitor price action near 960.00 to assess the next significant move.
This communication is for informational purposes only and should not be viewed as any form of recommendation as to a particular course of action or as investment advice. It is not intended as an offer or solicitation for the purchase or sale of any financial instrument or as an official confirmation of any transaction. Opinions, estimates and assumptions expressed herein are made as of the date of this communication and are subject to change without notice. This communication has been prepared based upon information, including market prices, data and other information, believed to be reliable; however, Trade Nation does not warrant its completeness or accuracy. All market prices and market data contained in or attached to this communication are indicative and subject to change without notice.

DOT & LTC TRADE SET UPDOT LONG
Entry Price 1: $4.60
Entry Price 2: $4.40
Stop Loss: $4.10
Take Profit 1: $4.80
Take Profit 2: $5.00
Take Profit 3: $5.20
Take Profit 4: $5.50
Status: ACTIVE
LTC NEUTRAL WAITING FFOR BREAK OUT

LTCUSDCrypto ,solana took off , eth as well bitcoin is doing the same ,now here its the same thing waiting for that break and from there it will fly!!!!

Litecoin LTCUSD at pivotal level Litecoin (LTCUSD) remains in a neutral stance, as price action continues to trade within a longer-term sideways range. The key trading level at 940.00 will play a crucial role in determining the next directional move.
Key Levels to Watch
Resistance Levels: 1,120, 1,217, 1,320, 1,374
Support Levels: 859.00, 816.00
Bearish Scenario
If LTCUSD fails to bounce back from 940.00 and faces rejection, a downside move could emerge. A sustained decline below this level may trigger selling pressure, targeting 859, followed by a potential retest of the 816.00 psychological support over the longer timeframe.
Bullish Scenario
A decisive bounce back from the 940.00 support level, confirmed by a daily close higher, would shift sentiment toward a bullish outlook. This could open the way for further gains, with upside targets at 1,120, followed by 1,217 and1,274 in an extended rally.
Conclusion
LTCUSD is currently consolidating within a neutral range, with 940.00 acting as a key pivot level. A rejection from this zone could reinforce bearish pressure, while a breakout above 1,120 could confirm bullish momentum. Traders should monitor these levels for confirmation of the next move.
This communication is for informational purposes only and should not be viewed as any form of recommendation as to a particular course of action or as investment advice. It is not intended as an offer or solicitation for the purchase or sale of any financial instrument or as an official confirmation of any transaction. Opinions, estimates and assumptions expressed herein are made as of the date of this communication and are subject to change without notice. This communication has been prepared based upon information, including market prices, data and other information, believed to be reliable; however, Trade Nation does not warrant its completeness or accuracy. All market prices and market data contained in or attached to this communication are indicative and subject to change without notice.

LTCUSD The Week Ahead 17th March ’25 Litecoin (LTCUSD) remains in a neutral stance, as price action continues to trade within a longer-term sideways range. The key trading level at 940.00 will play a crucial role in determining the next directional move.
Key Levels to Watch
Resistance Levels: 1,120, 1,217, 1,320, 1,374
Support Levels: 859.00, 816.00
Bearish Scenario
If LTCUSD fails to bounce back from 940.00 and faces rejection, a downside move could emerge. A sustained decline below this level may trigger selling pressure, targeting 859, followed by a potential retest of the 816.00 psychological support over the longer timeframe.
Bullish Scenario
A decisive bounce back from the 940.00 support level, confirmed by a daily close higher, would shift sentiment toward a bullish outlook. This could open the way for further gains, with upside targets at 1,120, followed by 1,217 and1,274 in an extended rally.
Conclusion
LTCUSD is currently consolidating within a neutral range, with 940.00 acting as a key pivot level. A rejection from this zone could reinforce bearish pressure, while a breakout above 1,120 could confirm bullish momentum. Traders should monitor these levels for confirmation of the next move.
This communication is for informational purposes only and should not be viewed as any form of recommendation as to a particular course of action or as investment advice. It is not intended as an offer or solicitation for the purchase or sale of any financial instrument or as an official confirmation of any transaction. Opinions, estimates and assumptions expressed herein are made as of the date of this communication and are subject to change without notice. This communication has been prepared based upon information, including market prices, data and other information, believed to be reliable; however, Trade Nation does not warrant its completeness or accuracy. All market prices and market data contained in or attached to this communication are indicative and subject to change without notice.

Litecoin is in a bearish cycle (12H)From the point where we placed an arrow on the chart, it appears that Litecoin's complex correction has begun.
Currently, we seem to be in wave C of this correction.
Wave C, based on the 3D structure, could end at demand 1, leading to wave D, which is a bullish wave.
However, ultimately, wave E could conclude within the demand 2 zone.
Liquidity pools for waves C and E are marked on the chart, and it is expected that each will be swept in turn.
For risk management, please don't forget stop loss and capital management
Comment if you have any questions
Thank You

LTC/USD "Litecoin vs US Dollar" Crypto Market Heist Plan🌟Hi! Hola! Ola! Bonjour! Hallo!🌟
Dear Money Makers & Robbers, 🤑💰🐱👤🐱🏍
Based on 🔥Thief Trading style technical and fundamental analysis🔥, here is our master plan to heist the LTC/USD "Litecoin vs US Dollar" Crypto market. Please adhere to the strategy I've outlined in the chart, which emphasizes long entry. Our aim is the high-risk Red Zone. Risky level, overbought market, consolidation, trend reversal, trap at the level where traders and bearish robbers are stronger. 🏆💸Book Profits Be wealthy and safe trade.💪🏆🎉
Entry 📈 : "The vault is wide open! Swipe the Bullish loot at any price - the heist is on!
however I advise placing Buy limit orders within a 15 or 30 minute timeframe. Entry from the most recent or closest low or high level should be in retest.
Stop Loss 🛑: Thief SL placed at 110.00 (swing Trade Basis) Using the 4H period, the recent / nearest low level.
SL is based on your risk of the trade, lot size and how many multiple orders you have to take.
Target 🎯: 165.00 (or) Escape Before the Target
Scalpers, take note 👀 : only scalp on the Long side. If you have a lot of money, you can go straight away; if not, you can join swing traders and carry out the robbery plan. Use trailing SL to safeguard your money 💰.
📰🗞️Fundamental, Macro, COT, Sentimental Outlook:
LTC/USD "Litecoin vs US Dollar" Crypto Market market is currently experiencing a bullish trend,., driven by several key factors.
🔱Fundamental Analysis
Litecoin Adoption: Growing adoption of Litecoin as a payment method, with increasing transaction volumes.
Halving Event: The upcoming halving event in August 2025 is expected to reduce Litecoin's block reward, potentially increasing demand and prices.
Competition from Other Cryptocurrencies: Increasing competition from other cryptocurrencies, such as Bitcoin and Ethereum, may impact Litecoin's market share.
🔱Macro Economics
Global Economic Trends: The ongoing global economic recovery is expected to drive up demand for cryptocurrencies, including Litecoin.
Inflation Rate: Global inflation is expected to rise to 3.8% in 2025, potentially increasing demand for cryptocurrencies as a hedge against inflation.
Interest Rates: Central banks are expected to maintain low interest rates in 2025, supporting cryptocurrency markets.
🔱COT Data
Net Long Positions: Institutional traders have increased their net long positions in Litecoin to 60%.
COT Ratio: The COT ratio has risen to 2.5, indicating a bullish trend.
Open Interest: Open interest in Litecoin futures has increased by 20% over the past month, indicating growing investor interest.
🔱Sentimental Outlook
Institutional Sentiment: 65% bullish, 35% bearish.
Retail Sentiment: 60% bullish, 40% bearish.
Market Mood: The overall market mood is bullish, with a sentiment score of +40.
🔱Technical Analysis
Moving Averages: 50-period SMA: 120.00, 200-period SMA: 110.00.
Relative Strength Index (RSI): 4-hour chart: 62.21, daily chart: 58.14.
Bollinger Bands: 4-hour chart: 130.00 (upper band), 120.00 (lower band).
🔱Next Move Prediction
Bullish Move: Potential upside to 150.00-170.00.
Key Support Levels: 120.00, 110.00.
Key Resistance Levels: 150.00, 170.00.
🔱Market Overview
Current Price: 130.00
Daily Change: 2.5%
Weekly Change: 10.2%
Overall Outlook
🔱The overall outlook for LTC/USD is bullish, driven by a combination of fundamental, technical, and sentimental factors. The expected increase in Litecoin adoption, upcoming halving event, and bullish market sentiment are all supporting the bullish trend. However, investors should remain cautious of potential downside risks, including changes in global economic trends and unexpected regulatory developments.
⚠️Trading Alert : News Releases and Position Management 📰 🗞️ 🚫🚏
As a reminder, news releases can have a significant impact on market prices and volatility. To minimize potential losses and protect your running positions,
we recommend the following:
Avoid taking new trades during news releases
Use trailing stop-loss orders to protect your running positions and lock in profits
📌Please note that this is a general analysis and not personalized investment advice. It's essential to consider your own risk tolerance and market analysis before making any investment decisions.
📌Keep in mind that these factors can change rapidly, and it's essential to stay up-to-date with market developments and adjust your analysis accordingly.
💖Supporting our robbery plan will enable us to effortlessly make and steal money 💰💵 Tell your friends, Colleagues and family to follow, like, and share. Boost the strength of our robbery team. Every day in this market make money with ease by using the Thief Trading Style.🏆💪🤝❤️🎉🚀
I'll see you soon with another heist plan, so stay tuned 🤑🐱👤🤗🤩

Litecoin Set to Break Below Support Point- $60 in Sight?Litecoin ( CRYPTOCAP:LTC ) a cryptocurrency that was designed to provide fast, secure and low-cost payments by leveraging the unique properties of blockchain technology is set to go bearish amidst dipping down to the support point should the market continue its bearish pattern, CRYPTOCAP:LTC is set to tanked finding support in the $60- 65 support.
With buying pressure decreasing and Relative Strength Index (RSI) at 31.92, CRYPTOCAP:LTC could be on the cusp of a selling spree.
Similarly, a breakout above the $140 resistance zone could liberate CRYPTOCAP:LTC from the bears thereby aiming new resistant points.
However, data from DefiLama shows about $2.23 million has been locked in Total Value lock (TVL) on the Litecoin ecosystem hinting on a development on the Litecoin chain in the long term. This value shows a level of trust placed on the Litecoin Blockchain.
About Litecoin
Litecoin was released via an open-source client on GitHub on Oct. 7, 2011, and the Litecoin Network went live five days later on Oct. 13, 2011. Since then, it has exploded in both usage and acceptance among merchants and has counted among the top ten cryptocurrencies by market capitalization for most of its existence.
The cryptocurrency was created by Charlie Lee, a former Google employee, who intended Litecoin to be a "lite version of Bitcoin," in that it features many of the same properties as Bitcoin—albeit lighter in weight.
Litecoin Price Live Data
The live Litecoin price today is $87.46 USD with a 24-hour trading volume of $508,275,483 USD. Litecoin is down 3.21% in the last 24 hours, with a live market cap of $6,608,334,524 USD. It has a circulating supply of 75,558,468 LTC coins and a max. supply of 84,000,000 LTC coins.

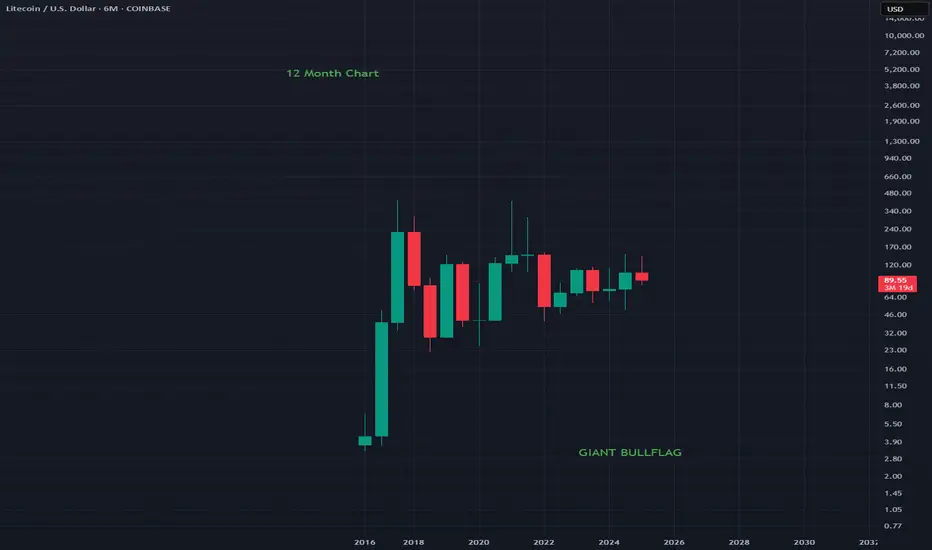
LTCUSD - 12 Month Chart Litecoin has produced a beautiful Bullflag on the 12 Month chart
Its honestly crazy how great this looks on a yearly timeframe
If you want to go very very long this is a great option
MASSIVE BULLFLAG
LTCUSD BUY AND SELL ZONES FOR SHORT TERM GAIN.Charting the buy and sell areas for a short term upside move in Litecoin.

LTCUSD below previous support, now resistance at 940.00Litecoin (LTCUSD) remains in a neutral stance, as price action continues to trade within a longer-term sideways range. The key trading level at 940.00 will play a crucial role in determining the next directional move.
Key Levels to Watch
Resistance Levels: 1,120, 1,217, 1,320, 1,374
Support Levels: 859.00, 816.00
Bearish Scenario
If LTCUSD fails to bounce back from 940.00 and faces rejection, a downside move could emerge. A sustained decline below this level may trigger selling pressure, targeting 859, followed by a potential retest of the 816.00 psychological support over the longer timeframe.
Bullish Scenario
A decisive bounce back from the 940.00 support level, confirmed by a daily close higher, would shift sentiment toward a bullish outlook. This could open the way for further gains, with upside targets at 1,120, followed by 1,217 and1,274 in an extended rally.
Conclusion
LTCUSD is currently consolidating within a neutral range, with 940.00 acting as a key pivot level. A rejection from this zone could reinforce bearish pressure, while a breakout above 1,120 could confirm bullish momentum. Traders should monitor these levels for confirmation of the next move.
This communication is for informational purposes only and should not be viewed as any form of recommendation as to a particular course of action or as investment advice. It is not intended as an offer or solicitation for the purchase or sale of any financial instrument or as an official confirmation of any transaction. Opinions, estimates and assumptions expressed herein are made as of the date of this communication and are subject to change without notice. This communication has been prepared based upon information, including market prices, data and other information, believed to be reliable; however, Trade Nation does not warrant its completeness or accuracy. All market prices and market data contained in or attached to this communication are indicative and subject to change without notice.

LTCUSD The Week Ahead 10th March '25Litecoin (LTCUSD) remains in a neutral stance, as price action continues to trade within a longer-term sideways range. The key trading level at 960.00 will play a crucial role in determining the next directional move.
Key Levels to Watch
Resistance Levels: 1,120, 1,217, 1,320, 1,374
Support Levels: 859.00, 816.00
Bearish Scenario
If LTCUSD fails to bounce back from 960.00 and faces rejection, a downside move could emerge. A sustained decline below this level may trigger selling pressure, targeting 859, followed by a potential retest of the 816.00 psychological support over the longer timeframe.
Bullish Scenario
A decisive bounce back from the 960.00 support level, confirmed by a daily close higher, would shift sentiment toward a bullish outlook. This could open the way for further gains, with upside targets at 1,120, followed by 1,217 and1,274 in an extended rally.
Conclusion
LTCUSD is currently consolidating within a neutral range, with 960.00 acting as a key pivot level. A rejection from this zone could reinforce bearish pressure, while a breakout above 1,120 could confirm bullish momentum. Traders should monitor these levels for confirmation of the next move.
This communication is for informational purposes only and should not be viewed as any form of recommendation as to a particular course of action or as investment advice. It is not intended as an offer or solicitation for the purchase or sale of any financial instrument or as an official confirmation of any transaction. Opinions, estimates and assumptions expressed herein are made as of the date of this communication and are subject to change without notice. This communication has been prepared based upon information, including market prices, data and other information, believed to be reliable; however, Trade Nation does not warrant its completeness or accuracy. All market prices and market data contained in or attached to this communication are indicative and subject to change without notice.

Short Term Could Drop Be Careful Here - Possible $100Some bad news came out. Bybit got hacked for a lot of Ethereum. How this happens I dont understand but more than likely an inside job. These run out a basement exchanges are dangerous never leave your crypto on an exchange, NONE OF THEM.
Anyways I dont like the break of this rising wedge or potential bear flag. If this deosnt break back into the wedge and close in it then we could se another drop to about 100 or so if the measured move plays out. Be cautious here.
Not Financial advice.

LTCUSDT 1WLTC ~ 1W Analysis
#LTC This support block continues to be maintained so far.
Buy gradually from here with a minimum target of 20%+.

LTCN Litecoin Grayscale Trust Cup & Handle Target $500LTCN has created a giant cup and handle pattern. If this measured move plays out which i believe it will we could a prior all time high at least. This is all dependent on what Litecoin will do obviously and if you read my in depth analysis you see that I believe Litecoin will be worth more than 10k in the coming years.
Grayscale has also filed to convert its Litecoin Grayscale Trust to an ETF, which will almost certainly happen. This is also why the price of LTCN has lost most of its premium and is coming down to its NAV price. LTCN will follow Litecoin to its NAV price from here on out more than likely so dont expect wild swings unless Litecoin makes wild swings.
There is a bearish scenario I must tell you about as well. The chart pattern you see is a cup and handle but also the triangle price action has been in since the pump is a descending triangle. Descending triangles are normally bearish. A break below the support line and a closure below would mean LTCN comes down to probably 3 to 6 dollars. This is highly unlikely unless the entire crypto market tanks and Litecoin comes down to 30 dollars. I dont see that happening but I thought I would point that out. There are instances where the descending triangle is bullish. This is probably one of them, where the price continues to bounce off the lower support line but fails to break through finding support and eventually breaking out of the triangle to the upside. There could be a false breakdown trapping short traders before the move up as well so dont be fooled. BBWP is indicating a sizeable move coming it just doesnt tell us what direction. From my analysis I believe its a 90% chance we break up.
This is not financial advice this is just my opinion. Follow me for more updates. Thank you and good luck my friends.

LTCUSD Support retest Litecoin (LTCUSD) remains in a neutral stance, as price action continues to trade within a longer-term sideways range. The key trading level at 960.00 will play a crucial role in determining the next directional move.
Key Levels to Watch
Resistance Levels: 1,120, 1,217, 1,320, 1,374
Support Levels: 859.00, 816.00
Bearish Scenario
If LTCUSD fails to bounce back from 960.00 and faces rejection, a downside move could emerge. A sustained decline below this level may trigger selling pressure, targeting 859, followed by a potential retest of the 816.00 psychological support over the longer timeframe.
Bullish Scenario
A decisive bounce back from the 960.00 support level, confirmed by a daily close higher, would shift sentiment toward a bullish outlook. This could open the way for further gains, with upside targets at 1,120, followed by 1,217 and1,274 in an extended rally.
Conclusion
LTCUSD is currently consolidating within a neutral range, with 960.00 acting as a key pivot level. A rejection from this zone could reinforce bearish pressure, while a breakout above 1,120 could confirm bullish momentum. Traders should monitor these levels for confirmation of the next move.
This communication is for informational purposes only and should not be viewed as any form of recommendation as to a particular course of action or as investment advice. It is not intended as an offer or solicitation for the purchase or sale of any financial instrument or as an official confirmation of any transaction. Opinions, estimates and assumptions expressed herein are made as of the date of this communication and are subject to change without notice. This communication has been prepared based upon information, including market prices, data and other information, believed to be reliable; however, Trade Nation does not warrant its completeness or accuracy. All market prices and market data contained in or attached to this communication are indicative and subject to change without notice.

LTC Litecoin Could Do One More Round Of Bouncing Within WedgeThis is a possible scenario here. This is in line format not candles so wicks could be lower than than this. Lines remove all the wicks and are just on an open and close basis, kind of cleaning up the noise. This is not guaranteed to happen but it is a possible scenario before we break out again around the end of March. I'll post below a candle chart as well so you can see those levels. As long as we stay within this wedge on a closing basis and within the channel on the candle format then we should be fine. If we break down below the wedge or channel and close below it then thats not going to be very good. I don't see this happening thats just worst case scenario.
Follow me for more updates. Not financial advice. Thank you

LTCUSD Key Levels The Week Ahead 03rd March ‘25Litecoin (LTCUSD) remains in a neutral stance, as price action continues to trade within a longer-term sideways range. The key trading level at 1,140 will play a crucial role in determining the next directional move.
Key Levels to Watch
Resistance Levels: 1,140, 1,395, 1,523, 1,709
Support Levels: 1,082, 1,000
Bearish Scenario
If LTCUSD fails to break above 1,140 and faces rejection, a downside move could emerge. A sustained decline below this level may trigger selling pressure, targeting 1,082, followed by a potential retest of the 1,000 psychological support over the longer timeframe.
Bullish Scenario
A decisive breakout above the 1,395 resistance level, confirmed by a daily close, would shift sentiment toward a bullish outlook. This could open the way for further gains, with upside targets at 1,523, followed by 1,709 in an extended rally.
Conclusion
LTCUSD is currently consolidating within a neutral range, with 1,140 acting as a key pivot level. A rejection from this zone could reinforce bearish pressure, while a breakout above 1,395 could confirm bullish momentum. Traders should monitor these levels for confirmation of the next move.
This communication is for informational purposes only and should not be viewed as any form of recommendation as to a particular course of action or as investment advice. It is not intended as an offer or solicitation for the purchase or sale of any financial instrument or as an official confirmation of any transaction. Opinions, estimates and assumptions expressed herein are made as of the date of this communication and are subject to change without notice. This communication has been prepared based upon information, including market prices, data and other information, believed to be reliable; however, Trade Nation does not warrant its completeness or accuracy. All market prices and market data contained in or attached to this communication are indicative and subject to change without notice.

LTC/USDTDespte the market correction Ltc$ held up really well. with almost 100 days of cosolidation in this price range.
Entry:$130-$120
Target: $200-$300

The key is to rise near 134.91
Hello, traders.
If you "Follow", you can always get new information quickly.
Please also click "Boost".
Have a nice day today.
-------------------------------------
(LTCUSDT 1M chart)
The key is to maintain the price above the M-Signal indicator on the 1M chart and rise above 163.89.
-
(1W chart)
Since the M-Signal on the 1W chart > M-Signal on the 1M chart has changed, if the price maintains above the M-Signal indicator on the 1W chart, it is expected to maintain an upward trend.
Accordingly, the key is whether it can maintain the uptrend by receiving support near 95.73-102.34.
-
(1D chart)
In order to maintain the uptrend, the key is whether it can maintain the price by rising above the Fibonacci ratio point of 0.618 (133.53).
If not,
1st: 113.39-117.30
2nd: 95.73-102.34
We need to look at whether it receives support near the 1st and 2nd points above.
Based on the current price position, I think the start of a full-scale uptrend is likely to begin when it rises above the HA-High indicator point of 163.89 on the 1M chart.
-
Thank you for reading to the end.
I hope you have a successful trade.
--------------------------------------------------
- Big picture
I used TradingView's INDEX chart to check the entire range of BTC.
(BTCUSD 12M chart)
Looking at the big picture, it seems to have been maintaining an upward trend following a pattern since 2015.
In other words, it is a pattern that maintains a 3-year upward trend and faces a 1-year downward trend.
Accordingly, the upward trend is expected to continue until 2025.
-
(LOG chart)
Looking at the LOG chart, you can see that the upward trend is decreasing.
Accordingly, the 46K-48K range is expected to be a very important support and resistance range from a long-term perspective.
Therefore, I expect that we will not see prices below 44K-48K in the future.
-
The Fibonacci ratio on the left is the Fibonacci ratio of the uptrend that started in 2015.
That is, the Fibonacci ratio of the first wave of the uptrend.
The Fibonacci ratio on the right is the Fibonacci ratio of the uptrend that started in 2019.
Therefore, this Fibonacci ratio is expected to be used until 2026.
-
No matter what anyone says, the chart has already been created and is already moving.
It is up to you how to view and respond to it.
Since there is no support or resistance point when the ATH is updated, the Fibonacci ratio can be appropriately utilized.
However, although the Fibonacci ratio is useful for chart analysis, it is ambiguous to use it as a support and resistance role.
The reason is that the user must directly select the important selection points required to create the Fibonacci.
Therefore, it can be useful for chart analysis because it is expressed differently depending on how the user specifies the selection point, but it can be seen as ambiguous for use in trading strategies.
1st: 44234.54
2nd: 61383.23
3rd: 89126.41
101875.70-106275.10 (when overshooting)
4th: 134018.28
151166.97-157451.83 (when overshooting)
5th: 178910.15
-----------------
