LTC Trade Zones: Short or Long?LTC has been making some moves recently, with a solid rise getting close to a key high. But the current price action hints at an ABC corrective structure, so a pullback could be on the way.
Short Setup:
Entry: Between the 0.618 and 0.786 Fibonacci retracement of the current wave
Stop Loss: $141.4 (the previous high)
Target: $130.7
R:R: About 2:1
Long Setup:
Entry: Around $130, with confirmation
Stop Loss: $126.45
Targets:
First at $134
Second at $147 (the key high)
R:R: A nice 5:1 potential
Why These Levels?
The $130 support zone lines up with the 1:1 Trend-Based Fibonacci Extension ($130.29)
It’s also near a previous swing high, adding more weight to it as a strong level
Plan:
If price moves into the retracement zone, a short trade targeting $130 makes sense
If it hits the $130 support and shows strength, a long setup targeting $134 and $147 could be a great play
LTCUSD

Can LTC break major 145$ Resistance after a retest of 125-128$It looks like the worst is behind us on COINBASE:LTCUSD and it's preparing for its big cycle move with many altcoins following the same path. The down trend of lower highs and lower lows has been broken with conviction, the DPO on the daily is positive (Historically when that happens, LTC breaks ATH) and now all is left is a good entry! In your opinion, where do you think this market wide pullback can extend for LTC before we see a break of the major resistance at 145$ ??
COINBASE:LTCUSD BITSTAMP:BTCUSD CRYPTOCAP:TOTAL3

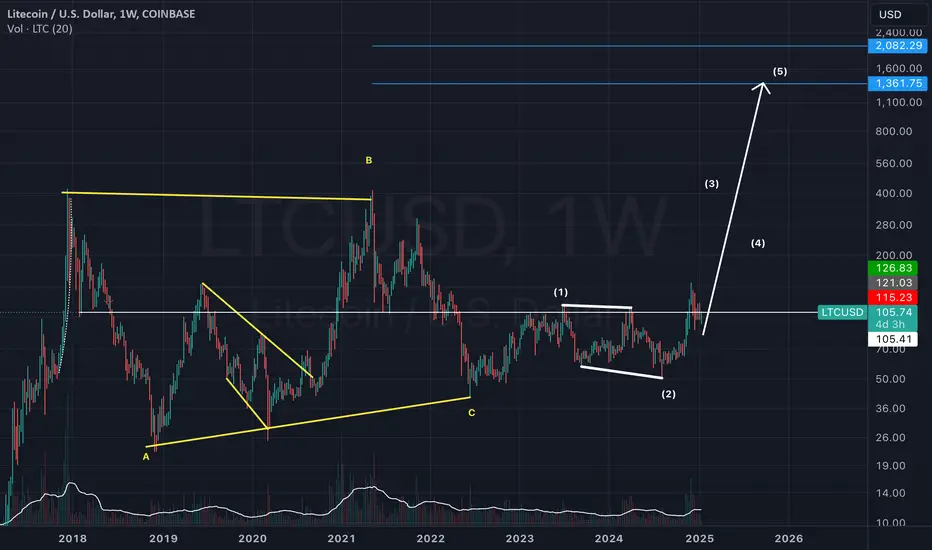
Litecoin Breakout: Potential Gains and ProfitsAlright, let’s talk about Litecoin and why I think it’s gearing up for something big. The market's been showing solid gains across the altcoin sector , and Litecoin is definitely catching my eye right now.
Here’s the deal: the LTCBTC pair looks like it’s finally bottomed out and is breaking out of a two-year downtrend line . If that sounds familiar, it’s because we’ve seen this before. Back in 2017 , Litecoin broke out of a similar downtrend, and the result? LTCUSD skyrocketed from $8 to $365 in just a year .
Fast forward to today — 2023 and 2024 have been all about consolidation in the $100–$47 range . Now that we’ve broken through $135 , 2025 could be a massive year for Litecoin. My main target is $365 , but I’ve got my eye on some optional targets at $630 and even $1,300 .
Why those higher targets?
Simple. Looking at how the LTCBTC pair has performed in the past, even a small upward move there has historically triggered huge gains in LTCUSDT .
Now, let’s break it down further.
Litecoin’s price history shows recurring patterns — ascending triangles from 2015 to 2017 and now again from 2018 to 2025 . And these patterns play out in phases:
🔴 Downtrend
🟡 Consolidation
🟢 Breakout
We’ve already seen this cycle happen three times — 2014 to 2018 , 2018 to 2021 , and now 2021 to 2025 . It’s all lining up again.
The key now is to watch the details . Resistance levels, price action , and how the breakout unfolds will be crucial. If Litecoin follows through, it could be gearing up for a move that redefines its place in the market .
Stay tuned — this could get really exciting.🍻
Some of past LTC charts:

Long idea on $LTCI think the daily altcoin will follow Bitcoin, which will give a good opportunity to take a long from low values, risk 1 to 8

LTC possible playout!LTC / USDT
Chart looks the same like XRP just before the major move in November (broke out major accumulation phase and retested )
This is a possible playout in coming days/weeks
Keep ur eye on it

Litecoin Joins ETF Race, Boosting Market OptimismLitecoin (LTC), one of the earliest and most established cryptocurrencies, has recently entered the burgeoning race for a spot Bitcoin ETF, mirroring similar efforts in other cryptocurrencies like XRP. This development, coupled with growing community support for Lightchain AI following the rollout of ETF trading features, has ignited renewed interest and bullish sentiment in the Litecoin market. Canary Capital's recent Litecoin ETF filing has sparked a market rally, coinciding with a period of anticipated leadership change at the Securities and Exchange Commission (SEC).1 This article explores these developments, analyzing their potential impact on Litecoin's price and its position within the broader cryptocurrency ecosystem.
Litecoin Joins the ETF Race: A Sign of Maturing Market
The filing for a Litecoin ETF marks a significant step in the cryptocurrency's evolution. Exchange-Traded Funds (ETFs) offer investors a regulated and accessible way to gain exposure to an asset without directly holding it.2 The potential approval of a Litecoin ETF could open the door to a wider range of institutional and retail investors, driving increased demand and liquidity for LTC.
This move mirrors the ongoing efforts to establish a spot Bitcoin ETF and recent developments surrounding XRP. The pursuit of ETFs for various cryptocurrencies reflects a growing acceptance of digital assets within traditional financial markets. It also signals a maturing market, with increasing regulatory scrutiny and the development of more sophisticated investment vehicles.
Canary Capital's Filing and Market Reaction
Canary Capital's filing for a Litecoin ETF has been a catalyst for positive market movement.3 The announcement triggered a noticeable price rally for LTC, demonstrating the market's anticipation of potential ETF approval. This reaction highlights the significant impact that regulatory developments and institutional adoption can have on cryptocurrency valuations.
The timing of Canary Capital's filing is also noteworthy, coinciding with anticipated leadership changes at the SEC. This transition could potentially lead to a shift in regulatory approach towards cryptocurrencies, potentially creating a more favorable environment for ETF approvals.
Lightchain AI and ETF Trading Features: Enhancing Litecoin's Ecosystem
The development and growing community support for Lightchain AI, particularly following the rollout of ETF trading features, further strengthens Litecoin's position. Lightchain AI aims to enhance Litecoin's functionality and scalability, potentially addressing some of the network's limitations.
The integration of ETF trading features within the Litecoin ecosystem provides users with more convenient access to ETF-related products and services. This integration can further drive adoption and usage of Litecoin, particularly among investors interested in participating in the ETF market.
Technical Analysis: Trading Above the 20-Day MA
From a technical analysis perspective, Litecoin trading above its 20-day moving average (MA) is generally considered a positive signal. The 20-day MA is a widely used indicator that tracks the average price of an asset over the past 20 trading days.4 When the price crosses above this average, it can suggest a shift in momentum from bearish to bullish.
This technical indicator, combined with the fundamental developments surrounding ETFs and Lightchain AI, paints a more comprehensive picture of Litecoin's current market position.
Challenges and Considerations
Despite the positive developments, Litecoin still faces challenges. The SEC's stance on cryptocurrency ETFs remains a significant hurdle. The regulatory landscape for digital assets is still evolving, and there is no guarantee that a Litecoin ETF will be approved.
Competition from other cryptocurrencies also poses a challenge. While Litecoin has the advantage of being one of the earliest cryptocurrencies, it faces competition from newer and more innovative projects.5
Long LTC: A Bullish Perspective
The phrase "Long LTC" expresses a bullish sentiment towards Litecoin, suggesting a belief that the cryptocurrency's price will rise in the future. This sentiment is supported by several factors, including the potential for ETF approval, the development of Lightchain AI, and positive technical indicators.
However, it's crucial to remember that investing in cryptocurrencies is inherently risky. Market volatility, regulatory uncertainty, and technological developments can all impact the price of digital assets.
Conclusion
Litecoin's entry into the ETF race, coupled with community support for Lightchain AI and positive technical indicators, has generated significant excitement within the market. Canary Capital's ETF filing and the anticipated SEC leadership change have further fueled this momentum. While challenges remain, the combination of these factors suggests a positive outlook for Litecoin. The potential approval of a Litecoin ETF could mark a turning point for the cryptocurrency, opening it up to a wider audience and solidifying its place within the evolving financial landscape. As always, investors should conduct thorough research and exercise caution when investing in cryptocurrencies.

LTCUSDT: Active Buyers and Key Blue Box Opportunities!LTCUSDT Analysis Active Buyers and Ideal Short-Term Reaction Zones
Buyers are highly active in LTCUSDT, and I’ve identified levels within the blue boxes for potential entries.
Highlights:
Blue Box Levels: Carefully chosen zones where short-term reactions of 10-20% are possible.
Short-Term vs. Long-Term Outlook: While my high time frame expectation leans towards lower levels, these zones are excellent for short-term trades.
Confirmation: Always wait for upward breaks in lower time frames, supported by CDV, volume profile, and other key data points.
Key Observations:
"The blue boxes are very carefully picked using volume footprint, volume profile, cumulative delta volume, and liquidity heatmap. When trading this zone, I will look for buyers and upward market structure breaks in lower time frames for confirmation."
This setup offers an excellent opportunity for short-term traders. As always, stay disciplined and let the data confirm your entries! 🚀
Let me tell you, this is something special. These insights, these setups—they’re not just good; they’re game-changers. I've spent years refining my approach, and the results speak for themselves. People are always asking, "How do you spot these opportunities?" It’s simple: experience, clarity, and a focus on high-probability moves.
Want to know how I use heatmaps, cumulative volume delta, and volume footprint techniques to find demand zones with precision? I’m happy to share—just send me a message. No cost, no catch. I believe in helping people make smarter decisions.
Here are some of my recent analyses. Each one highlights key opportunities:
🚀 RENDERUSDT: Strategic Support Zones at the Blue Boxes +%45 Reaction
🎯 PUNDIXUSDT: Huge Opportunity | 250% Volume Spike - %60 Reaction Sniper Entry
🌐 CryptoMarkets TOTAL2: Support Zone
🚀 GMTUSDT: %35 FAST REJECTION FROM THE RED BOX
🎯 ZENUSDT.P: Patience & Profitability | %230 Reaction from the Sniper Entry
🎯 DEXEUSDT %180 Reaction with %9 Stop
🐶 DOGEUSDT.P: Next Move
🎨 RENDERUSDT.P: Opportunity of the Month
💎 ETHUSDT.P: Where to Retrace
🟢 BNBUSDT.P: Potential Surge
📊 BTC Dominance: Reaction Zone
🌊 WAVESUSDT.P: Demand Zone Potential
🟣 UNIUSDT.P: Long-Term Trade
🔵 XRPUSDT.P: Entry Zones
🔗 LINKUSDT.P: Follow The River
📈 BTCUSDT.P: Two Key Demand Zones
🟩 POLUSDT: Bullish Momentum
🌟 PENDLEUSDT.P: Where Opportunity Meets Precision
🔥 BTCUSDT.P: Liquidation of Highly Leveraged Longs
🌊 SOLUSDT.P: SOL's Dip - Your Opportunity
🐸 1000PEPEUSDT.P: Prime Bounce Zone Unlocked
🚀 ETHUSDT.P: Set to Explode - Don't Miss This Game Changer
🤖 IQUSDT: Smart Plan
⚡️ PONDUSDT: A Trade Not Taken Is Better Than a Losing One
💼 STMXUSDT: 2 Buying Areas
🐢 TURBOUSDT: Buy Zones and Buyer Presence
🌍 ICPUSDT.P: Massive Upside Potential | Check the Trade Update For Seeing Results
🟠 IDEXUSDT: Spot Buy Area | %26 Profit if You Trade with MSB
📌 USUALUSDT: Buyers Are Active + %70 Profit in Total
🌟 FORTHUSDT: Sniper Entry +%26 Reaction
🐳 QKCUSDT: Sniper Entry +%57 Reaction
📊 BTC.D: Retest of Key Area Highly Likely
This list? It’s just a small piece of what I’ve been working on. There’s so much more. Go check my profile, see the results for yourself. My goal is simple: provide value and help you win. If you’ve got questions, I’ve got answers. Let’s get to work!

#LTC/USDT #LTC
The price is moving in a descending channel on the 1-hour frame and is expected to continue upwards
We have a trend to stabilize above the moving average 100 again
We have a descending trend on the RSI indicator that supports the rise by breaking it upwards
We have a support area at the lower limit of the channel at a price of 110
Entry price 112
First target 114
Second target 116
Third target 120

LTC Breaking above tan invh&s neckline, right on goldencrossI have the weekly chart timeframe selected here simply because I needed to expand the timeframe on the chart to be able to fit both inverse head and shoulders patterns and their respective breakout targets in the frame. Wanted to put the timeframe on the daily chart so. Could show once again how these recent crypto pumps have all being launching on the exact day that the Daly golden cross occurs. I will post. Daily chart version of this as well that zooms in on the golden cross and subsequent priceaction and link it below. Anyways it looks like on this 2nd breach above the tan neckline that Litecoin is likely to finally trigger a breakout ths go around. If so the highest measured move target is in the $170s here, and reaching it will obviously also allow us to hit the white inverse head and shoulders breakout target too on the way there. In order to ensure that price acton doesn’t dip back below the tan neckline for a second time, it will need to flip the weekly 200ma(blue line) to solidified support once that happens I think it will definitely confirm the breakout at that point. Alt season has officially began! *not financial advice*

LTC about to complete right shoulder right @ the golden crossIf Litecoin’s price action reacts the same to its golden cross as many other crypto charts have recently, we will likely see Litecoin rise above the invh&s neckline i the coming days. A confirmed breakout from the invh&s has a breakout target of around $173. *not financial advice*

Nobody appreciates it !!!The price will reach the top of triangle = $111 in the short term.
Give me some energy !!
✨We spend hours finding potential opportunities and writing useful ideas, we would be happy if you support us.
Best regards CobraVanguard.💚
_ _ _ _ __ _ _ _ _ _ _ _ _ _ _ _ _ _ _ _ _ _ _ _ _ _ _ _ _ _ _ _
✅Thank you, and for more ideas, hit ❤️Like❤️ and 🌟Follow🌟!
⚠️Things can change...
The markets are always changing and even with all these signals, the market changes tend to be strong and fast!!

LTCUSD - first low price for purchase and then...Certain arguments will certainly make a difference, but they are unlikely to change the course.

LTC/USDT Short-Term Breakout Confirmed !LTC/USDT has broken above a key descending trendline resistance, signaling a bullish breakout. The price is now retesting the $115-$116 zone, flipping it into support. A successful hold above this level could lead to a rally toward the next resistance at $140-$147. Traders should monitor the $100-$105 support zone in case of a pullback. This breakout shows strong potential for upward momentum in the short term.

LiteCoin: $LTC - Set to Rocket - Are You Ready? 96% UpsideCHARTURDAY - CRYPTOCAP:LTC COINBASE:LTCUSD
Litecoin is right where their supposed to be!
-H5 is red (Barely, only one thing is negative under the hood)
-Williams CB is thriving
-Falling wedge breakout-retest-higher!
-Volume shelf with GAP
-Crypto seems to be back up-trending
🎯$135🎯$193
Not financial advice

LTC/USDT "Litecoin vs Tether" Crypto Market Bullish Heist Plan🌟Hi! Hola! Ola! Bonjour! Hallo!🌟
Dear Money Makers & Robbers, 🤑 💰
Based on 🔥Thief Trading style technical and fundamental analysis🔥, here is our master plan to heist the LTC/USDT "Litecoin vs Tether" Crypto market. Please adhere to the strategy I've outlined in the chart, which emphasizes long entry. Our aim is the high-risk Red Zone. Risky level, overbought market, consolidation, trend reversal, trap at the level where traders and bearish robbers are stronger. Be wealthy and safe trade.💪🏆🎉
Entry 📈 : You can enter a Bull trade after the breakout of Resistance Level.
however I advise placing Buy limit orders within a 15 or 30 minute timeframe. Entry from the most recent or closest low or high level should be in retest.
Stop Loss 🛑: Using the 2H period, the recent / nearest low or high level.
Goal 🎯: 120.00
Scalpers, take note 👀 : only scalp on the Long side. If you have a lot of money, you can go straight away; if not, you can join swing traders and carry out the robbery plan. Use trailing SL to safeguard your money 💰.
Warning⚠️ : Our heist strategy is incompatible with Fundamental Analysis news 📰 🗞️. We'll wreck our plan by smashing the Stop Loss 🚫🚏. Avoid entering the market right after the news release.
Fundamental Outlook 📰🗞️
Based on the fundamental analysis, I would conclude that the LTC/USDT (Litecoin/Tether) pair is: Bullish
Reasons:
Adoption and usage: Increasing adoption and usage of Litecoin, particularly in the payments and e-commerce sectors, could drive up demand and price.
Technological advancements: Ongoing technological advancements, such as the implementation of the MimbleWimble protocol, could improve the scalability, security, and usability of the Litecoin network.
Halving event: The upcoming halving event, which reduces the block reward from 25 LTC to 12.5 LTC, could lead to a decrease in supply and increase in price.
Market sentiment: A shift in market sentiment, particularly among institutional investors and traders, could drive up demand and price.
However, it's essential to consider the following risks:
Regulatory uncertainty: Uncertainty and potential regulatory changes, particularly in the US and China, could negatively impact the price of Litecoin.
Competition from other cryptocurrencies: Increasing competition from other cryptocurrencies, particularly those with similar use cases and technological advancements, could negatively impact the price of Litecoin.
Security concerns: Security concerns, such as the potential for 51% attacks or other vulnerabilities, could negatively impact the price of Litecoin.
Bullish Scenario:
Increasing adoption and usage of Litecoin, particularly in the payments and e-commerce sectors, drives up demand and price
Technological advancements, such as the implementation of the MimbleWimble protocol, improve the scalability, security, and usability of the Litecoin network
Please note that this is a general analysis and not personalized investment advice. It's essential to consider your own risk tolerance and market analysis before making any investment decisions.
Take advantage of the target and get away 🎯 Swing Traders Please reserve the half amount of money and watch for the next dynamic level or order block breakout. Once it is resolved, we can go on to the next new target in our heist plan.
Keep in mind that these factors can change rapidly, and it's essential to stay up-to-date with market developments and adjust your analysis accordingly.
💖Supporting our robbery plan will enable us to effortlessly make and steal money 💰💵 Tell your friends, Colleagues and family to follow, like, and share. Boost the strength of our robbery team. Every day in this market make money with ease by using the Thief Trading Style.🏆💪🤝❤️🎉🚀
I'll see you soon with another heist plan, so stay tuned 🫂

I think LTC will bottom sooner rather than later.Even if Litecoin dips slightly lower in the near future, I believe it will bottom out very soon and begin a significant bull market. This could mirror the events of 2017.
Stay profitable,
Dalin Anderson

LTC is about To do a Bullish movement!The price can increase again from here and rise up to the measured move.
Give me some energy !!
✨We spend hours finding potential opportunities and writing useful ideas, we would be happy if you support us.
Best regards CobraVanguard.💚
_ _ _ _ __ _ _ _ _ _ _ _ _ _ _ _ _ _ _ _ _ _ _ _ _ _ _ _ _ _ _ _
✅Thank you, and for more ideas, hit ❤️Like❤️ and 🌟Follow🌟!
⚠️Things can change...
The markets are always changing and even with all these signals, the market changes tend to be strong and fast!!

LTCUSD - Price Likely To Fall Under $10...AriasWave enables me to make informed assumptions about future price movements, which is precisely why I developed it.
In contrast, relying on Elliott Wave is more likely to cost you money.
In this video, I explain why I believe this crypto could soon be available at a bargain price, offering a potential buying opportunity.
This isn’t financial advice—it’s simply what I would consider doing if prices dropped this low. If you’re convinced it’s heading straight to the moon, I suggest studying the waves to reassess once reality proves otherwise.

LTC/USDT Trading Scenario UpdateAgainst the backdrop of overall optimism in the cryptocurrency market during November and early December, LTC showed confident growth, reaching a price level of $147.32. This was followed by a correction exceeding 40%.
Interestingly, the asset's price retraced and rebounded from the upper boundary of a consolidation range that has persisted for over two years. This range has become an accumulation zone for a significant number of participants and continues to attract new ones, as LTC is trading in close proximity to this level.
Given the current dynamics, further developments in the altcoin market could be anticipated, with the potential for a strong upward trend and a possible multi-fold growth.

LTC | ALTCOINS | Sinking Ship? Verdict is inLTC has been a topic of many discussions during 2024, with the biggest question being around it's ability to reclaim past highs (and make a new ATH).
Similarly to UNI and ADA (to name a few), Litecoin has been unable to break out above it's immediate major resistance zones. This goes to show that there are bag-holders creating major supply zones. This is NOT GOOD for any coin, as it really damages it's potential for organic growth.
________________________
BINANCE:LTCUSDT

LTCUSDT 1WLTC Update ~ 1W
#LTC Retesting this support Block,. buy gradually inside this support block,. Minimum target 20%+ from here.

LTCUSDT 5DLTC ~ 5D
#LTC So far it still maintains this support Block. If you still have Conviction on this coin,. Buy gradually within this support block,. with a minimum target of 30%++
