LTC "W" Pattern Completed, May Go for CorrectionHello Dear Traders,
LTC performed great in this altseason, we also called it from 60, all Targets achieved in few weeks.
as u can see in chart LTC is facing heavy selling pressure form weekly supply zone.
Last week candle closed strong bearish and its indicating reversal frm here.
Also it successfully completed W Chart pattern, now its time for healthy correction towards 80-100$ again.
As we know Crypto is getting huge adoption worldwide, if something magical happens then only my idea of LTC will get invalidated.
Chart is clearly indicating next few weeks will be bearish.
Ltcusdanalysis

LTC chart analysis 6/03/21LTC can do both way. Its slow selling trend is not over yet but strong selling trend is over. Its strong first buying trend is over but second buying trend is not over.
FIRST BUYING TREND LINE
From first buying trend started on 1st feb and lasted till 23rd feb and on 23rd feb its daily candle closes below the trend line meaning buying trend is over. On the same day it went up from $157 to $173 and continued buying (high $205) till it touches the first trend line at $200 (on 25th feb) and then bounced back from that as it becomes resistance. so this strong buying trend is over as market fell by touching this trend line.
SECOND BUY TREND LINE
on 23rd feb it fell down from $208 to $157 and then it was bought from $157 to $205 and forming 2nd buying trend line. on 28th feb market went below this 2nd buying trend line all the way low $152 but closes above trend line showing that this trend line is still honored and continued its 2nd buying tend up to $196 in just 4 days giving 35% potential profit. now market is above this 2nd trend line.
FIRST SELLING TREND LINE
1st strong selling trend starts on 20th feb falling from $247 and continues till 28th feb touching $152 and on 1st march its first selling trend was over as daily candle closed above the selling trend line at $175 signaling that first selling trend is over and it is bought till touches $196.
SECOND SELLING TREND
Second selling trend starts on 4th march when it started selling from $196 to $168 on 5th march. now it is on the edge of 2nd selling trend line and 2nd buying trend. if it closes above this 2nd selling trend line than it can go to $203, $230 and last target will be $247 and if it closes bleow the 2nd trend ine then it can sell down to $162, $150 and final support will be $121.
FOLLOW THE CHART IF YOU WANT TO TRADE LTC.

LTCUSD - IHS, Short Target of </+ $160 USD, then Local High TestGood Evening,
After a bounce back from the recent local low, we are trending up some now. Selling pressure increased at the top of the neck line and prices are moving slowly back down. Normal process for the IHS and also a retest of the recent bull flag breakout.

$LTC - $LTCUSD - ROADMAP TO ~$1000 Litecoin Mimblewimble Event & other speculations will drive the price and ignite the continuation of Parabolic curve
Both $BTC & $ETH lost the momentum and currently under price discovery & in the bearish channel.
When $LTC pumping and $BTC & $ETH stagnant - Newbies, Grayscale or anyone which coin will they BUY?
FLARE airdrop to $LTC Holders
SPOILERS from Charlie Lee
etc.

LTC/USD entry levels LONGLitecoin created a nice channel. This should be easy to trade or enter for a better price.
ENTRY LEVELS LONG
$200
$182
$150
$125 STRONG BUY


LTC: Huge Bullish pattern (H and S)Head and shoulders pattern is unfolding right now with target price of 250$.

Litecoin want ATH LTC / USD
aiming at previous ATH
Last drop was very good retest at weekly demand in 185$-170$ area
I hope we hold weekly above that level so we can go to ATH soon and may be more++


LTCUSD support and resistance zone for buy longHi, here you are support zones for buy long levels
First good price for buy long is around 175$
Other prices are: 158, 152, 146$

LTCUSD ANALYSISPlease consider to put a like to my idea for supporting me & subscribe for more ideas.
Idea is not the financial advice!

LTC Ready to retest 180 $ Zone ?#LTC/USDT is one of the currencies that correlates with bitcoin, and I think it is slowly coming to end of retrace and can be held from the 130 $ - 105 $ steps ,and target is re-testing the heavy resistance of $ 180 in long term .
Buy Zone : 130 $ - 105 $
TP : 147 - 157 - 166 - 174 - 186 - 200 - 220
SL : Daily Close Below 100 $

Short uptrend formationIn case of pullback, the entry point is marked with an arrow. We expect to start the climb according to the time specified in the chart

LTC 12h Small correction up, and then down to $100Today's idea is to analyze the movement of the LTCUSDT price on a shorter timeframe within the framework of our global idea. We recommend that you re-read it now , and then come back here.
Two weeks have passed since the publication of the global idea, and what do we have? Now our expectations are being met and the LTCUSD price did not go above $168-170 , the high was $166, after which the price move down.
The most positive scenario for LTC that we see now is growth to $149-150.
After that, most likely, the price will move down to test the first liquidity zone of $97-100.
We have schematically showed the approximate price movement in the LTCUSDT pair for the next six months in a global idea , so like and comment , so that it will always catch up with you and remind you of itself.
And we will publish corrective ideas similar to today's one as the LTCUSD price moves.
_______________________________
Since 2016 , we have been analyzing and trading the cryptocurrency market.
We transform our knowledge, trading moods and experience into ideas. Each "like under the idea" boosts the level of our happiness by 0.05%. If we help you to be calmer and richer - help us to be happier :)

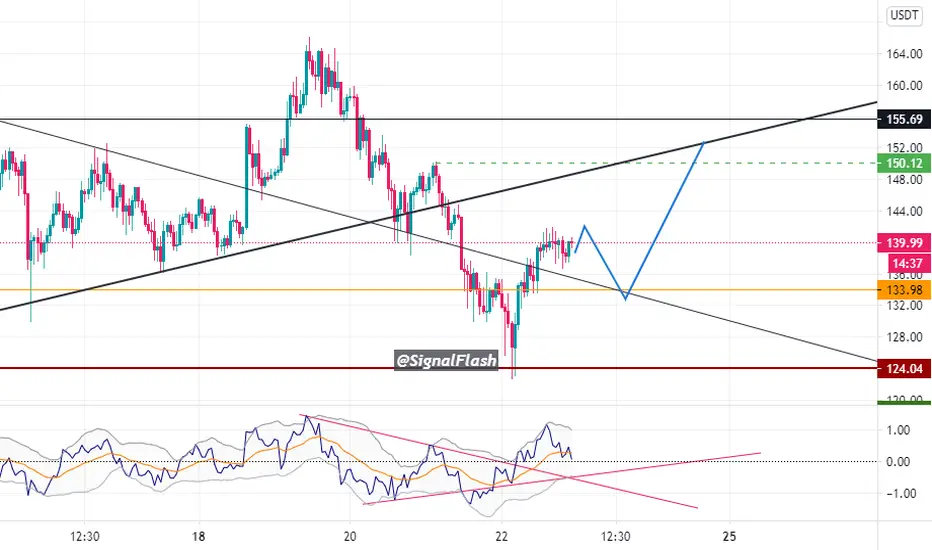
Get ready to climb back to $150Due to the growth of bitcoin dominance, the tools do not grow properly, according to our scenario, it seems to do a test to the broken trend and then climb to the resistance side.
As we expectedAs we expected, we have seen the price of ltc increase from a few hours ago, but at $ 144, the chart trend will probably reverse

LTC is likely going to break her ATHLTC has just 3 steps to re-test and also may break her All Time High this time...
Targets are lined in the chart...

LITECOIN Parabolic move - Will it reach 330.00 level (.786 Fibo)LITECOIN
On December 2017 year end Litecoin has visited the high level around 430.00 And seen a rapid selling from that level and the earlier 2000% gains were wiped out entirely and it has started its upward journey In 2018 December as we can see
the cycle repeats itself during the year end as its pumped around 500% which is a 25% of the previous year end jump.
And from January month onwards its again started to falling towards 25.00 level. And we can see that 25.00 level has acted as strong support for the bull. Since end of 2019 this level has not breached and bear failed at this level.
From October 2020 the parabolic move has stared and its still running and its has managed to reach 2019 high level which is 145.00 level and even LTCUSD has managed to break this level and the retest has also happened and went above the .382 Fibonacci retracement level. The next major key testing ground was 0.50 Fibonacci level comes around 220.00.
From this level we can see a profit taking scenario might happen and we can expect short term fall back towards 0.382 Fibonacci. If that happened it would be a nice buying opportunity.
The 50,100,200 EMA's are acting as good support for the bull and Ichimoku cloud is also supporting the bullish trend . In Bollinger band it has reached around upper side of the band short term fall back towards middle band was expected.
Disclaimer!
This is not a financial advice


