LTCUSD Multiple timeframe analysisHello traders, this is the full breakdown of this pair. We will take this trade if all the conditions are satisfied as discussed in the analysis. Smash the like button if you find value in this analysis and drop a comment if you have any questions or let me know which pair to cover in my next analysis.
Press the like button if you enjoy this content 😊
Ltcusdanalysis

Litecoin can rise above 70Since the 40 low made in mid-June, Litecoin has started to rise and made a high at 65.
For a month now the coin is trading in a range between that high and a low at 52 and with the lifted pressure from the crypto market this range can be broken to the upside.
In my opinion, dips under 60 should be bought in anticipation of an upbreak and continuation of the recent up reversal.
Bulls can target the resistance above 70 and negation of this scenario comes with a drop under rectangle's support

LTCUSD Multiple timeframe analysisHello traders, this is the full breakdown of this pair. We will take this trade if all the conditions are satisfied as discussed in the analysis. Smash the like button if you find value in this analysis and drop a comment if you have any questions or let me know which pair to cover in my next analysis.
Press like button if you enjoy this content 😊

Litecoin Prediction H1Here is my view for LTCUSD on H1. The price could go down, you can put a pending order on the Order block or find an entry on LTF within OB Zone. Trade Safe!

LTC : Approaching my Accumulation zoneI am planning to accumulate LTC Heavily around 28 and the support looks very strong there as well... LTC is severely undervalued when compared to other coins and i expect At least a 2000$ per coin.

Litecoin Prediction H1Here is my view for LTCUSD on H1. The price could go down, you can put a pending order on the Order block or find an entry on LTF within OB Zone. Trade Safe!

LTC: Buy breakLitecoin
Intraday - We look to Buy a break of 61.20 (stop at 59.11)
Trading within the Wedge formation. Trend line support is located at 60.00. Support could prove difficult to breakdown. A clear break of 61.00 and we would look for further gains to 66.00.
Our profit targets will be 65.94 and 68.00
Resistance: 66.00 / 75.00 / 95.00
Support: 60.00 / 44.00 / 20.00
Please be advised that the information presented on TradingView is provided to Vantage (‘Vantage Global Limited’, ‘we’) by a third-party provider (‘Signal Centre’). Please be reminded that you are solely responsible for the trading decisions on your account. There is a very high degree of risk involved in trading. Any information and/or content is intended entirely for research, educational and informational purposes only and does not constitute investment or consultation advice or investment strategy. The information is not tailored to the investment needs of any specific person and therefore does not involve a consideration of any of the investment objectives, financial situation or needs of any viewer that may receive it. Kindly also note that past performance is not a reliable indicator of future results. Actual results may differ materially from those anticipated in forward-looking or past performance statements. We assume no liability as to the accuracy or completeness of any of the information and/or content provided herein and the Company cannot be held responsible for any omission, mistake nor for any loss or damage including without limitation to any loss of profit which may arise from reliance on any information supplied by Signal Centre.

LTCUSDT 3D LTC buyers try to revive "ex-silver" cryptocurrencyLet's consider LTCUSDT today at 3 -day time frame
More than a year has lasted downtrend. And finally in June-July 2022 were increased trade volumes that indicate a meticulous struggle between buyers and sellers.
Increased trade volumes on a conditional bottom may indicate an attempt to turn the trend for growth.
However, Litecoin is an "old coin" and it is difficult to make sharp movements)
Therefore, we assume that the turn up, if it will be, can be smooth in the form of a cup.
In the coming days we allow correction the LTCUSD price to the area $55 , well, and further a new wave of growth can start to the area of $96-100 per LTC
_______________________________
Since 2016 , we have been analyzing and trading the cryptocurrency market.
We transform our knowledge, trading moods and experience into ideas. Each "like under the idea" boosts the level of our happiness by 0.05%. If we help you to be calmer and richer — help us to be happier :)

LTCUSD Prediction H1Here is my view for LTCUSD on H1. The price could go up, you can put a pending order on the Order block or find an entry on LTF within OB Zone. Trade Safe!

LTC: Buy dips!Litecoin
Intraday - We look to Buy at 61.12 (stop at 59.72)
Intraday signals are bullish. Dips continue to attract buyers. We can see no technical reason for a change of trend. Further upside is expected although we prefer to set longs at our bespoke support levels at 61.00, resulting in improved risk/reward.
Our profit targets will be 64.96 and 66.00
Resistance: 65.00 / 70.00 / 100.00
Support: 61.00 / 52.00 / 25.00
Please be advised that the information presented on TradingView is provided to Vantage (‘Vantage Global Limited’, ‘we’) by a third-party provider (‘Signal Centre’). Please be reminded that you are solely responsible for the trading decisions on your account. There is a very high degree of risk involved in trading. Any information and/or content is intended entirely for research, educational and informational purposes only and does not constitute investment or consultation advice or investment strategy. The information is not tailored to the investment needs of any specific person and therefore does not involve a consideration of any of the investment objectives, financial situation or needs of any viewer that may receive it. Kindly also note that past performance is not a reliable indicator of future results. Actual results may differ materially from those anticipated in forward-looking or past performance statements. We assume no liability as to the accuracy or completeness of any of the information and/or content provided herein and the Company cannot be held responsible for any omission, mistake nor for any loss or damage including without limitation to any loss of profit which may arise from reliance on any information supplied by Signal Centre.

LTC:Dips we buy!Litecoin
Intraday - We look to Buy at 60.09 (stop at 58.35)
Our bespoke resistance of 60.00 has been clearly broken. This is positive for sentiment and the uptrend has potential to return. Previous resistance at 60.00 now becomes support. Dip buying offers good risk/reward. Further upside is expected.
Our profit targets will be 63.97 and 65.00
Resistance: 64.00 / 72.00 / 96.00
Support: 60.00 / 48.00 / 30.00
Please be advised that the information presented on TradingView is provided to Vantage (‘Vantage Global Limited’, ‘we’) by a third-party provider (‘Signal Centre’) . Please be reminded that you are solely responsible for the trading decisions on your account. There is a very high degree of risk involved in trading. Any information and/or content is intended entirely for research, educational and informational purposes only and does not constitute investment or consultation advice or investment strategy. The information is not tailored to the investment needs of any specific person and therefore does not involve a consideration of any of the investment objectives, financial situation or needs of any viewer that may receive it. Kindly also note that past performance is not a reliable indicator of future results. Actual results may differ materially from those anticipated in forward-looking or past performance statements. We assume no liability as to the accuracy or completeness of any of the information and/or content provided herein and the Company cannot be held responsible for any omission, mistake nor for any loss or damage including without limitation to any loss of profit which may arise from reliance on any information supplied by Signal Centre.

LTCUSD Chart H4Here is my view for LTCUSD on H4. The price could go down, you can put a pending order on the Order block or find an entry on LTF within OB Zone. Trade Safe!

LTCUSD Idea H1Here is my view for LTCUSD on H1. The price could go up, you can put a pending order on the Order block or find an entry on LTF within OB Zone. Trade Safe!

LTC: Sell all rallies!!Litecoin
Intraday - We look to Sell at 51.40 (stop at 54.40)
Our short term bias remains negative. The trend of lower highs is located at 51.40. There is scope for mild buying at the open but gains should be limited. Preferred trade is to sell into rallies.
Our profit targets will be 40.35 and 35.00
Resistance: 51.40 / 53.98 / 56.14
Support: 46.41 / 41.60 / 40.30
Please be advised that the information presented on TradingView is provided to Vantage (‘Vantage Global Limited’, ‘we’) by a third-party provider (‘Signal Centre’ ). Please be reminded that you are solely responsible for the trading decisions on your account. There is a very high degree of risk involved in trading. Any information and/or content is intended entirely for research, educational and informational purposes only and does not constitute investment or consultation advice or investment strategy. The information is not tailored to the investment needs of any specific person and therefore does not involve a consideration of any of the investment objectives, financial situation or needs of any viewer that may receive it. Kindly also note that past performance is not a reliable indicator of future results. Actual results may differ materially from those anticipated in forward-looking or past performance statements. We assume no liability as to the accuracy or completeness of any of the information and/or content provided herein and the Company cannot be held responsible for any omission, mistake nor for any loss or damage including without limitation to any loss of profit which may arise from reliance on any information supplied by Signal Centre.

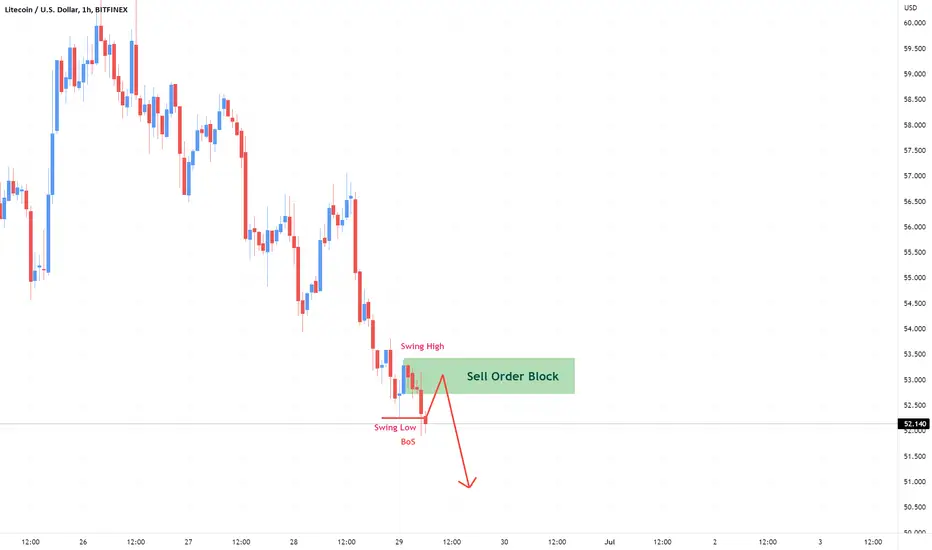
LTCUSD Idea H1Here is my view for LTCUSD on H1. The price could go down, you can put a pending order on the Order block or find an entry on LTF within OB Zone. Trade Safe!

$LTC updateAnother long opportunity
entry - (if it pullback 51, but 52 .1 is fine.)
tp - (53.67 green label on the right of the chart)
OR
(you can take on some extra risk and let it run to 54.2.. your choice)
SL - as always 3% or 5% of your entry.
Good luck!

LTC: No relief for crypto yet!Litecoin
Intraday - We look to Sell at 55.14 (stop at 56.15)
Previous resistance located at 55.00. The immediate bias is skewed to the upside but, with this move assessed as being corrective, we would prefer to sell into the rally. Choppy price action seen. Further downside is expected although we prefer to set shorts at our bespoke resistance levels at 55.00, resulting in improved risk/reward.
Our profit targets will be 52.72 and 41.01
Resistance: 55.00 / 58.50 / 74.00
Support: 50.00 / 44.00 / 41.61
Please be advised that the information presented on TradingView is provided to Vantage (‘Vantage Global Limited’, ‘we’) by a third-party provider (‘Signal Centre’) . Please be reminded that you are solely responsible for the trading decisions on your account. There is a very high degree of risk involved in trading. Any information and/or content is intended entirely for research, educational and informational purposes only and does not constitute investment or consultation advice or investment strategy. The information is not tailored to the investment needs of any specific person and therefore does not involve a consideration of any of the investment objectives, financial situation or needs of any viewer that may receive it. Kindly also note that past performance is not a reliable indicator of future results. Actual results may differ materially from those anticipated in forward-looking or past performance statements. We assume no liability as to the accuracy or completeness of any of the information and/or content provided herein and the Company cannot be held responsible for any omission, mistake nor for any loss or damage including without limitation to any loss of profit which may arise from reliance on any information supplied by Signal Centre.

LTC: Remains bearish!Litecoin
Intraday - We look to Sell at 50.54 (stop at 52.28)
A bearish Head and Shoulders has formed. Expect trading to remain mixed and volatile. A move through bespoke support at 49.60 and we look for extended losses. There is scope for mild buying at the open but gains should be limited.
Our profit targets will be 44.02 and 41.01
Resistance: 55.00 / 58.50 / 74.00
Support: 49.00 / 44.00 / 41.61
Please be advised that the information presented on TradingView is provided to Vantage (‘Vantage Global Limited’, ‘we’) by a third-party provider (‘Signal Centre’). Please be reminded that you are solely responsible for the trading decisions on your account. There is a very high degree of risk involved in trading. Any information and/or content is intended entirely for research, educational and informational purposes only and does not constitute investment or consultation advice or investment strategy. The information is not tailored to the investment needs of any specific person and therefore does not involve a consideration of any of the investment objectives, financial situation or needs of any viewer that may receive it. Kindly also note that past performance is not a reliable indicator of future results. Actual results may differ materially from those anticipated in forward-looking or past performance statements. We assume no liability as to the accuracy or completeness of any of the information and/or content provided herein and the Company cannot be held responsible for any omission, mistake nor for any loss or damage including without limitation to any loss of profit which may arise from reliance on any information supplied by Signal Centre.

Litecoin Idea H1Here is my view for LTCUSD on H1. The price could go down, you can put a pending order on the Order block or find an entry on LTF within OB Zone. Trade Safe!
Litecoin Idea H1Here is my view for LTCUSD on H1. The price could go up, you can put a pending order on the Order block or find an entry on LTF within OB Zone. Trade Safe!

Litecoin USD Chart H1Here is my view for LTCUSD on H1. The price could go down, you can put a pending order on the Order block or find an entry on LTF within OB Zone. Trade Safe!

LTC: Are all Cryptos turning bullish?Litecoin
Intraday - We look to Buy at 67.17 (stop at 65.18)
We look to buy dips. Previous support located at 65.00. A move lower faces tough support and we remain cautious on downside potential. Trading has been mixed and volatile. Previous resistance located at 74.00.
Our profit targets will be 73.16 and 85.00
Resistance: 74.00 / 82.70 / 88.00
Support: 67.00 / 65.50 / 61.00
Please be advised that the information presented on TradingView is provided to Vantage (‘Vantage Global Limited’, ‘we’) by a third-party provider (‘Signal Centre’). Please be reminded that you are solely responsible for the trading decisions on your account. There is a very high degree of risk involved in trading. Any information and/or content is intended entirely for research, educational and informational purposes only and does not constitute investment or consultation advice or investment strategy. The information is not tailored to the investment needs of any specific person and therefore does not involve a consideration of any of the investment objectives, financial situation or needs of any viewer that may receive it. Kindly also note that past performance is not a reliable indicator of future results. Actual results may differ materially from those anticipated in forward-looking or past performance statements. We assume no liability as to the accuracy or completeness of any of the information and/or content provided herein and the Company cannot be held responsible for any omission, mistake nor for any loss or damage including without limitation to any loss of profit which may arise from reliance on any information supplied by Signal Centre.

Litecoin Wallet H4Here is my view for LTCUSD on H4. The price could go down, you can put a pending order on the Order block or find an entry on LTF within OB Zone. Trade Safe!
