LTCUSD reversed from resistance, potential drop!
LTCUSD reversed off its resistance at 110.30 where it could potentially drop further to 49.31.
Trading CFDs on margin carries high risk.
Losses can exceed the initial investment so please ensure you fully
understand the risks.
Ltcusdidea

LTCUSD reversed from resistance, potential drop!
LTCUSD reversed off its resistance at 110.30 where it could potentially drop further to 49.31.
Trading CFDs on margin carries high risk.
Losses can exceed the initial investment so please ensure you fully
understand the risks.

Litecoin LONG Today only Pullback 1 HR Chart#Litecoin #Bitcoin #Ethereum #ETHUSD
Hello to all watching my charts
Today we have a normal pullback maybe to the breakout level of the
inverse head and shoulder formation which has beeen stablished and formed
yesterday (Please watch my black line here)
But nothing to worry about at the moment
What is to mention is, the best for long positions
is my black line holds as maximum pullback level down.
If that level will not hold, last exit would be at my blue line level.
Trading below that is critical for long not even short
but than it will be the really really "pay attention time" for longs.
Good trades
If you want to support my work and my trades, please like them..
Renkotrade

Litecoin LTCUSD LONG NOW 1 HR Chart 11.00 a.m. NYT#Litecoin #Bitcoin #Ethereum
Hello to all watching my charts
Impressive , what Litecoin is doing today.
Has build now a bullish SHS Formation (Shoulder/Head /Shoulder)
and is in a long way now.
Also has climbed above my long setup level from last post.
so has climbed above the major resistance BLACK LINE.
LONG NOW
Good trades
If you want to support my work and my charts please like them...
Renkotrade

LTCUSD Litecoin SHORT but Chance of Trendchange Long#Litecoin #Bitcoin # Ethereum
Hello to all watching may charts
After the desaster in crypto currencys of the last days
we do see here a small chance of a new shorttime long trend in
Litecoin which is little bit surpising as Bitcoin itself
f.e. is not such strong here at the moment.
We have seen a higher High, but to confirm
as this crypto is still in my shartchannel capted
i want to see a rebound to the "Long Confirmation" aerea first.
Good trades
If you want to support my work and my charts, pleasew like them...
Renkotrade

Litecoin LTHUSD SHORT All Supports Broken 1 HR Chart#Litecoin # Bitcoin #Ethereum #LTCUSD # BTCUSD
Hellot o all watching my charts.
Short is the game to play in all cryptos since some days.
I do hope you have followed ,my charts and have seen the sinals
yourself and are winning money.
Now one support after the other brakes , as i write that
next support have been broken.
Next Hold is 66 USD !!
Difficult to write that as the pair has traded as double
prices 1 week ago...
But only reality counts..
If you want to support my work and my charts please like the,
Good trades
Renkotrade
LTCUSD approaching resistance, look out for potential reversal!
LTCUSD is approaching its resistance at 109.23 where it is could reverse down to its support at 49.31.
Trading CFDs on margin carries high risk.
Losses can exceed the initial investment so please ensure you fully
understand the risks.

LTCUSD - LITECOIN - BIG BULL COMING SOONFREE ANALYSIS ON LTCUSD
Welcome to SiriusTrading (managed by Segunby), Check out my Free analysis on Forex and Crypto. Follow me for regular Analysis and don't forget to LIKE, LIKE, LIIIKKKEEE :)
Watch around 78.74 for buy
Big Bull move being set up.
Hidden Divergence on MACD

LTCUSD short & stop entry/exit -- following selloff; key sell ptFollowing massive selloff due to LTCUSD confirmations being much quicker than BTCUSD obv you'll see a consolidation on both coins yet for LTCUSD a short at $101.13 is viable & likely to occur within a 48-72 hour timeframe.
Safe trading all & Have a great evening.
Short @ $101.13
Stop listed as well.
Disclaimer
I've been wrong many times. This is my personal opinion. Do not listen to it. Though judging from my track record, you might believe otherwise. I've been right more than wrong but all that matters is that you make a wise investment decision based only off what you can afford and not solely off my opinion. You're presumably a grown man/woman and can make your own decisions.

An important crossroads to #Litecoin #LTCUSDThe first sign of a change in trend appeared 3 weeks ago in the form of a star candle (warning against a change in trend)
The positive point in this situation is the support of the solid Fibonacci retracement currently in place for Litecoin at the above price - $ 93.5
Scenario A-Because Litecoin at this moment touches the support above the next wave of rallies is on the way.
Scenario B-The recent gains were, in fact, a sign of the currency's demise, and the currency will continue to crash.

Litecoin SHORT Chance of Trendchange 1 HR Chart#Litecoin ##Bitcoin #Ethereum #Crypto
Hello to all watching my charts.
Today Litecoin tries to find a bottom at one of my support aereas
(Lower black lines)
but the confirmation is not there at the moment.
We do need a higher high and a jump to the BLUE ARROW AEAREA
Thats important, all other movements of Litecoin is simply
a bounce in the short trend for me.
Good trades
If you want to support my work and my charts, please like them ...
Renkotrade

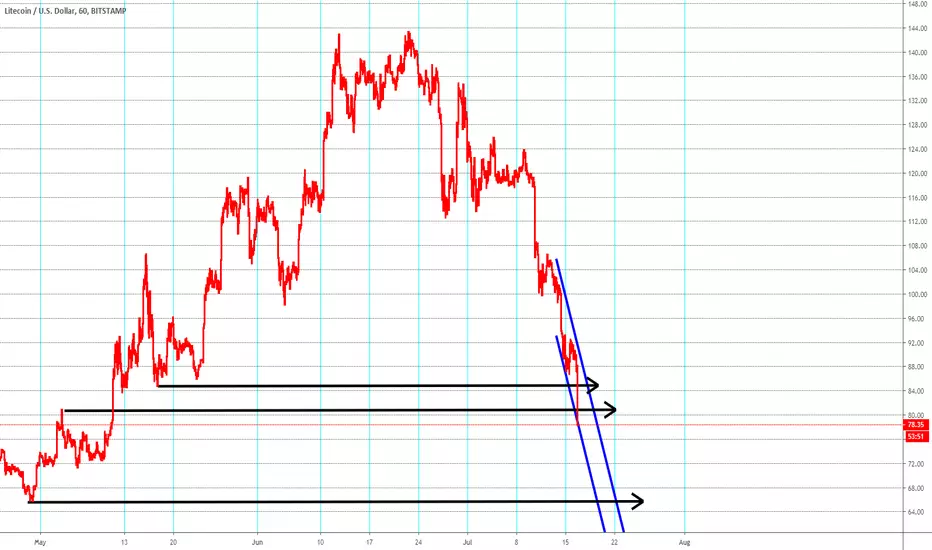
Litecoin SHORT 1 HR Chart#Litecoin #Bitoin #Ethereum #Crypto
Hello to all watching my charts
Litecoin shows us now really weakness the last
1,2 trading days
Broke the long blacktrendline support (my black line)
and is now middterm and shortterm in a shortchannel-
I have not added in the chart the shortest timeframe
cause ist totally enclosed in the blue lines middletimeframe
Short
I have added 2 support aereas from march/june
at 98 / 100 USD where it seems to be the pair find support now.
But dont mix that up with a long chance
It will change to LONG only after a jump to the aerea
where my BLUE ARROW is
so with a jump above the latest high at 108 USD
Good trades
If zou want to support mz charts and mz work please like them
Renkotrade

LTCUSD bounced from support, potential for a further rise!
LTCUSD bounced off its support at 114.20 where it could potentially rise further to 144.85.
Trading CFDs on margin carries high risk.
Losses can exceed the initial investment so please ensure you fully
understand the risks.

LTCUSD bounced from support, potential for a further rise!
LTCUSD bounced off its support at 114.20 where it could potentially rise further to 144.85.
Trading CFDs on margin carries high risk.
Losses can exceed the initial investment so please ensure you fully
understand the risks.

LTCUSD bounced from support, potential for a further rise!
LTCUSD bounced off its support at 114.20 where it could potentially rise further to 144.85.
Trading CFDs on margin carries high risk.
Losses can exceed the initial investment so please ensure you fully
understand the risks.

Litecoin LTCUSD UPDATE Trendchange to Short 6:00 p.m. 1 HR Chart#LTCUSD #Litecoin #Bitcoin #Ethereum #Rekotrade
Hello to all watching my charts
I just write these words here and same time LTCUSD Litecoin
has just fall out of my long channel in blue and sit on the last support line i have
drawn in black.
I daubt that the pair will recover soon and see a 60 to 40 chance
of falling further down
In best case we will have a sideways turn staying in my bluechannel which is
little bit long, but f you check the angle, these is very very weak
So be cautious with longs, i suggest NOT to buy on dips here
as we have lower lows and lower highs which in my oppionion
is a clear sign of short.
At the end, if it is fallen down to my purple arrow it is short shure
Good trades
If you want to support my work and my trade, please like them..
Renkotrade

Litecoin LTCUSD LONG 1 HR ChartHello to all watching my charts
Litecoin LTCUSD is similar to Bicoin at the moment on a run move long.
THe charts of these pair is much stronger than Ethereum ETHUSD
Both of my trendchannels are showing a long rund
AND the shorttime channel which shows us the next direction at first
is getting up an up, so showing us, that the long trend is very fine.
I do hope you are in a long position
-
-----
Here a additional info for all who ask me to draw other lines..
My channels shown here in the chart are NOT manual line draws from
high to high and low to low.
They are the resulat of a complex mathematical system, which is my personal
trading system, and they have different timeframes have also adjustable
different deviation in % from the actual price as forecast
ALSO they change the forecast ever TICK in Realtime and calculate the channels new.
-------
If you want to support my work and my charts, please like them..
Good trades
Renkotrade

LTCUSD reversed from resistance, potential drop!
LTCUSD reversed off its resistance at 142.12 where it could potentially drop further to 87.33.
Trading CFDs on margin carries high risk.
Losses can exceed the initial investment so please ensure you fully
understand the risks.

Litecoin LTCUSD NEUTRAL 1 HR Chart possible trendchange to Long#LTCUSD #BTCUSD #ETHUSD
Hello to all watching my charts.
Lets today have a new closer look to Litecoin LTCUSD
2 things are to mention
1. We are with both channels again in a short situation
2. At the moment i write this down we have a chance for a new setup
to long IF:
At first resistance 122.60 will be broken
(first resistance from yesterday post has been taken out
118.00 BUT than we unfortunatley have seen a fall with a lower low)
(my higher black line ) AND of course
we will not see any lower lows in the meanwhile
or in other words
The lower black line must hold.
And the blue trendline long which is little bit broken must be
entered to higher prices again.
I am afraid the last condition will be not set up
and the pair will stay in my short channel to lower prices.
Than next hold would be (low from yesterday) 113.00
and also lows from 28.6. at 112.00
below that we wil nee a nirvana..
Under the line: The Setup is very unclear.
If the pair will start to my blue arrow aerae of course
we wil be in long status again.
Good trades
If you want to support my work and my chaerts, please like them...
Renkotrade

Litecoin LTCUSD LONG in my very shortterm channel#Bitcoin #Ethereum #LTCUSD
Hello to all watching my charts
Nice situation here in Litecoin today
As showed yesterday we have made the move above 118.00
(you remember the arrow and my update ? )
and in the very very shortttime channel we re now in a long situalation
Now everthing depends on whether the support at 114.50
(lower black line) will hold or not.
IF ! it hold "stay long" or "go long" would be to shout
BUT be careful, the timechannel is extremly shorttimed
so the chance that it hold or not is even 50: 50
Will the low support fall, we will be back in short terratorium at once !.
Good trades
If you want to support my chart and my wokr, pleas like them
Renkotrade

LTCUSD SHORT Till MIN 112.20 or much worst#Renkotrade
Hello to all watching my charts,
In the fall of all crypto currencies there is one crypto which seems to me
one of the worst and so one of the best short trades.
So lets have a look at
Litecoin / USD = LTCUSD
The pair had had found af fine bottom at 112.20 and started an impresssive rally
from this point to nearly 134 which is 20% up !
Than we had seen unfortunately broke of one support after the other.
First 127.50
Second 127.00
Third 125.80
In additon the trendline long brake
(All these breaks to the low i have marked with black lines here)
If now if you will go long , for a trendchange we must see
minimum the 115.00 in 2 days
or thats the opposite scenario , if the last support at 112.00 will break
the pair will be traded much lower in my eyes.
So be carefull with long engagements here,
check the next days and we will have a decision here.
Good trades
If you want to support my woerk and my charts , please like them...
Renkotrade
But than in the fall of all cryptoswe have now a fall below 3 supports
(sown in black in my chart) and after that no botom is to see.

WHEN ALT-COIN SZN?! (LTC/USD) 4HRBTC has been killing the market lately hence the delay of Altcoin SZN.
I know I know tragic, However here is my analysis on LTC 4 HR chart. We are in a very interesting time in the market & there is many confidence in BTC right now!
What do you guys think?

LTCUSD reversed from resistance, potential drop!LTCUSD reversed off its resistance at 142.12 where it could potentially drop further to its 87.33.
Disclaimer:
Trading CFDs on margin carries high risk.
Losses can exceed the initial investment so please ensure you fully
understand the risks.
