LITECOIN before IMPULSE PHASE.Hello Traders!
Glad to present Tengri's Traders prediction concerning Litecoin.
Suppose, that long correction in wave "B" or "2", soon should be over.
Present time, we see decline in form of correction to retest the prices 170 - 160 - 140. (invalidation 98.61)
Then it will be a greate opportunity to participate in bullish rally!
Powerful Traders decisively take a long position for 400$;
"Short term target": 240 - 260$;
"Middle term targets": 300 -320$;
"Long term targets": 370 - 400$.
(Teh main invalidation for all targets is 103.90)
Subscribe to "Powerful Traders"!
Everyday, nine Tengri's traders, creates professional analysis, specializing on Elliotte wave theory, Technichal analysis,
Volume Spread analysis, Market Profile, Depth of Market, Order flow & Footprint.
We trade in all financial markets, there are no boundaries or limitations.
«« «« «« «« «« Hold Like! »» »» »» »» »»
(If you have questions, comments, write, reply thoroughly!)
You're welcome!!!
Best regards, the team Traders "Powerful Traders".
Ltcusdidea

LTCUSD moving towards Yellow Support ZoneLTC is crawling in a small range for last few days. It once again failed to cross 100 MA on H4. On the Daily Timeframe, there is a crossover of 13 DMA on downside breaching 20 DMA. Unless LTC concur the RED Resistance Line on TOP with a cross over of 13 WMA in H4 TF, LTC will continue to struggle. If the weakness continues, it may test the Yellow Support Zone and Blue trendline.
We will be loading our BUYs around that area if LTC finds a support in that region.

TRADING ROOM - LTCBTC taking off from 55 DMALTCBTC reversing on upside from key 55 DMA Support. Expect Fireworks

Litecoin being squeezed, watch for a breakout!Litecoin is currently being squeezed in a triangle formation and could break out in either direction. We do have to be cautious of the major resistance at 218 and the major support at 200 which needs to be surpassed or broken to open a move in either direction.
We can also see that RSI is being squeezed in a triangle formation and a breakout in either direction could be a precursor to what we can forecast on price.

Litecoin has made a bearish exit, potential drop!LTCUSD has made a bearish exit signaling that we could be seeing a change in momentum from bullish to bearish. We’re seeing 1st major resistance at 215.03 (Fibonacci retracement, horizontal overlap resistance, breakout level) and a strong drop from here could drive price down to 188.20 support (Fibonacci extension, horizontal swing low support).
Stochastic (21,5,3) is seeing major resistance at 92% where a corresponding reaction could occur.
Trading CFDs on margin carries high risk.
Losses can exceed the initial investment so please ensure you fully understand the risks.


Litecoin Swing Trade Cheat SheetBuy below the lines, sell above.
Resistance will become support in the future.
In order to have 2 or more consecutive trades on the same line there has to be a pullback of about the same size as the initial dip.
Trade smart & make some money!

Litecoin forming a consolidation pattern,prepare for more bounceLitecoin is now consolidating really nicely within a wedge formation. We prepare for a potential bounce above 212 major support (horizontal overlap support, Fibonacci retracement) with our next major resistance at 264.42 (Fibonacci retracement, horizontal swing high resistance).
Stochastic (21,5,3) can see an ascending support hold prices up and our bullish bias really well.
Trading CFDs on margin carries high risk.
Losses can exceed the initial investment so please ensure you fully understand the risks.

Litecoin shot up perfectly as forecasted,potential for more rise
Litecoin has shot up perfectly as forecasted and hit our major resistance level before slowing down. Another rise could occur above 214.38 support (Fibonacci retracement, horizontal overlap resistance) to push price up further to 264.42 resistance (Fibonacci retracement, horizontal swing high resistance, Fibonacci extension).
RSI (34) is clearly above our major support lines which will maintain our bullish bias until broken
Trading CFDs on margin carries high risk.
Losses can exceed the initial investment so please ensure you fully understand the risks.

LTC Ascending Wedge Followed by PullbackHey guys so I'm a beginner analyst. I've been studying technical analysis for about 8 months and I'm starting to put it into action. I'm looking for experienced opinions, advice and criticisms on my ideas. It's one thing to study something and believe you have an idea of what you're doing, but its another to put it into action, therefore, I would really like some opinions of where I might be wrong on this analysis and also where I might be right. So after LTC's big bull run last night (signaling a reversal on the primary trend in reference to the Feb 4th high on the day chart) volatility is winding down. This is forming an ascending wedge signaling a pull back of the bull run. I'm looking for support at the 33%-50% marks. Is it to soon in the trend reversal to look for support at the 50 and 100 MA's? Again, I'm looking for advice, tell me where I'm wrong, tell me where I might be right, give me some advice if you have any, thank you all!

LTCUSD falling wedge breakoutCOINBASE:LTCUSD
A bullish breakout of a falling wedge constitutes an excellent long opportunity, with a falling wedge being a continuation pattern .
STOP LOSS : 93.91
TAKE PROFIT : 414.69
Risk-reward : 3.2
Longer term trend: Bullish
Current trend: Bearish
General comments:
The falling wedge formed starting mid-december. The lower channel became flat (horizontal, instead of diagonally down) due to the 78.6% retracement supporting prices up.
What I like:
1) price respected the 78.6 level twice with 2 pins piercing through but closed above. This means signals a good price area of where to park our stop losses.
2) excellent risk-reward ratio of >3
3) price has spent about 2 months in the falling wedge, a breakout may be one with notable vigor
What I dislike:
1) technicals aside, LTC's performance (like many other coins) is hindered if BTC prices continue to slump. The market uses BTC as a bench to check the general health of cryptocurrencies.
Other things to note:
1) many speculate huge bullish movements with astronomical targets since the beginning of the BTC's huge correction. The time is about now.
*This is my first few attempts to contribute to the tradingview community. All suggestions/feedback welcome!
x, and happy chinese new year,
iskfx

My thoughts on LTCUnlike BTC and ETH LTC has already formed a double bottom, but that does not mean it cannot go lower, it is always possible that it could. However, between the double bottom formation and $100 being, in my opinion, a very strong support area I would be very surprised if LTC would break below $100 for very long. If by chance I am wrong the $100 level does not hold I would say that $80 would be the next stop. My plan is to rebuild my position in LTC, I have already started buying again, slowly building up my position however if LTC does drop below $100 very far I will start buying aggressively.

Short term Analysis for Litecoin (LTCUSD)Litecoin sold off from a high of $375.00 USD on Dec. 19, 2017. The current movement downwards which appears not yet complete can be described as a W-X-Y Elliott Wave Structure.
Path of possible price trajectory is shown by the black arrow before Litecoin can sustain any bull move. A close below $107.63 should see LTCUSD probably target $57, at which point wave Y = 161.8% wave W, which is an acceptable Elliot Wave projection for a W-X-Y structure.
Above all, I have a bullish bias for LTCUSD and would wait to see how things shape up before going LONG. Patience is very important in trading. Better to let the market show its hand first.
cryptotrader.investments

LTCUSD has reacted nicely from descending resistance,keep watch!LTCUSD has risen to our long term descending resistance line, tested it and started to react nicely off it. The overall momentum remains bearish and our first major resistance is at 149.41 (Fibonacci retracement, horizontal overlap resistance, Fibonacci extension, descending resistance) where further bearish momentum could drive price down to at least 108.41 support (Fibonacci extension, horizontal swing low support). Our long term descending resistance line is also adding a lot of bearish momentum to this setup.
Stochastic (34,5,3) is dropping nicely from our 99% resistance with good downside potential.
Trading CFDs on margin carries high risk.
Losses can exceed the initial investment so please ensure you fully understand the risks.

Litecoin has reached our support as expected, prepare for bounce
Litecoin has dropped further as expected and is now testing first major support at 135 (Fibonacci extension, horizontal swing low support) and a bounce could occur at this level to see an intermediate corrective bounce up to 165 resistance (Fibonacci retracement, horizontal overlap resistance).
Stochastic (34,5,3) is seeing major support above 5.6% where a corresponding bounce could occur.
Trading CFDs on margin carries high risk.
Losses can exceed the initial investment so please ensure you fully understand the risks.

maybe just maybe a change in direction????In this bearish market, it always hard to find places Im willing to put money in. honestly, I think we will need to see a total market shift before we see LTC start heading back up for good. Until that happens if we can find spots to jump in and make small gains, take them. I truly believe we will jump back up to $200, but in this market noting is for certain. Be careful out there, and also have a stop loss in place in case the trade doesn't go your way.
best of luck
peace and love
B-

Litecoin, A great trading opportunity in LTCUSD. Don't miss it!!Trading suggestion:
Price is in the support zone (231.76 to 198.04), traders can set orders based on Daily-Trading-Opportunities (Price Action) and expect to reach short-term targets.
.Beginning of entry zone (231.76)
.Ending of entry zone (198.04)
Take Profit:
TP1= @ 286
TP2= @ 307
TP3= @ 330
TP4= @ 375
TP5= @ Free
Technical analysis:
.Relative strength index (RSI) is 52.
.Current short-term is range bound, but resumption of uptrend is expected.

LTCUSD Join the Partylooks like all coin make same way to up, anyway, anything is possible, Good Luck

LTC/USD MoveAs I type, LTC/USD is at a turning point. It appears that an ABC correction could be in. I previously was looking for a deeper correction in C, but price action has changed my highest probability view at this time.
3 options right now
1. Fakeout and we are looking for a deeper C back into levels I mentioned previously (2nd)
2. Deeper Correction below the 135 (I believe least likely)
3. Looking for this wave 1 to hit the .5 to .764 green fibs (most likely in my view)
Watching the $220 level (black line) based on a previous move that I want to be broken. Going to set alerts and wait for good entry on this if it plays out with scenario 3.
getsome


Litecoin on major support, prepare for a potential bounce!
Litecoin is seeing major support above 222.06 (horizontal swing low support, bullish divergence, Fibonacci retracement) and a strong bounce could occur at this level to push price up towards 244.57 resistance (50% Fibonacci retracement, horizontal swing high resistance).
Stochastic (34,5,3) is seeing major support above 3.6% and also sees bullish divergence vs price signaling that a potential reversal could be impending.
Trading CFDs on margin carries high risk.
Losses can exceed the initial investment so please ensure you fully understand the risks.

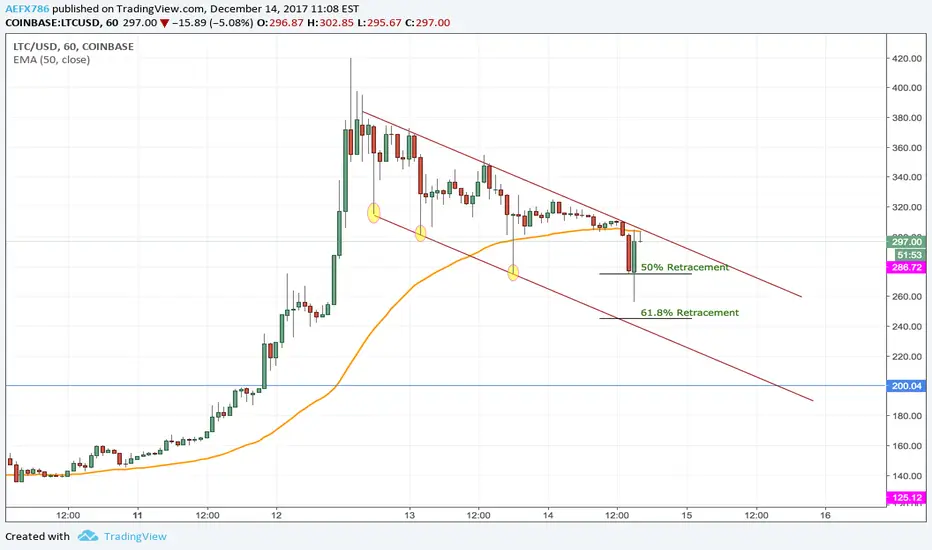
LTC/USD LongWe need to pay attention to the 330 entry level. There was a new trend after the sell off between 12/12 -> 12/15. The trend has been stable but if there is a break in support in the 0.236 fib level ($330~) we may see a retractment to the 300 support line. Being a swing trade we have to realise that 300 is a very strong support line and will most likely just result in a new pattern upward toward the $400~500 levels.
Given the action in the cryptocurrency world lately this could happen in a few days so pay close attention.
Best case scenario for a break in the 330 support level would be entries between 300 and 317 (0.38fib) with stops at .78 or 1 fib levels.
As for now cryptos are looking extremely bullish and I doubt there will be panic sell offs or crashes to the depths of sadness (for all LTC holders).
Pay attention to the 51 RSI and how the MACD just crossed the Histogram in the 4h chart. There is a very real possiblity of a 300 entry.
BTC Donations: 18Tre9MiL48drf48WYotXKZFci11q9r5j7

CRYPTO : LTCUSD Long Based on H1 Timeframe AnalysisThis research is for informational purposes and should not be construed as personal advice. Trading any financial market involves risk. Trading on leverage involves risk of losses greater than deposits.
Please Like & Comment if you agree with this setup and would like to see more Crypto setups from me.