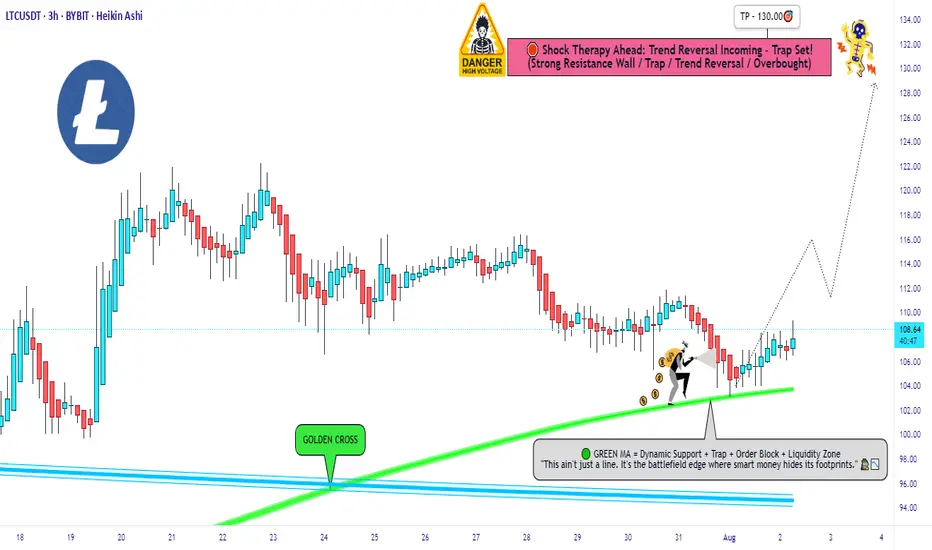
LTC/USDT Robbery Underway | Bullish Setup, Get In Now!🔥💎 LTC/USDT HEIST PLAN: ROB AT ANY PRICE! 💎🔥
🚨 Bullish Move Incoming | Layered Entries | Thief Trader Exclusive 🚨
🌟Hi! Hola! Ola! Bonjour! Hallo! Marhaba!🌟
Dear Money Makers & Market Robbers, 🤑💰💸✈️
The time has come for another high-stakes Thief Trading heist, and this time we're lockin' in on LTC/USDT – aka "Litecoin vs Tether" 💣💸
🎯 Thief’s Mission Plan: BULLISH AT ANY PRICE LEVEL!
We're going full stealth mode with a layering strategy — stacking multiple limit orders like a true pro thief preparing for a clean escape! 🔪📉📈
🚪 ENTRY: "Anywhere, Anytime" 🚪
📈 Buy from any price level — but for optimal entry:
🟢 Use Buy Limit orders near recent lows (15-30 min TF)
🔔 Don’t forget to set alerts for breakout confirmation!
🛑 STOP LOSS: Strategic Defense 🛑
🗣️ "Listen up, team! Stop loss ain’t a maybe — it’s your armor. Place it smart, or prepare for pain." 🔥
📍Recommended SL: 100.00
🔐 Adjust based on your lot size & how deep you stack your orders.
🏁 TARGET: 130.00 🏁
💸 But always Escape Early if the plan gets too hot!
Use a Trailing SL to lock in gains and slip out clean 😎🧨
🧠 PRO TIPS from the THIEF:
🔎 Only Buy. No Shorting!
💣 Scalpers: Jump in with the trend, not against it.
🧲 Swing Traders: Stay patient, and execute the full heist.
🚀 Use Trailing Stops – Let profit ride, but stay protected!
📢 MARKET INSIGHT:
🔥 Bullish Bias backed by:
✅ On-Chain Metrics
✅ Sentiment Shifts
✅ Macro Flows
✅ COT Reports
✅ Intermarket Divergence
⚠️ TRADING ALERT: Stay Sharp!
📰 News Events = Volatility.
💡 Avoid fresh entries during high-impact events.
📉 Use Trailing SL to secure your running trades.
💖 SUPPORT THE CREW 💖
🚀 Smash that Boost Button if you believe in the Thief Style Strategy
👑 Let's rob the market together, one level at a time.
🧠 Stay sharp, stay sneaky – and I’ll see you at the next target 🎯
— Thief Trader 🐱👤💰🚁🌍
Ltcusdlong
Litecoin - Expecting Bullish Continuation In The Short TermH4 - We have a clean bullish trend with the price creating a series of higher highs, higher lows structure.
This strong bullish momentum is followed by a pullback.
No opposite signs.
Until the two Fibonacci support zones hold I expect the price to move higher further.
If you enjoy this idea, don’t forget to LIKE 👍, FOLLOW ✅, SHARE 🙌, and COMMENT ✍! Drop your thoughts and charts below to keep the discussion going. Your support helps keep this content free and reach more people! 🚀
--------------------------------------------------------------------------------------------------------------------

When YouTubers Say 'No'… We Say 'LTC Go!'I’m not here to drop some fancy technical analysis today.
I’m here to tell you… this might just be it.
A big, popular YouTube channel just announced they’re not too bullish on Litecoin this cycle.
And guess what? That might actually be our ultimate buy signal.
The chart’s looking bullish now — the trap has been set, and left behind us. 😎
They FUD, We Flood (Our Bags)
Why Litecoin? Beyond its unshakable fundamentals, if you genuinely understand and believe in crypto and digital freedom, Litecoin is the purest expression of that vision
That's it, that's the idea" - Good night !

LTC starting wave 3This wave will bring us to the break out level, charts looking fantastic and overall bullish. Btc.d still didn't start to melt and the LTC pair is looking to recover the 0,001 and higher for the run. The LTC run from 4 to 420 lasted around 9 months ,the runs from 40 to 420 lasted around 6 months, if me start running now we have get 6 months till the bull ends... Lets keep our eyes open.

LTC, he Hidden Strength Beneath the Retrace Ma dudes, we might just be witnessing something big and beautiful here. 🤌✨
Okay okay, I might sound like a total degen, but hear me out:
✅ Double bottom (check those two green arrows)
✅ Bullish divergence on the RSI
✅ MACD on the monthly just crossed bullish — for the first time ever on this pair!
✅ OBV stayed strong, didn’t collapse even during that nasty monthly retrace
✅ Notice how volume was climbing during the uptrend, but fell off during the retrace? That means the drop lacked real conviction.
We’re also sitting at an ATL (all-time low) — the lowest we've been.
Check out that red arrow pointing at the volume: that's the first sign of a burst. The next bursts? 💥 They should be explosive.
…And that’s just to name a few.
See you somewhere up there 🚀 — once we break through that T1 level, we should start trending higher fast.
That's it, that's the idea" - Good night !

LTC Buy / Long SetupAs price wants to move in a range, SO that's another setup for LTC, invalidation is same as for short setup, candle closing below the mention zone immediately close the trade otherwise wick doesn't matter, wick do the damage body tells the story.


LTC/USDT Heist Alert: Bullish Loot Before the Trap! 🚨 LTC/USDT HEIST ALERT: Quick Bullish Raid Before the Trap! (Thief Trading Plan) 🚨
🌟 Greetings, Market Robbers! 🌟
Hola! Ola! Bonjour! Hallo! Marhaba! 🤑💰💸
🔥 Thief Trading Analysis signals a bullish LTC/USDT heist opportunity! Our plan? Enter long, escape near high-risk zones before bears ambush weak hands. Fast profits = less risk! 🏆💸
🎯 Heist Strategy (LTC/USDT Swing/Day Trade)
📈 Entry:
*"Vault is open! Swipe bullish loot at any price—but for a smoother steal, set buy limits near 15M/30M swing lows."*
🛑 Stop Loss:
📍 Thief SL at latest 4H swing low (adjust for risk/lot size).
📍 Multiple orders? Don’t get caught—size SL wisely!
🏴☠️ Target: 114.00 (or escape early if momentum fades!)
💥 Why LTC/USDT?
Bullish momentum (scalping/day trade).
USDT pairs = stablecoin safety (no USD volatility risk).
Liquidity + tighter spreads (cleaner executions).
⚠️ Heist Safety Protocol
🚨 News = Danger Zone! Avoid new trades during releases.
🔐 Trailing stops = Lock profits, dodge reversals.
💖 Boost the Heist!
💥 Smash the Like & Boost 💥 to fuel our robbery crew! More boosts = more profitable heists! 🚀🤝
Stay tuned—next heist coming soon! 🤑🐱👤

$LTC/USDT Trade Setup 6H Chart.$LTC/USDT Trade Setup 6H Chart.
- Entry: CMP
- Stop Loss: $76.20
Target:
TP 1:- $93.95
TP 2:- $85.65
LTC is bouncing off a long-term trendline support with an early MACD bullish crossover.
DYRO, NFA

LTCUSDT 1D AnalysisLTC ~ 1D Analysis
#LTC Buy after successfully breaking this resistance line with a short term target of at least 10%+ from here.

#LTC/USDT#LTC
The price is moving within a descending channel on the 1-hour frame, adhering well to it, and is heading for a strong breakout and retest.
We are seeing a bounce from the lower boundary of the descending channel, which is support at 92.48.
We have a downtrend on the RSI indicator that is about to be broken and retested, supporting the upward trend.
We are looking for stability above the 100 moving average.
Entry price: 97.44
First target: 100.24
Second target: 102.45
Third target: 105.26

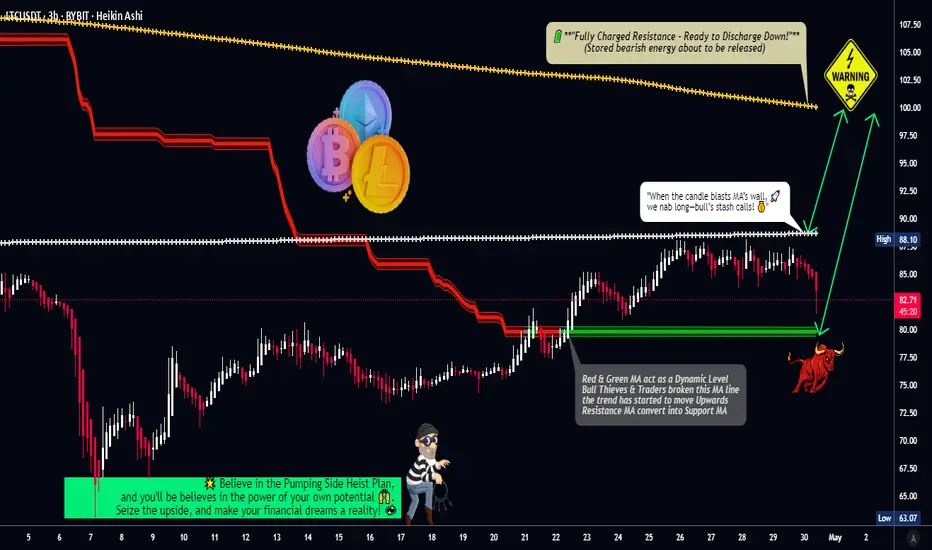
LTC/USDT "Litecoin vs Tether" Crypto Heist Plan (Day/Swing)🌟Hi! Hola! Ola! Bonjour! Hallo! Marhaba!🌟
Dear Money Makers & Robbers, 🤑 💰💸✈️
Based on 🔥Thief Trading style technical and fundamental analysis🔥, here is our master plan to heist the LTC/USDT "Litecoin vs Tether" Crypto Market. Please adhere to the strategy I've outlined in the chart, which emphasizes long entry. Our aim is to escape near the high-risk Yellow MA Zone. Risky level, overbought market, consolidation, trend reversal, trap at the level where traders and bearish robbers are stronger. 🏆💸"Take profit and treat yourself, traders. You deserve it!💪🏆🎉
Entry 📈 : "The heist is on! Wait for the MA breakout (90.00) then make your move - Bullish profits await!"
however I advise to Place Buy stop orders above the Moving average (or) Place buy limit orders within a 15 or 30 minute timeframe most recent or swing, low or high level for Pullback entries.
📌I strongly advise you to set an "alert (Alarm)" on your chart so you can see when the breakout entry occurs.
Stop Loss 🛑: "🔊 Yo, listen up! 🗣️ If you're lookin' to get in on a buy stop order, don't even think about settin' that stop loss till after the breakout 🚀. You feel me? Now, if you're smart, you'll place that stop loss where I told you to 📍, but if you're a rebel, you can put it wherever you like 🤪 - just don't say I didn't warn you ⚠️. You're playin' with fire 🔥, and it's your risk, not mine 👊."
📍 Thief SL placed at the nearest/swing low level Using the 3H timeframe (77.50) Day / Swing trade basis.
📍 SL is based on your risk of the trade, lot size and how many multiple orders you have to take.
🏴☠️Target 🎯: 100.00 (or) Escape Before the Target
🧲Scalpers, take note 👀 : only scalp on the Long side. If you have a lot of money, you can go straight away; if not, you can join swing traders and carry out the robbery plan. Use trailing SL to safeguard your money 💰.
💰💵💸LTC/USDT "Litecoin vs Tether" Crypto Market Heist Plan (Swing/Day) is currently experiencing a bullishness,., driven by several key factors. .☝☝☝
📰🗞️Get & Read the Fundamental, Macro, COT Report, On Chain Analysis, Sentimental Outlook, Intermarket Analysis, Future trend targets... go ahead to check 👉👉👉🔗🔗🔗
⚠️Trading Alert : News Releases and Position Management 📰🗞️🚫🚏
As a reminder, news releases can have a significant impact on market prices and volatility. To minimize potential losses and protect your running positions,
we recommend the following:
Avoid taking new trades during news releases
Use trailing stop-loss orders to protect your running positions and lock in profits
💖Supporting our robbery plan 💥Hit the Boost Button💥 will enable us to effortlessly make and steal money 💰💵. Boost the strength of our robbery team. Every day in this market make money with ease by using the Thief Trading Style.🏆💪🤝❤️🎉🚀
I'll see you soon with another heist plan, so stay tuned 🤑🐱👤🤗🤩
LTC will this Demand Zone Trigger a Reversal or a Full Crash?Yello,Paradisers! Is this the calm before a major bounce, or the final warning before Litecoin breaks down completely? This current zone is absolutely critical ignore it, and you risk missing the next big move.
💎#LTCUSDT has completed a strong 5-wave impulsive move within an ascending channel. The recent correction has now brought the price back down into a very important demand zone near $90. This level isn’t just a random number it’s sitting right on top of a previous major support zone that held back in early April, just before the entire leg up began.
💎Price is now also testing the lower boundary of the ascending channel. As long as #Litecoin holds this demand zone between $90 and $93, the bullish structure remains intact. This could be the perfect reload zone for bigger players preparing for the next leg up. If the price begins to form higher lows from here and reclaims the $96–98 region with strength, it could open the path toward the moderate resistance at $110. And if that level breaks with momentum, we’re likely looking at a full extension into the major resistance above $115.
💎However, if #LTC closes a candle below major support at $80 with volume and structure confirming the breakdown, the setup will be invalidated. In that case, we’re potentially heading for a much deeper flush into the $72–75 range, which aligns with the next HTF liquidity pool and potential weekly support.
Stay sharp, Paradisers. The market will soon decide and if you're ready, you'll be on the right side of the move.
MyCryptoParadise
iFeel the success🌴

LTCUSDT 1D Analysis LTC ~ 1D Analysis
#LTC Buy after successfully breaking this resistance line or buy when retesting this support block with a short term target of at least 10%+.

Valuable Demand Zone Amid Weak Market ConditionsLTCUSDT Analysis: Valuable Demand Zone Amid Weak Market Conditions
I believe the blue box in LTCUSDT is highly valuable as a demand zone. Given the overall market conditions are not strong , I’ve identified a lower entry point that aligns with more favorable risk-reward scenarios.
This blue box stands out due to its significance from multiple perspectives . I used heatmap , cumulative volume delta (CVD) , and volume footprint techniques to accurately define this zone as a potential buyer area.
Key Points:
Market Conditions: Currently weak, favoring conservative entry levels.
Blue Box: A carefully identified high-value demand zone.
Techniques Used: Heatmap, CVD, and volume footprint for precise demand mapping.
If you'd like to learn how I use these advanced techniques to define accurate demand zones, just DM me!
If you think this analysis helps you, please don't forget to boost and comment on this. These motivate me to share more insights with you!
I keep my charts clean and simple because I believe clarity leads to better decisions.
My approach is built on years of experience and a solid track record. I don’t claim to know it all, but I’m confident in my ability to spot high-probability setups.
If you would like to learn how to use the heatmap, cumulative volume delta and volume footprint techniques that I use below to determine very accurate demand regions, you can send me a private message. I help anyone who wants it completely free of charge.
My Previous Analysis
🐶 DOGEUSDT.P: Next Move
🎨 RENDERUSDT.P: Opportunity of the Month
💎 ETHUSDT.P: Where to Retrace
🟢 BNBUSDT.P: Potential Surge
📊 BTC Dominance: Reaction Zone
🌊 WAVESUSDT.P: Demand Zone Potential
🟣 UNIUSDT.P: Long-Term Trade
🔵 XRPUSDT.P: Entry Zones
🔗 LINKUSDT.P: Follow The River
📈 BTCUSDT.P: Two Key Demand Zones
🟩 POLUSDT: Bullish Momentum
🌟 PENDLEUSDT.P: Where Opportunity Meets Precision
🔥 BTCUSDT.P: Liquidation of Highly Leveraged Longs
🌊 SOLUSDT.P: SOL's Dip - Your Opportunity
🐸 1000PEPEUSDT.P: Prime Bounce Zone Unlocked
🚀 ETHUSDT.P: Set to Explode - Don't Miss This Game Changer
🤖 IQUSDT: Smart Plan
⚡️ PONDUSDT: A Trade Not Taken Is Better Than a Losing One
💼 STMXUSDT: 2 Buying Areas
🐢 TURBOUSDT: Buy Zones and Buyer Presence
🌍 ICPUSDT.P: Massive Upside Potential | Check the Trade Update For Seeing Results
🟠 IDEXUSDT: Spot Buy Area | %26 Profit if You Trade with MSB
📌 USUALUSDT: Buyers Are Active + %70 Profit in Total
🌟 FORTHUSDT: Sniper Entry +%26 Reaction
🐳 QKCUSDT: Sniper Entry +%57 Reaction
I stopped adding to the list because it's kinda tiring to add 5-10 charts in every move but you can check my profile and see that it goes on..

The LTC Bullish case to $10k and why it can happen this Bull RunEveryone is ignoring LTC, Digital Silver.
If we are to look at the network hash for Litecoin and where it was during the previous seasons peak, Jan 2018 and May 2021, we can see the network has was at 100TH and ~210TH in 2021..
We are currently at 2.3 - 2.5 PH, that is 12-25x previous values during the Price top in the last 2 bull runs.
Looking at the NVM (Network Value Model) for Litecoin, we can notice the network has constantly grown while the price is now pretty much unchanged and at the same level as 4 or 7 years ago.
Lastly if we are to look at the BTCLTC and LTCBTC chart, both are displaying a clear picture, it's Litecoin's time to shine and show why it is called Digital Silver and Bitcoin Digital Gold..
Litecoin is valued at 0.1 of BTC based on previous charts and ATH, that easily puts Litecoin at the 5 digits range, tehnically Litecoin can surge to 430 - 700x, time will tell if we go to $20-30k or more, it also depends where Bitcoin will meet it's peak this run. Will it be $150-190k or $250-490k??
This will dicated Alts top and of course Litecoins too.
Let's not forget that ETH was $70-90 in 2017-2018, it did not stop it going to EUROTLX:4K and it will not stop it from moving now into 5 digits, Litecoin can and will do the same.
It's a solid network, there are a ton of miners, tehnically it's in a 5 year Triangle and breaking out, we are going to see ETF listings for LTC soon, news will start to pile and retail will want to buy the cheaper Bitcoin, the one with real and actual Payment Utility!
Let's see where we are in 3 months and end of this Year.
I am predicting we teleport to $300-500 sooner rather than later!

LTCUSDT 1D AnalysisLTC ~ 1D Analysis
#LTC Buy after successfully penetrating this resistant line with a short -term target of at least 10%+ from here.

LTCUSDT 1WLTC ~ 1W Analysis
#LTC Buy gradually when re -testing this support with a short -term target of at least 15%+.

LTCUSDT Breakout Loading….BINANCE:LTCUSDT has been consolidating for several days, repeatedly testing resistance levels. This pattern suggests a potential breakout is on the horizon. With ETH already gaining momentum, Litecoin could follow suit. Once the market starts moving, plenty of trading opportunities may arise.
Trade Smart: Always use a stop loss and manage your risk effectively.
BINANCE:LTCUSDT Currently trading at $91.5
Buy level: Above $91
Stop loss: Below $83
Target : $130
Max Leverage 3x
Always keep Stop loss
Follow Our Tradingview Account for More Technical Analysis Updates, | Like, Share and Comment Your thoughts

LTCUSDT 1WLTC ~ 1W Analysis
#LTC This support block continues to be maintained so far.
Buy gradually from here with a minimum target of 20%+.

Litecoin LTC Will Repeat The Same Pattern?Hello, Skyrexians!
Today it's time to update our BINANCE:LTCUSDT idea. It has formed the same pattern like we have seen before 2021 altseason. We know that patterns usually play out in the opposite direction than we saw in the past because of the trader's expectations, but this time we have some proofs that this pattern can play out the same.
Let's take a look at the weekly time frame. First of all we wanna you to notice the green dot on Bullish/Bearish Reversal Bar Indicator at the very bottom. This signal increases probability of a strong bull run until the red dot flashes. We also can count the Elliott waves. Wave 1 was in 2022-2023, and after that wave 2 was tricky flat correction and now price is in wave 3. Wave 3 has the target between 1.61 and 2.61 Fibonacci extension levels. The conservative target is $174, the optimistic is almost $250.
Best regards,
Skyrexio Team
___________________________________________________________
Please, boost this article and subscribe our page if you like analysis!

LTC Aims for $140 After Mid S/R BreakoutPrice is trading within a broad range between the $98 support and $140 resistance. After breaking out of the mid S/R line around $115, the price could now move toward the $140 target.
A breakout above $140 may trigger a strong bullish rally, while a drop below $98 signals bearish risks. Watch for volume confirmation!

Litecoin ETF inevitableSomeone's painting the chart, there is no doubt about it. I think old meme coins will make a comeback LTC being one of the strongest one atm so position accordingly.
There is a strong chance this pumps harder than target on here, 400s seems doable.
