LTCUSD Just the beginning.Just the beginning. Now bitcoin will find its resistance. And all I will go to the next altcoins. LIKE LITECOIN
Ltcusdlong

LTCCUSD approaching resistance, potential reversal! Price is approaching our first resistance (horizontal pullback resistance, 38.2% Fibonacci retracement, 61.8% Fibonacci extension) where we might see a corresponding drop to our first support level (50% Fibonacci retracement, 61.8% Fibonacci extension).
Stochastic is also approaching resistance where we might see a corresponding drop in price.
Trading CFDs on margin carries high risk.
Losses can exceed the initial investment so please ensure you fully understand the risks.

LTCUSD could see a reversal below our first resistance levelLTCUSD is approaching our first resistance (horizontal swing high resistance, 100% Fibonacci extension, 76.4% fibonacci retracement) where we might see a drop to our support (horizontal swing low support, 61.8% Fibonacci retracement). Stochastic is approaching resistance as well.
Trading CFDs on margin carries high risk.
Losses can exceed the initial investment so please ensure you fully understand the risks.

Potential bounce as LTCUSD is approaching support!LTCUSD is approaching our first support (horizontal overlap support, 61.8% Fibonacci extension, 76.4% Fibonacci retracement) where price might bounce to our first resistance (horizontal swing high resistance, 61.8% Fibonacci retracement, 100% Fibonacci extension).
Stochastic is approaching support as well.
Trading CFDs on margin carries high risk.
Losses can exceed the initial investment so please ensure you fully understand the risks.

LTCUSD approaching resistance, potential reversal coming!LTCUSD is approaching resistance (horizontal pullback resistance, 61.8% Fibonacci retracement, 100% Fibonacci extension) where a strong drop might occur below our first support level (horizontal swing low support, 61.8% Fibonacci retracement). Stochastic is also approaching resistance where we might see a corresponding drop in price.
Trading CFDs on margin carries high risk.
Losses can exceed the initial investment so please ensure you fully understand the risks.

The LTC Project 2019, Phase 01, Edition 01Observations:
Daily Chart indicators:
50 EMA acting as support;
0.5 fib retracement looks like the key support level; the downward wedge channel has the break at this point.
Black slope line acting as another support line since March.
RSI around the 50% mark with double sch. oscillator indicating a return to upward momentum, confirmed by the bounce;
We have completed impulse 4 of the elliot wave
4 Hrly chart observations;
Gartley pattern in play with the black slope as its support. Immediate target after point D is the level of point A;
The 50 and 100 EMA cross over indicating a bullish component;
0.786 fib seems to be the retracement level;
4 HRLY CHART 1;
LTCUSD LONG after 30 daysLTCUSD after 30 days
Total books: $30,517,498.67 (-8.46%)
Global Bids: $15,096,060.93 (-16.81%)
Global Asks: $15,421,437.74 (-0.29%)


LTC may lead the Bull trend with huge pumps aheadHi all,
I have come with new idea. This time it is with LTCUSD. I see good bull trend to be lead by LTC.
My Target is 136-148$ in next 1.5months.
Load LTC in this dip as much as you can. Enjoy.
Please thank me by liking and sharing if it helps.
Thanks.,
Anonymous

LTC/USD - LONG with TIGHT s/lBlue triangle indicates the current range.
Green box is buy.
Red box is sell.
Blue line indicates major resistance.
Green line indicates t/p.
This is a log chart.
This is not financial advice. All charts shown on my page, including this one, are just for fun.
If you enjoy my ideas please give this post a like and follow my page if you would like to see future posts! :)

LTCUSD approaching support, big bounce upcoming!LTCUSD is approaching our first support at 61.10 (horizontal overlap support, 100% Fibonacci extension, 50% Fibonacci retracement) where we might see a corresponding bounce to our major resistance level at 84.36 (horizontal overlap resistance, 61.8% retracement).
Stochastic is also approaching support where we might see a corresponding bounce in price.
Trading CFDs on margin carries high risk.
Losses can exceed the initial investment so please ensure you fully understand the risks.

LTCUSD THAT IS THE CASE! Strategy Bids and Asks
Total books: $37,443,220.35 (+1.55%)
Global Bids: $19,202,517.82 (-1.76%)
Global Asks: $18,240,702.53 (+5.05%)

LTCUSD approaching support, big upcoming bounce! LTCUSD is approaching our first support at 61.10 (horizontal pullback support, 100% Fibonacci extension, 50% Fibonacci retracement) where a strong bounce might occur above our first support level to our first resistance level at 84.36 (horizontal overlap resistance, 61.8% Fibonacci retracement). Stochastic is approaching support where we might see a corresponding bounce in price.
Trading CFDs on margin carries high risk.
Losses can exceed the initial investment so please ensure you fully understand the risks.

$LTC the #CryptoCoffee Edition - Day Trader ExplainsLadies and Gentlemen,
Welcome back to TJ's Trade Corner!!
Today we will be taking a look at $LTC. Since many people started talking about Litecoin lately and the founder of it is a certified time-traveler, I could not hold myself and NOT take a technical standpoint on the whole hype and conspiracy about Litecoin.
First of all, we start with the market structure. Here, we see the only coffee that I like drinking.. The Crypto Coffee which is served in a beautiful Cup and Handle market structure!
We had a long long way down, started bottoming in December and now after a really crazy rally, we can see the big retrace and the handle pretty much complete.
Taking a look at the retrace, I can see such a steep decrease only in December, where we found the actual bottom for $LTC. This might be the case this time as well and we have the chance of being ready to witness one of the biggest pump this year!! Yes, even bigger than $BTC.
Let's take a look at the Volume!!
Here, we need to zoom in a little:
As we look at this, we can see over the last three days a pretty strong and significant Volume. First, a nice dragonfly-doji or as some might say scuffed bull hammer, in any way a strong reversal and bullish candle. Then two continuation candles, both significantly bullish. Today, we are seeing a small retrace, which is of the same size as the previous day BUT it has 1/6th of the volume. This means that people are not really selling and over the last 3 days we saw a lot of people buying!!
Now, continuing with the moving averages, should we stay above the 89 moving average, then the next few days have a high chance of being very bullish. Nevertheless, should we close below it over the weekend, we will most likely see a blood bath on Monday with first target reaching for the 12845 and then ultimately for 12185.
Looking at the TJ-Stoch, we can see that we are since pretty much 2 weeks in oversold conditions and we just got the Stoch crossover and see a nice green cross on it. This at itself is already a buy signal and based on the above it is backed by multiple factors.
This TA and a full trade set up has been published before in my private learning group "ETG".
We are going over many observations and possible trades very frequently.
It is meant for only those who are really interested in becoming a self sufficient trader and learning about all the secrets of trading.
Should you be interested in ETG or the indicators I use, join my discord channel and say hi in chat, then I will give you a free trial for which you might be interested.
Like and Follow me and you will find the space interesting because I am a TA expert and professional day trader in crypto since 2012 that does daily updates and new posts about the hottest and most discussed coins.
Cheers TJ

My latest LTC analysis have been on fire! Where to next!?Check out my last LTC analysis' down below. My iH&S analysis NAILED it and we had a HUGE move.
If you are going to follow me, you should know at least one thing about how I trade or how I take positions. One of them being that I ladder in positions quite frequently and I will lay out how I do that.
our previous analysis' told the story of laddering from 60 down to the 30-40 area. We are in VERY good position. So! Before we get to the technicals, a couple things to be mindful of.
1. If you are still in: put sell targets below 150. If the market comes close to hitting them, gtfo if it's around that area. It's time to take profit. We'll look for another entry
2. If you got out around 90-100, it's time to start getting back in for the next move up. You can do this one of 2 ways now that you have booked a lot of profit.
A. Go in with 50% of your LTC position NOW. and a 50% buy down at the 63 area. You can also enter in more as the market moves up.
B. If you are worried about a severe down trend, you can start laddering from 70 down to 40 again.
I think a more aggressive stance is better in this case. The choice is yours.
So, we had a massive move up. A broken ascending triangle. Weekly MACD is now in positive territory and we don't have really much of a divergence in RSI, just steady movement in the upwards direction. If we get a similar move after we break this triangle again, we should move up to just below this 150 area. You can see this is at a 38.2 fib and a resistance level pulled from that doji candle. It's not precise, but we are focusing on being just beneath the 150 area for a point to exit completely if not done so or for new entries.
This move will take a couple weeks yet to form up. As long as we hold this 60 area we are in good shape.
Happy trading and hodling,
-Sherem

LTCUSD 15 days So far, there is not much difference in numbers between buyers and sellers.
But everything is fixable. It will be flat, since there is not a big difference in volume.
Total books: $27,179,080.94 (-1.35%)
Global Bids: $12,862,728.77 (-10.25%)
Global Asks: $14,316,352.18 (+6.63%)
24hr Volume: $620,075,773.72 (+25.081%)


Ladder In Positions!! LTC/BTC
As posted previously, we dropped down to the box region. But once again, looking at the bigger picture, I don't see anything worth taking a position yet. If the current level (price) holds then expect the T3 and T4. If you followed and entered already into a position, that is fine, but make sure we stay above the blue trend line at 14019 sats.
A break down below the blue trend line, we could see LTC retest the 12H OB support and T1 T2 and T3 would be my sell targets.
Probable Entries: 15368 - 14766 sats reg.
Potential Targets: 19279 - 20619 sats.
Potential Profit: 25.53% - 39.63%
For day to day updates and new chart analysis, join Altchica on Telegram at t.me

XAGUSD is approaching our first support at 14.83 (horizontal LTCUSD is approaching our first resistance at 113.24 (horizontal pullback resistance, 61.8% Fibonacci extension, 23.6% Fibonacci retracement) where a strong drop might occur to our major support at 94.33 (23.6% Fibonacci retracement).
Stochastic (34,5,3) is also approaching resistance.
Trading CFDs on margin carries high risk.
Losses can exceed the initial investment so please ensure you fully understand the risks.

LTCUSD Let's see what he can!LTCUSD
Deal for 1 month for (16 %) + 13 %
In this situation, the growth of buyers and sellers.
If you trade with leverage, determine the entry point or watch me, I will update if the situation changes.
I keep my hand on the pulse, put a pending order at a price of 77

LTC/USD Target Prices Before Entering Longs or ShortsThe analysis takes into account historical support and resistance levels, Fib retracement at various levels, RSI levels and also volume. The accumulation zone is highlighted and also the target zones should the accumulation zones (amber and yellow) be broken. As soon as these are taken it appears to offer a good indication of when to open a Short or Long. Basic TA using 1D and 4H time frames.
Once 77.50 level is taken, advise setting S/L at $79.50 and going Short. R only of 1.06 to first target. In theory medium to high risk, but strong indicators reduce risk. Open Long target price of $81.19, S/L at $78.95. Target price 1 of 82.57. R of 0.62 initially, but this is a very weak and old resistance level. Target should be $88.81; R moved to 3.40 and only 22% win rate required.

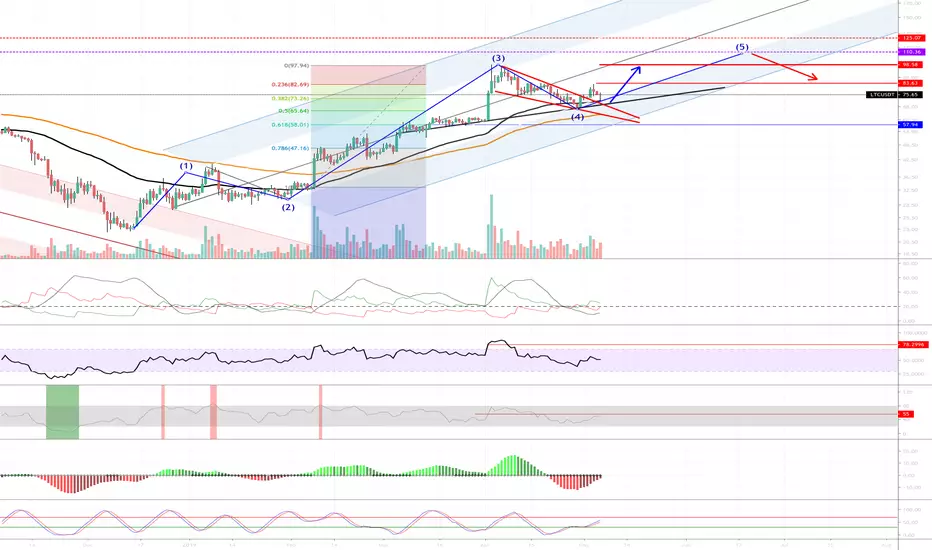
LTC TA (3H chart) [09 April 2019]Reason to Long LTC
- There is still one more wave, Minor 5th Wave going up
- Golden crossover already happened in daily chart
Entry Point : $75 - $83
- 0.382-0.618 fib level
Exit Point 1 : $98
- Double top
Exit Point 2 : $108
- Resistance level
Stop Loss : $71
- Below laddering range

LTCUSD approaching resistance, potential drop! LTCUSD is approaching our first resistance at 113.24 (horizontal pullback resistance, 61.8% Fibonacci extension, 23.6% Fibonacci retracement) where a strong drop might occur to our major support at 94.33 (23.6% Fibonacci retracement).
Stochastic is also approaching resistance where we might see a corresponding drop in price.
Trading CFDs on margin carries high risk.
Losses can exceed the initial investment so please ensure you fully understand the risks.
