LTCUSDT


LTC ANALYSIS (4H)Hi, dear traders. how are you ? Today we have a viewpoint to BUY/LONG the LTC symbol.
For risk management, please don't forget stop loss and capital management
When we reach the first target, save some profit and then change the stop to entry
Comment if you have any questions
Thank You

LTC/USDT Review 4H Hello everyone, I invite you to review the chart of LTC in pair to USDT. Let's start by marking the local downtrend line with a yellow line as we can see the price is about to try to break this line.
Moving on, we can move on to marking support areas when we start a larger correction. However, here we see that the price is at the upper border of the $93 to $87 strong support zone, when the price falls below this zone, the next support is at $80.
Looking the other way, we can mark the first support at $98.99, then we have a strong resistance zone from $105 to $109, only after an upward exit from this zone, the price will move towards resistance at $114.87.
When we turn on the EMA Cross 50 and 200, we can see that the price is moving just below the EMA Cross 200 and is close to an uptrend, which would indicate a return to the uptrend.
The CHOP index, which indicates that we have a lot of energy for the upcoming move, the MACD remains in the local uptrend, while the RSI has a visible increase, but there is room for the price to go a little higher in the coming hours.

LTC looks weak off the VWAP off swings highs, short is probableLooking for downside intraday with leverage with a LTC short. LTC could not hold the upside push as the VWAP from highs has kept a lid on it.... a break under the horizontal vwap should trigger a flush down to roughly the 90.10 area.

Litecoin: Bull Market TargetsWhen CRYPTOCAP:TOTAL and CRYPTOCAP:TOTAL2 enter their bull markets, large capital will look for save havens to increase their purchasing power.
While Bitcoin has proven time and time again to be an amazing hodl after the accumulation phase, it's R:R is reaching diminishing returns.
Major Altcoins that have proven the test of time, like Ethereum and Litecoin, will start to get more attention during these bull markets as a safe place to massively increase purchasing power.
Cross referencing Charlie Lee's Tweet, and the levels he's suggested vs Bitcoin, paint a very logical target for pattern and range traders anyway.
So, post halving - and into any liquidity events (COVID19, FTX Collapse etc as examples) - I will be looking to bag up Litecoin.

Litecoin (LTC) formed a bullish Gartley for upto 34% moveHi dear friends, hope you are well and welcome to the new trade setup of Litecoin (LTC) with US Dollar pair.
Previously I shared a long-term trade signal for LTC, which is still in play as below:
Now on a daily time frame, LTC is about to complete another bullish Gartley move for the next price reversal.
Note: Above idea is for educational purpose only. It is advised to diversify and strictly follow the stop loss, and don't get stuck with trade.

Litecoin LTC/USDT Can anyone tell if I have this right? I not pro in this but I think how this will work out.

#LTC Intraday (15 MIN) Trade Analysis#LTC Intraday (15 MIN) Trade Analysis.. I am IN with future options for this trade..

LTCUSD Long Litecoin Strong Bullish signal. Risk Reward 1/2 ... I think big consolidation was ended , now it's time to buy more and more LTC...

LTCUSD - Breakout SupportSupport is found with the breakout above the structure.
Support is shown with the green line and circle outlines the support found above the trend line.

LTC - Buy opportunityBINANCE:LTCUSDT
Hello trader! I am glad to share my idea about this pair.
Just remember to manage your capital while trading. No matter how perfect your trading system is, the way you mange your risk is the key to be a consistent trader. The winning trader is always a consistent trader.
Daily: Price is retesting strong support area. Expected to bounce from here
H1: Price is already breakout from trend line and now it is coming back to retest. Time to buy

⚫ LTC usdt - Weekly ⚫🔵 #LTC usdt
⏰ 1W
⚪ As you can see, the price has broken dynamic resistance and static resistance.
If fixed above $100, $130 is available.
🔴 Support and resistance are shown in the chart.
----------------------------------
📛 Follow the market trend and decide to buy or sell.
⚠️ (This isn't a signal for buy or sell) ⚠️
..........................................
👸 Analyzed by : Parisa_Alipoor
..........................................

LTC/USDT.P Trading IdeaGlobal point of view about LTC.
Here we see the range with deviation at the top, looks like we will have a down trend in the future.

LTC Short IdeaWith the markets range bound, there is a idea here to take price back down since we've taken out the range high.
Invalidation is a new higher high from here.
Stop losses likely on the way down are plentiful.

LTC USDT 240
KUCOIN:LTCUSDT
Analysis is simple and without any intermediate indicator, except for the volume indicator and the furniture of static resistors formed in the chart, and it is expected that after breaking the specified limits to the highest ceiling of the specified

LTCUSDT to hit weekly support and bounceThe price hit the monthly and weekly resistance confluence MR1+WR1 and got rejected from there. Currently the price is facing pullback due to that rejection. Next signifiant support is the weekly support where the price is likely to be headed. I expect the price to touch this weekly support zone for a good bounce. By the way, prospect of this one is looking good as it has pushed itself up strongly and moved beyond the downward trend line. The next strong support level is weekly support WS2.

LTC/USDT Review 4H Analysis Hello everyone, welcome to the LTC review on a four-hour interval. Currently, with the help of blue lines, we will mark the downtrend channel, from which the price is fighting for an upper exit.
Now let's move on to marking the support spots for the price and we see that the price is currently holding a very strong support at $94.76, however when it leaves the support below, we can see a drop to the second support at $82.24.
Looking the other way, we can similarly determine the places of resistance that the price has to face. And here we see that the first resistance is at $99.53, then we have the second resistance at $104.49, and then price needs to break a strong resistance zone of $108 to $112.
The CHOP index indicates that most of the energy has been used, the MACD is struggling to return to the local uptrend, while the RSI is moving in the lower part of the range, which may also affect the reversal of the uptrend.

LTCUSDTLTCUSDT is respecting well the inclining trendline and currently trading at 60% fib retracement level. Will the price bounce from this demand zone.

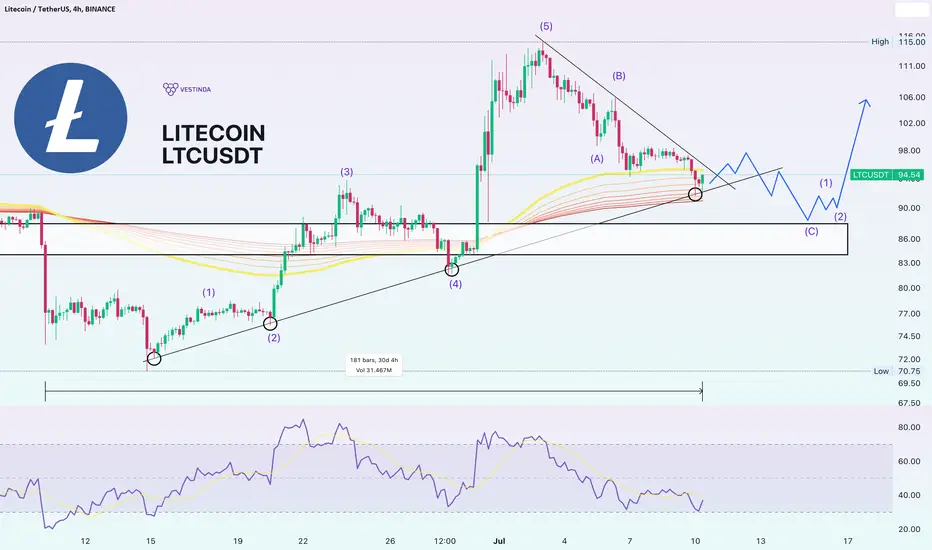
Litecoin LTCUSDT Price Analysis (4h)Greetings, fellow traders and investors of @TradingView 📈🚀
Let's delve into the analysis of Litecoin (LTC) and explore its recent price action on the rising trend. 📊✨
Over the past 30-day period, Litecoin has displayed a consistent upward movement, indicating a well-defined rising trend. Upon closer examination, we can observe the formation of an Elliott Wave pattern, specifically the 1-2-3-4-5 wave structure. This pattern suggests a completed impulse wave and indicates a potential period of consolidation for Litecoin.
🔍 It is crucial to understand the Elliott Wave theory and its application in technical analysis to grasp the potential implications of this pattern fully. Further insights can be found in comprehensive book Elliott Wave Principle: Key to Market Behavior by Robert R Prechter.
👀 As Litecoin enters the consolidation phase, we anticipate a potential pullback towards the support zone in the range of $85 to $90. This area is a critical level where historical price action suggests strong buying interest and the potential for a rebound to the upside.
📉 However, it is essential to approach trading and investment decisions with caution. Market conditions can be dynamic and subject to unexpected changes. Setting appropriate stop-loss order and employing risk management is crucial to protect capital effectively.
📚👩🏫👨🏫 Stay informed and up to date with the latest market analysis and trading strategies by exploring our comprehensive resources on various trading concepts and techniques:
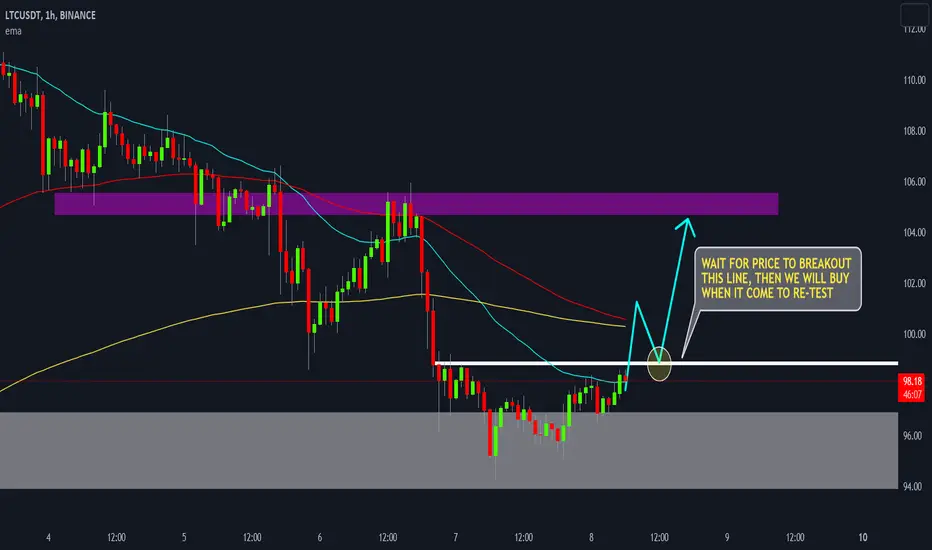
LTC - potential BUY with multi time frame analysicHello trader! I am glad to share my idea about this pair.
Just remember to manage your capital while trading. No matter how perfect your trading system is, the way you mange your risk is the key to be a consistent trader. The winning trader is always a consistent trader.
DAILY: Price reach strong support area. Potential to react to upside.
H1: We see a very clear double bottom and price already breakout. Potential buy
sentiment flip on LTC LTC has been a terrible trader for us... but this setup is a good one with one obstacle in the way of being a full target winner. With a 2.7R reward you have to take the setup... but if this one loses I will back away from LTC for tweaks.

LTCUSDT triggered on long range playLTCUSDT long for a roughly 2.5 R target off the bottom of the range with ETH breaking out. Stop under lows.
