#LITECOIN vs #BITCOIN Outperforming as predicted. Bull Target...Regression Channel analysis is a useful tool
Here we can extend the channel into to the future
to give us a fair estimation where #LTC could go in this next cycle.
LTCUSDT

LTCUSDT analysis buying signal crypto market on the way the our WCL white buying area after finishing the white sequence ICI also the market activate the yellow correction LVL for buying setup

LTC short play from hereI will try to short LTC from here, if the market dumps this coin should also loose it's uptrend. NFA!

LTCUSDt updateFriends LTCusdt is going down for test two levels 1st level is 68.113894 & 2nd level is 67.089989, this is 30mint time frame so maybe retest completed in few hours in sha Allah.

LTCUSDT 1D Interval - Targets and StoplossHello everyone, let's take a look at the 1D LTC vs. USDT chart as you can see we managed to come out of the first trend and we are currently moving above the local uptrend line.
Let's start by setting goals for the near future that we can consider:
T1- $ 76
T2- $ 87
T3- $ 98
T4-114 $
and
T5-134 $
Now let's move on to the stop loss in case of further market declines:
SL1- $ 65
SL2- $ 60
SL3-56 $
SL4-52 $
and
SL5- $ 47
Looking at the CHOP indicator, we can see that in the 1D range the energy has been used, while the MACD indicator shows an upward trend.

LTCUSDT Analysis (LOCAL VISION)Hello friends.
Please support my work by clicking the LIKE button👍(If you liked). Also i will appreciate for ur activity. Thank you!
Everything on the chart.
Entry: market and lower
Target zone: 72 - 75
after first target reached move ur stop to breakeven
Stop: ~41 (depending of ur risk). ALWAYS follow ur RM .
Risk/Reward: 1 to 2
risk is justified
Good luck everyone!
Follow me on TRADINGView, if you don't want to miss my next analysis or signals.
It's not financial advice.
Dont Forget, always make your own research before to trade my ideas!
Open to any questions and suggestions.

LTC/USDT - LONG 12H TF----- Welcome, dear followers! -----
- Here is my trading methodology. I trade with a normal system and analysis of resistance and support, as well as price reversal patterns.
- For the record, I do not place a stop loss within my trades. So that I only risk 1.5% of my total capital in order to support the loss due to a price reversal against me.
- If a price reversed against my expectation and touched the drawn line r3, then I transferred targets to the entry point and waited for the price to close at it with a loss equal to almost zero.
- Today's deal is shown in the chart, and here are the entry and exit points below.
-- Support me with numbers and follow up on my account for other deals in the future. Thank you for coming to this part. --
-------------------------------------------------------
⚡️⚡️ #LTC/USDT ⚡️⚡️
Client: My-Binance Futures
Trade Type: Breakout (Long)
Leverage: Cross (1X)
Entry Targets:
1) 68.87 - 100.0%
Take-Profit Targets:
1) 78.22 - 20.0%
2) 85.49 - 20.0%
3) 96.92 - 20.0%
4) 115.44 - 20.0%
5) 133.96 - 20.0%
Trailing Configuration:
Entry: Percentage (1.5%)
Take-Profit: Percentage (0.75%)
Stop: Breakeven -
Trigger: Target (1)

LTCUSDTanalysis was shared few days ago
analRUning in 30% profit already
now breaking resistance incase breakout expecting 50% another impulse

LTC 300% Profit Potentialltc moving as we predicted few days ago
20% profit so far hold it still long way to go

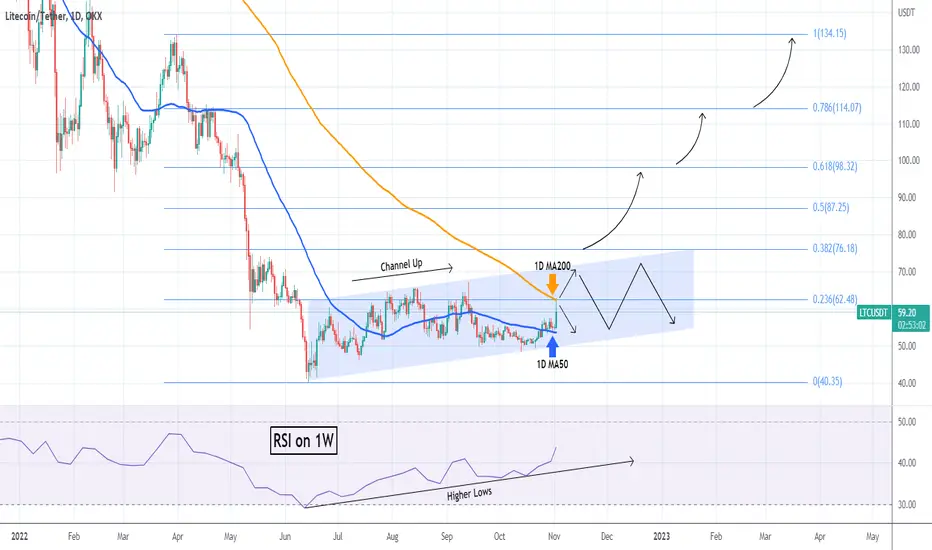
LTCUSDT Hit the 1D MA20 for the first time since 2021!*** ***
For this particular analysis on Litecoin we are using the LTCUSDT symbol on the OKX exchange.
*** ***
The idea is on the 1D time-frame where LTC hit today its 1D MA200 (orange trend-line) for the first time since December 05 2021! It is easy to realize that closing above such a long-term Resistance will be a major bullish break-out.
The sentiment has already been bullish starting from the June 14 bottom, while at the same time the RSI on the 1W time-frame has been continuously rising. On the short-term a break above the 1D MA200 would still be limited below the top of the Channel Up, but a break above the 0.382 would confirm the major break-out and we can target the 0.618 Fibonacci retracement level. Until it breaks, a rejection on the 1D MA200, is short-term bearish towards the 1D MA50 (blue trend-line) which is the current Support.
-------------------------------------------------------------------------------
** Please LIKE 👍, SUBSCRIBE ✅, SHARE 🙌 and COMMENT ✍ if you enjoy this idea! Also share your ideas and charts in the comments section below! This is best way to keep it relevant, support me, keep the content here free and allow the idea to reach as many people as possible. **
-------------------------------------------------------------------------------
You may also TELL ME 🙋♀️🙋♂️ in the comments section which symbol you want me to analyze next and on which time-frame. The one with the most posts will be published tomorrow! 👏🎁
-------------------------------------------------------------------------------
👇 👇 👇 👇 👇 👇
💸💸💸💸💸💸
👇 👇 👇 👇 👇 👇
LTC/USDT - LONG----- Welcome, dear followers! -----
- Here is my trading methodology. I trade with a normal system and analysis of resistance and support, as well as price reversal patterns.
- For the record, I do not place a stop loss within my trades. So that I only risk 1.5% of my total capital in order to support the loss due to a price reversal against me.
- If a price reversed against my expectation and touched the drawn line r3, then I transferred targets to the entry point and waited for the price to close at it with a loss equal to almost zero.
- Today's deal is shown in the chart, and here are the entry and exit points below.
-- Support me with numbers and follow up on my account for other deals in the future. Thank you for coming to this part. --
-------------------------------------------------------
⚡️⚡️ LTC/USDT ⚡️⚡️
Exchange: Binance Futures
Trade Type: Breakout (Long)
Leverage: Isolated (5.0X)
Entry Orders:
1) 52.35 - 100.0% (177.9822 USDT)
Take-Profit Orders:
1) 55.57 - 75.0%
2) 57.53 - 20.0%
3) 60.33 - 5.0%
Trailing Configuration:
Stop: Breakeven -
Trigger: Target (1)

ALTSEASON - Which ALT is NEXT ?Hi Traders, Investors and Speculators 📈📉
Ev here. Been trading crypto since 2017 and later got into stocks. I have 3 board exams on financial markets and studied economics from a top tier university for a year. Daytime job - Math Teacher. 👩🏫
Here are 3 Altcoins that I'm accumulating for the next bullish cycle, or Altseason 2023. They include :
Litecoin / LTCUSDT / LTCUSD :
Cardano / ADAUSDT / ADAUSD :
CRV / CRVUSDT / CRVUSD :
_______________________
📢Follow us here on TradingView for daily updates and trade ideas on crypto , stocks and commodities 💎Hit like & Follow 👍
We thank you for your support !
CryptoCheck

ltctrendline breakout and retest has already done
now facing resistance near 100ma if ltc managed to break 100ma too
then we can expect big bulish rally soon

#Litecoin Firm, LTC Bulls Expect a 20% Rally to $65Past Performance of Litecoin
Litecoin prices are tethered around October 2022 highs at around $55, reading from the formation in the daily chart. Even though buyers appear to be in charge, there must be a sharp continuation in confirmation of mid-week gains for bulls to be in complete control. The upside is shaky, but a follow-through of October 24 gains may re-instill confidence in traders, pumping prices toward September highs.
#Litecoin Technical Analysis
Buyers are upbeat, but the positive correlation between LTC and BTC has yielded little. If anything, LTC prices are lagging and underperforming the Bitcoin markets. Nonetheless, traders are bullish, especially if LTC pulls above $55, trading higher in continuation of early this week's gains. Notably, a W-formation is clear in the daily chart, and prices are bound in the last leg up, aligned along the upper BB. Because prices are still within the October 25 bar, traders can look to buy the dips above the middle BB and $52, setting sights at $65.
What to Expect from #LTC?
Risk-off traders may look to double down on every retracement within the October 25 bar, reading from the daily chart formation. Ideally, if buyers come on top, the coin may surge 18 percent to $65. However, this forecast will tumble on optimists if LTC crumbles from spot rates, forcing LTC below the middle BB.
Resistance level to watch out for: $65
Support level to watch out for: $52
Disclaimer: Opinions expressed are not investment advice. Do your research.

#LTC UPADTE Hi guys, This is CryptoMojo, One of the most active trading view authors and fastest-growing communities.
Consider following me for the latest updates and Long /Short calls on almost every exchange.
I post short mid and long-term trade setups too.
Let’s get to the chart!
I have tried my best to bring the best possible outcome to this chart, Do not consider financial advice.
What is Litecoin (LTC)?
Litecoin (LTC) is one of the pioneer cryptocurrencies that debuted in the crypto space after Bitcoin. LTC was launched in 2011 as Bitcoin-inspired crypto. Litecoin’s creator Charlie Lee calls it a “coin that is silver to Bitcoin’s gold”. Just like Bitcoin, the Litecoin blockchain also operates on the proof-of-work (PoW) consensus
Bitcoin and Litecoin have key differences in their supply cap, hashing algorithm, and transaction speed. LTC has a fixed supply cap of 84 million which is greater than Bitcoin’s 21 million supply cap. Unlike Bitcoin’s SHA-26 hashing algorithm, Litecoin uses the Scrypt algorithm. It takes around 2.5 minutes for a block to be generated on the Litecoin blockchain whereas it would take 10 minutes on Bitcoin.
#LTC
LTC is making this descending triangle pattern which is a bearish pattern currently we are bouncing from the lower support of this pattern IMO In LTC we will some sidewise moves till it does make a breakout or breakdown.
Stay tuned
This chart is likely to help you make better trade decisions if it does consider upvoting it.
I would also love to know your charts and views in the comment section.
Thank you

LTCUSDTHello Dear friends
If the price range of $53.11 is fully consumed, the possibility of the continuation of the upward trend to the white range of $57.14 will be strengthened.
The primary range for reaction and low risk for us is the yellow range ($49.48).
If the corrective trend breaks below the $48.46 price range, the bullish mentality will expire.
We would be happy to hear your comments
