LTC IS READY TO PUMP!!Hi guys, This is CryptoMojo, One of the most active trading view authors and fastest-growing communities.
Do consider following me for the latest updates and Long /Short calls on almost every exchange.
I post short mid and long-term trade setups too.
Let’s get to the chart!
I have tried my best to bring the best possible outcome in this chart, Do not consider it as an
#LTC/USDT is lying on a very strong support level and making this bullish wedge pattern in RSI we can see some bullish diversion move
ENTRY: $98.6 - $100
TARGET: $107 - $115 - $122 - $128 - $135 - $145
SL- $95
LEVERAGE- 2X TO 5X
This chart is likely to help you in making better trade decisions if it did consider upvoting this chart.
Would also love to know your charts and views in the comment section.
Thank you
Ltcusdtanalysis

LTC IS READY TO PUMP!!Hi guys, This is CryptoMojo, One of the most active trading view authors and fastest-growing communities.
Do consider following me for the latest updates and Long /Short calls on almost every exchange.
I post short mid and long-term trade setups too.
Let’s get to the chart!
I have tried my best to bring the best possible outcome in this chart, Do not consider it as an
#LTC/USDT is lying on a very strong support level and making this bullish wedge pattern in RSI we can see some bullish diversion move
ENTRY: $98.6 - $100
TARGET: $107 - $115 - $122 - $128 - $135 - $145
SL- $95
LEVERAGE- 2X TO 5X
This chart is likely to help you in making better trade decisions, if it did do consider upvoting this chart.
Would also love to know your charts and views in the comment section.
Thank you

LTCUSDT Analysis (LOCAL VISION)Hello friends.
Please support my work by clicking the LIKE button👍(If you liked). Also i will appreciate for ur activity. Thank you!
Everything on the chart.
Entry: market and lower
Target: 130 and 145
after first target reached move ur stop to breakeven
Stop: ~104 (depending of ur risk). ALWAYS follow ur RM .
Risk/Reward: 1 to 3
risk is justified
Good luck everyone!
Follow me on TRADINGView, if you don't want to miss my next analysis or signals.
It's not financial advice.
Dont Forget, always make your own research before to trade my ideas!
Open to any questions and suggestions.

LTC 12 HOURS UPDATE Hi guys, This is CryptoMojo, One of the most active trading view authors and fastest-growing communities.
Do consider following me for the latest updates and Long /Short calls on almost every exchange.
I post short mid and long-term trade setups too.
Let’s get to the chart!
I have tried my best to bring the best possible outcome in this chart, Do not consider it as financial advice.
#LONG
GALA /USDT is ABOUT TO breakout this SYMMETRICAL TRIANGLE pattern.
ENTRY: CMP ( CURRENT MARKET PRICE )
SELL- 50%
STOP LOSS: $108
This chart is likely to help you in making better trade decisions if it did consider upvoting this chart.
Would also love to know your charts and views in the comment section.
Thank you

Litecoin Prediction D1Here is my view for LTCUSD on D1. The price should go down, you can put a pending order on the Order block or find an entry on LTF within OB Zone. Trade Safe!

LTCUSDT Analysis (Perspective a couple of months)Hello friends.
Please support my work by clicking the LIKE button👍(If you liked). Also i will appreciate for ur activity. Thank you!
Everything on the chart.(update)
Entry: market and lower
Target: 150 - 200 - 270 - 340
Stop: (depending of ur risk). ALWAYS follow ur RM .
risk is justified
Good luck everyone!
Follow me on TRADINGView, if you don't want to miss my next analysis or signals.
It's not financial advice.
Dont Forget, always make your own research before to trade my ideas!
Open to any questions and suggestions.

LTC/USDT 4 HOURS UPDATE Hi guys, This is CryptoMojo, One of the most active trading view authors and fastest-growing communities.
Do consider following me for the latest updates and Long /Short calls on almost every exchange.
I post short mid and long-term trade setups too.
Let’s get to the chart!
I have tried my best to bring the best possible outcome in this chart, Do not consider it as an
#LTC/USDT is lying on a very strong support level and making this bullish wedge pattern in RSI we can see some bullish diversion move
ENTRY: $98.6 - $100
TARGET: $107 - $115 - $122 - $128 - $135 - $145
SL- $95
LEVERAGE- 2X TO 5X
This chart is likely to help you in making better trade decisions, if it did do consider upvoting this chart.
Would also love to know your charts and views in the comment section.
Thank you

Await confirmation before entering positionThere is a hidden continuation bearish divergence Class A pattern on the chart in regards to the RSI which indicates a downtrend continuation. However, a downwards wedge is forming (blue lines) which could indicate a trend reversal back into an uptrend, yet await for price to either break support or resistance of the wedge before entering a short or a long.
RSI = trend continuation (bearish)
Falling wedge = in theory should break upwards (bullish) but also can easily break downwards

LTCUSDT Analysis (LOCAL VISION)Hello friends.
Please support my work by clicking the LIKE button👍(If you liked). Also i will appreciate for ur activity. Thank you!
Everything on the chart.
Nothing has changed from my last idea.
Entry: market and lower
Target: 180 - 220 - 240
after first target reached move ur stop to breakeven
Stop: ~100 (depending of ur risk). ALWAYS follow ur RM .
Risk/Reward: 1 to ~5
risk is justified
Good luck everyone!
Follow me on TRADINGView, if you don't want to miss my next analysis or signals.
It's not financial advice.
Dont Forget, always make your own research before to trade my ideas!
Open to any questions and suggestions.

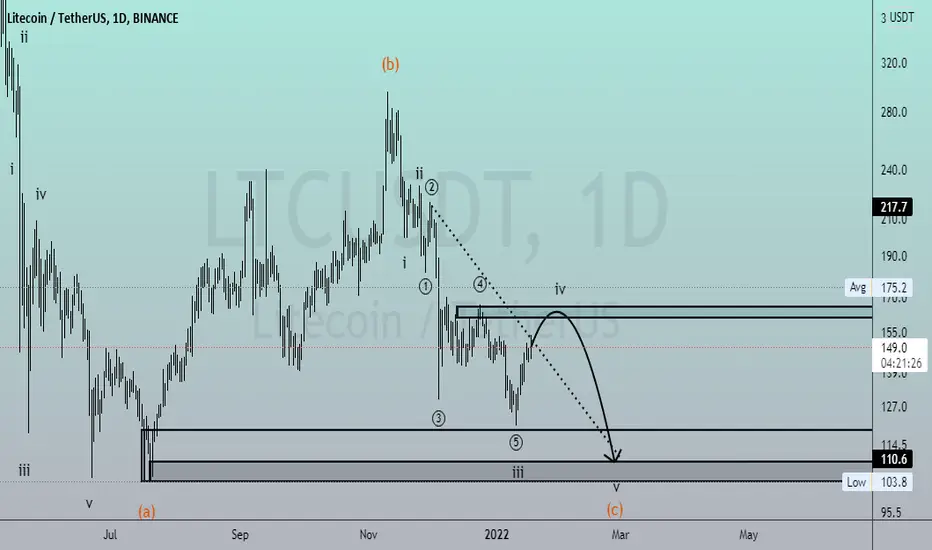
LTCUSDT: Elliot Price actionHello friends. According to the LTCUSDT chart, we see that the end of the fifth wave of the correction has not been formed until , and it is expected that this event will be formed at the 110 price level.
LTCUSDT AnalysisHello friends.
Please support my work by clicking the LIKE button(If you liked).Thank you!
Everything on the chart.
We have completed the potential EndingDiagonal(ED) and concurrently wave (c). Now we will develop a correction of the fall,
let me remind you that I adhere to the fact that according to the LTC we are in a large global triangle of wave (4) after which there will be a very large increase in this asset.
open pos: market and lower
target: 180 - 220 - 240(250)
after first target reached move ur stop to breakeven
stop: under ~125 (depending of ur risk). ALWAYS follow ur RM .
RR 1 to 6
risk is justified
Good luck everyone!
Follow me on TRADINGView, if you don't want to miss my next analysis or signals.
It's not financial advice.
Dont Forget, always make your own research before to trade my ideas!

LTCUSDT SWIING SETUP⚫ LTCUSDT Swing Setup (Spot)
@everyone here i found Barish gartley pattern if LTC rise to 786 level so we can buy here below 143.
Ltc also in demand Zone and RSI in over Sold.
⚠️ this is not a financial advice this is just my Analysis thank you.

Litecoin Wallet M15Here is my view for LTCUSD on M15. The price should go down, you can put a pending order on the Order block. Trade Safe!

Litecoin Wallet H4Here is my view for LTCUSD on H4. The price should go down, you can put a pending order on the Order block or find an entry on LTF within OB Zone. Trade Safe!

LTCLTC (USDT)
buy at the green line
and sell 50% at TP1
and sell 35% at TP2
sell another 15% at TP3
don't set stop lose but if it closed under red line just sell it .
Good luck......

Litecoin Order Block H1Here is my view for LTCUSD on H1. The price should go down, you can put a pending order on the Order block or find an entry on LTF within OB Zone. Trade Safe!


LTCUSDT AnalysisHello friends.
Please support my work by clicking the LIKE button(If you liked).Thank you!
Everything on the chart.
open pos: market and lower
target: 290 - 320 - 350
after first target reached move ur stop to breakeven
stop: ~196 (depending of ur risk). ALWAYS follow ur RM .
risk/reward 1 to 2
risk is justified
Good luck everyone!
Follow me on TRADINGView, if you don't want to miss my next analysis or signals.
It's not financial advice.
Dont Forget, always make your own research before to trade my ideas!
Open to your questions or suggestions.


LTCUSDT AnalysisHello friends.
Please support my work by clicking the LIKE button(If you liked).Thank you!
Everything on the chart.
open pos: market
target: 191 - 197 - 210
after first target reached move ur stop to breakeven
stop: ~163 (depending of ur risk). ALWAYS follow ur RM .
risk/reward 1 to 3
Good luck everyone!
Follow me on TRADINGView, if you don't want to miss my next analysis or signals.
It's not financial advice.
Dont Forget, always make your own research before to trade my ideas!
Will be very appreciate for ur donat/coins :)
Open to your questions or suggestions(Looking for investors!).

LTCUSDT Daily TimeframeSNIPER STRATEGY (new version)
It works ALMOST ON ANY CHART.
It produces Weak, Medium and Strong signals based on consisting elements.
NOT ALL TARGETS CAN BE ACHIEVED, let's make that clear.
TARGETS OR ENTRY PRICES ARE STRONG SUPPORT AND RESISTANCE LEVELS SO THEY CAN ACT LIKE PIVOT POINTS AND REVERSE THE WAVE (or act like a mirror that can reflects light) BASED ON STRENGTH OF THAT LEVEL.
ENTRY PRICE BLACK COLOR
MOST PROBABLE SCENARIOS TARGETS GREEN COLOR
LEAST PROBABLE SCENARIOS TARGETS RED COLOR
DO NOT USE THIS STROTEGY FOR LEVERAGED TRADING.
It will not give you the whole wave like any other strategy out there but it will give you a huge part of the wave.
The BEST TIMEFRAMES for this strategy are Daily, Weekly and Monthly however it can work on any timeframe.
Consider those points and you will have a huge advantage in the market.
There is a lot more about this strategy.
It can predict possible target and also give you almost exact buy or sell time on the spot.
I am developing it even more so stay tuned and start to follow me for more signals and forecasts.
START BELIEVING AND GOOD LUCK
HADIMOZAYAN


LTCUSDT REVERSAL PATTERNLitecoin has shown a mote of its bullness after a double bottom reversal to the close previous highs and since the breakout from the descending channel, ltc has been consistently moving up. A breakout above $158 will validate an uptrend to $216 then a breakout above the key resistance level ($216) will also ratify a huge uptrend inside the previous rising channel taking prices back to previous ATH.
All info have been provided on chart. Breakout and retest must be put into consideration so observe well before taking a long position.
Your likes and opinions would be much appreciated, you can follow up for more helpful contents and do follow my comment sections too for quick updates.
