Tim's Fundamental View LayoutHere is the way that I view any stock for an initial analysis to get an idea of what the market is valuing and viewing the company.
I first look at the free cash flow, so that is directly under the price chart. Free cash flow is the life-blood of the company and can be used to pay dividends and to reinvest in the company to grow the top line or to buy back stock.
Next I look at the PSR or Price-To-Sales-Ratio. This ratio is paramount for me since the top line shows up first for companies and is the starting point for analysis. Companies with low or no sales growth get priced very differently from companies with high growth. Start with sales growth in your analysis. There are many great books on the topic written by Kenneth L. Fisher, the creator of the tool.
Next "Avg Basic Shares Outstanding" to see if the company is constantly diluting investors and raising capital or hiding expenses by giving out stock options each year. Old companies in slow growth industries tend to buy back stock and growth companies grow shares outstanding and is a strong headwind for investors.
Next is "Long Term Debt"... which is another extremely important variable to look at with any company. In the long run, debt is the cheapest capital since you can pay it off cheaply but it can also drag down a company when the future is uncertain and unpredictable. Companies with predictable sales and growth often load up on debt which enhances returns for equity owners, but increases the risk long term. Jet Blue NASDAQ:JBLU is case in point for this as in 2000 before the pandemic it had a $5 billion market cap with $1 billion in debt and now it has over $8 billion in debt and the market cap is down to $1.5 billion. It is very difficult to get out from under such a heavy debt load. Debt can be "death" for any company if overused.
Next is "Revenue" graphed annually. Essential to see if inflation impacts sales growth or if it can't keep up with inflation. The last 5 years was between 20%-50% inflation depending on the industry so if a company doesn't have higher revenues by at least 20% since 2019, then this reveals a weakness in their pricing power which is a very competitive market with likely declining or low margins.
Last is "Market Cap". It is always good to know the market capitalization of any stock that you own. It is the foundation for understanding if any investor would ever want to buy the whole company and what would it cost to buy it and what are the "returns" from owning the whole company.
I hope you can copy this layout for your own so you too can have a one-page view of the history of a company to help you get your mind around its valuation and potential along with understanding the risks all in one, easy picture.
Ltd

BEL 294 TLBO Opportunity Analysis 2 Nov 24BEL
TLBO opportunity
Watch for possible TLBO at 294 resistance
T1 309
T2 325
T3 340

BOROSIL RENEWABLES LTD. Bullish SequenceBOROSIL RENEWABLES LTD.
It is being observed that BOROSIL RENEWABLES LTD has shown good correction over the period of 1 year i.e., Apr 22 to Mar 2023. Now it looks like it may bounce back for its 3rd wave of impulse.
Please add my analysis to yours for better results.
Thank you.

Change in Titan company ltd (inversion) all my indicators with 85% tell me that the market change to buying

SOS will see new high??!!The wall at 4$ is broken soon. There is a big potential for sos-limited to grow even higher than last high!

CDSL LTD.This chart is only for educational purposes and should not be considered for doing any buying and selling in this stock.


Hastings Technology Metals: HAS.AXWatchlist
Increased volume for the previous trading day
Currently trading in a range
Rectangle pattern, potentially ready to break out
Watching 14c level

Advice to do nothing at the momentWe have breathlessness of sellers and we broke a resistance which is a strong support since May 2017 and March 2018 i advice to buy until there is a high volume of purchase green . Attention ! be careful it could just be a pullback and continue to follow the low tandance.

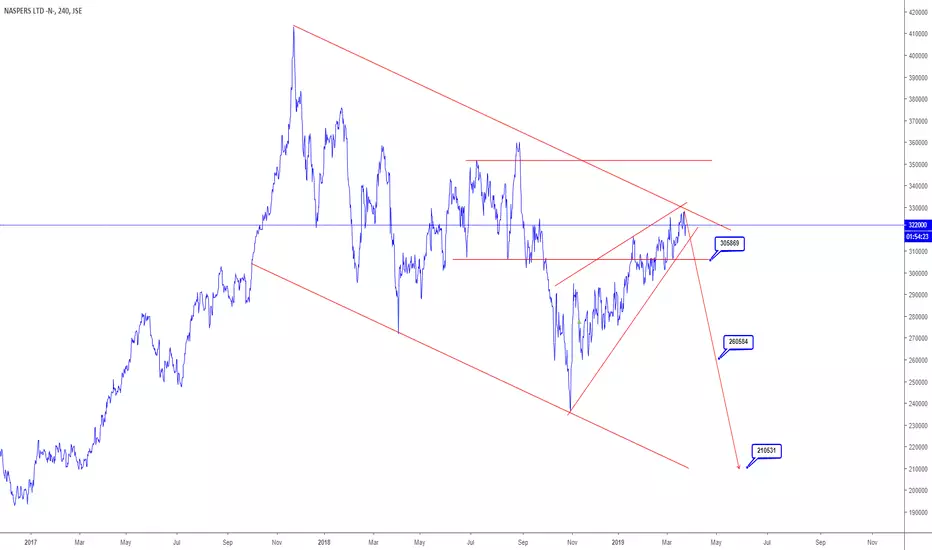
NASPERS LTDThere's been a pennant forming within a bearish trending channel. I am thus expecting that if there be a breakout off this pennant, we will enter with the sellers at 305869 Price level. I am only looking to sell, if the price breaks off the resistance of the trending chanel, I am not part of the move.