$LTO/USDT Binance 4H by imRedaSouhail.What Is LTO Network (LTO)?
LTO Network is a hybrid blockchain platform for decentralized workflows and business process automatization. Thanks to a solution based on live contracts, companies can enter into and carry out transactions, exchange information with each other, organize supply chains, delegate data processing and more, simultaneously and without relying on trust.
LTO Network, formerly known as LegalThings One, was established in May 2014 as a subsidiary of Firm24. For several years the main goal of the project has been to implement simple legal transactions on the blockchain. Conceptually, it is based on the interaction between private and public blockchains.
LTO Network provides the following kinds of assistance: the facilitation and control of the entire transaction process, the exchange of information between parties, the creation of business supply chains and the secure transfer of data to third parties.
By removing the need to depend on the human factor in business transactions, LTO Network is expected to allow companies to focus on improving the efficiency, transparency and security of their business.
LTOUSDT

Lto - Long LtoNetwork dropped more than most of the shitcoins despite not being a shitcoin... despite being one of rare projects that has real usage, real revenue, real customers. You could be mad like I am, but we are given a new opportunity. And that is great! Lto dropped more than 80 percent in price since ath. I think price could reach 3$ till the end of the year. At this time I don't believe we are actually in bear market. I was afraid BTC's price would be slowly dropping, but it was a hard drop and now I feel quite relieved. Be careful about most of the projects though. They grew too fast during this bull cycle. Another opportunity is vidt (lto is owner)

Note to My Self:LTOBTCEnter:
Under 915-
Deep under 857-
'LTO / BTC', which exhibits a harmonic movement in the expanding channel range, will reach the level of 2.B and finally the highest channel point, 2175, after breaking the 1.A resistance zone, if BTC maintains its stability.
Don't forget to be S / L. %10-15
Not financial advice.

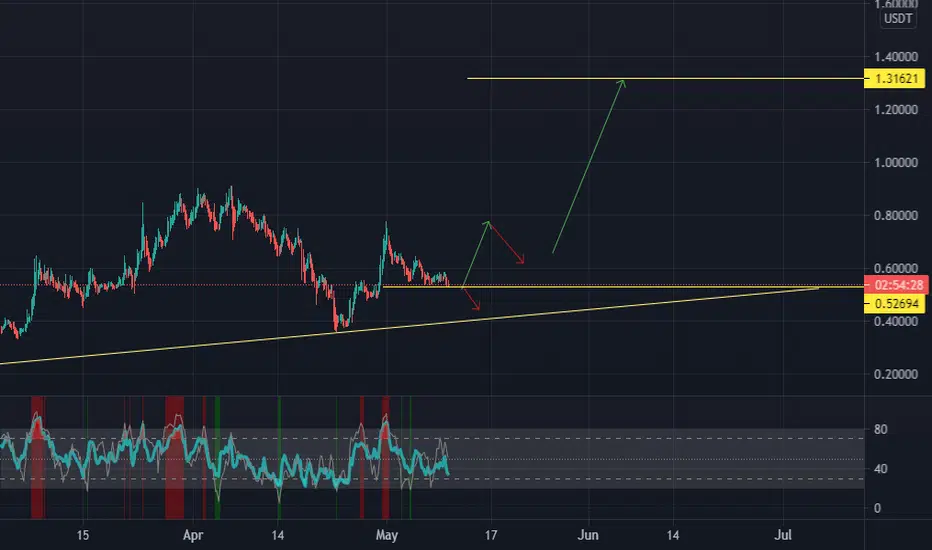
LTO Update: Touched red trend line and broke downtrend.Update on LTO:
As stated a few days ago, it was clear that the price wanted to touch the highlighted red trend line. After doing that, it broke the current downtrend and is ready for some upward movement. Any entry point below 0.5 is golden imho.
Pay close attention to the newly formed uptrend bottom line, if it’s broken, then i’m pretty sure it will retest the red line again.
Good luck, and stay safe!
Not financial advice.


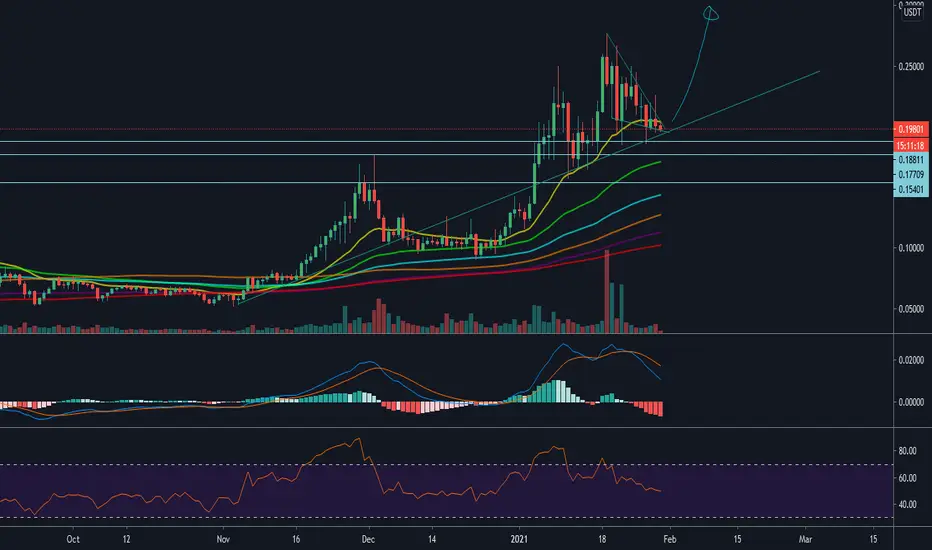
LTOUSDTthis alt has corrected almost all (most of the times more than 78.6% retracement) of its value
if you zoom and go to the lower time frames you can see the last 2 cycles are strongly in favor of bulls which corrected as mentioned which means they are getting ready for higher jump and higher values ,new records and new ATH
👉This idea has the confirmation of "advanced price action"
👉For more information don't be shy and get in private chat of trading view
👉Hit share and spread the information in public chats or your twitter for everybody to get profit


LTOUSDTLTO looking good here! bounce of trend support and 0.382 key Fib level after Dumping from 0.90 cent to 30% almost 60% drop.
Stoch RSI bullish cross. RSI bounce of oversold territory
Ideal entry 0.44 -0.46 cent or deeper.

LTO/USDT Signs of a new impulsive move incoming Price is at a daily institutional order block, .618 Fib retracement of the whole range up and 2.618 extension level of the first wave down at the daily chart. Price broke broke downwards trend so this may be the start of a massive impulsive move up.

LTO Buy Opportunity Soon (fixed)Fixing my idea since the original wasn't clear. LTO uptrend has been respecting the 0.382 retracement level with a hammer forming at the time of publishing this. This means we're rejecting lower prices and is bullish. Watch for a candle close like this or higher for confirmation. This doesn't mean that we will immediately begin to start the next push to ATH, but we will likely see a bounce between here and our volume area of resistance which I posted before -
If the trend remains at its current strength, our next push should be to around $1.12. Just remember this doesn't mean that we'll begin pushing there now, this is just a chance to buy at the lowest dip in its current state. A candle close below the 0.382 will also likely mean we're seeing a reversal pattern.

LTO Buying OpportunityPosting this so people have an idea of what to look for since this could be a great time to buy LTO.
We're currently making a perfect 50% retracement along with touching our yellow upward trend line (anchored vwap). Watch for a green close above these levels for confirmation they'll act as support (I'll be adding more to my position if this happens). Expect to bounce between that support and the green box (volume level) until we see a close above our down trend (anchored vwap). This will likely mean we're making attempts towards the ATH. What's important is we want a slow staircase beyond that level, not a strong upward movement past it which will likely be a false break.
What we don't want to see is a break to the red circle which will likely mean a fall to .53 cents. From here it's iffy whether or not we'll resume an uptrend, but I'm optimistic :)

LTO Trading Setup - Hasn't taken off yetHere's a quick look at LTO 1 hr chart. The price action has been forming a falling wedge and broke out recently. Watch for a breakout from the level shown in the chart.
The idea is: Buy the breakout from the Symmetrical triangle shown in the chart. Take profits at the level shown in the chart.
Targets:
1. 0.577$
2. 0.6$
3. 0.64$
Follow me for daily trading setups - Telegram group coming soon...
BTC dictates the market. If BTC falls, then Alts will fall as well. BTC needs to get stable before alts can run. Trade safe!

POA trading opportunityPOA another budget coin on @binance. Forming cup and handle. Buy over resistance line. Sell with 100% (1st goal) profit. Stay careful.


LTOUSDT Technical AnalysisAs you can see resistance of 0.275 broken and now it's a support level. a good opportunity to buy at this level.
Remember: I'm not giving financial advice
What's your opinion about this?
Comment down below

VIDT - disappointment in this bull run??? VIDT has been disappointment these weeks since all alts have been booming. But not vidt. oversold 1h 4h 1d 1w. Most probable scenario is that it will bounce up from this levels. Long term hold recommended. Enjoy

TCT - Token Club trading opportunity Another low/budget coin from @binance that hasn't been pumped yet. 1W rsi oversold, so it's quite safe to buy it either-way. trade carefully.

LTOUSDT (LTO) - POSSIBLE PRICE ACTIONS ANALYSIS 🔎
- LTOUSDT is building up in a descending triangle pattern.
- A relatively big move is imminent.
POSSIBLE PRICE ACTIONS
- Uptrend ⬆️: breakout above the descending triangle's inclined resistance.
-Downtrend ⬇️: breakdown below the descending triangle's horizontal support.
TARGETS 🎯
- Uptrend ⬆️: horizontal resistance levels (R1, R2, R3).
- Downtrend ⬇️: fibonacci extension levels.

Shitcoin Small love potion (SLP) trading opportunity This is probably coin with smallest mc on @binance. In my opinion it's gonna be pumped really hard in near future. Goals are set very modestly :) Remember, this is shit(coin)

LTO is volatile but bullish in long termeverything is explained on the chart. if you're a pro, you can daytrade in 1 hr chart... be cautious that buy and sell zones need to have high volume. LTO is not synchronized with the other market pairs.
follow and comment to support and receive more TAs.
