Buying LTO hereBuying LTO spot here, stop-loss when the price crossed below the trendline
Easy Trading Indicator for Beginners
When the ema1 crosses above ema2, the area will be painted GREEN in color, and a BUY signal will appear. = BUY
When the ema1 crosses below ema2, the area will be painted RED in color, and a SELL signal will appear. = SELL
Area painted with ORANGE color means ready for flipping your position or take profit from your current position
LTOUSDT

LTOUSDTA volume diversion bar has formed on the daily chart. Fractal is above the 13ema and price has pushed into the high/low 5ema channel without crossing the high. Price is above the 200ema and RSI above 50, which tells us this is an up-trending market. The first target is the last fractal high or a volume diversion bar to the downside. A stop will be placed below the prior daily candle 13-01-2021. Enter on today's candle 14-01-2021. Good luck!


LTO Network Longterm ChartLTO Network is picking up some pace since the lows (BTCValue) of last months (which had to do with the ATH of Bitcoin).
Volume is picking up, RSI looks good and MACD crossover is bullish as well.
Fundamental wise its attracting a lot of new investors and I expect LTO Network to break its previous ATH in Bitcoin value (Sat.)
*There is also a bullish triangle ongoing at the moment which can be spotted easily at the lower timeframes (1H or 4H charts) .
Lets see and review this chart over a few weeks again.


LTO! LTO is at a very interesting point with both BTC & USDT.
LTO forming inverse head & shoulders with BTC & being squished in a falling wedge with USDT
Breakouts from key areas mentioned below will signal a very strong rally


LTO.USDT (Y20.P5.E1).Stalkingref.x.charts.
Hi,
This has a nice trend and its pulling back nicely to a previous support with confluences to the MA\FIB and convergent.
Looking for a bullish candle in the 8 hrs or a combination of bullish candles or structure in the lower time frame that makes up the 8 hrly candle.
All the best,
S.SAri
2 hrly time frame.

LTO NETWORK Anytime Breakout - LTOBTC LTOUSDT LTOUSD LTOBNBLTO NETWORK Anytime Breakout - LTOBTC LTOUSDT LTOUSD LTOBNB

Ascending TriangleLooks like an ascending triangle formation on LTO is forming, the breakout is incoming.

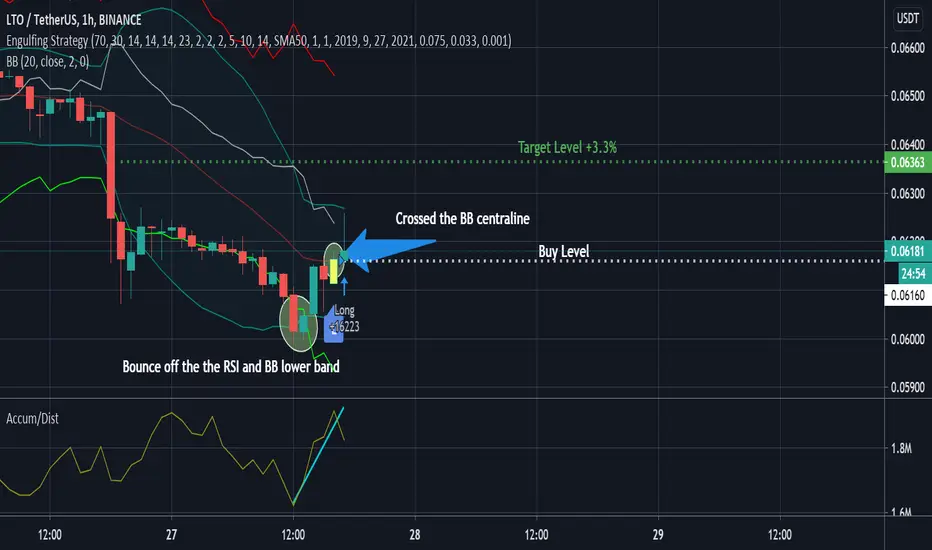
LTOUSDT Engulfing SignalToday, our Automatic Engulfing Strategy executed the long position for the LTOUSDT as a result of revealed potential price growth.
The Accumulation/Distribution Indicator demonstrates the increasing bullish activity. The price bounced off the RSI and BB support lines, which means the trend reverse. The uptrend is also confirmed by the intersection of the BB centraline.
As a result, we expect the 3.3% price growth from 0.06162 to 0.06365. The alert was automatically executed by SkyRock Signals trading bot.
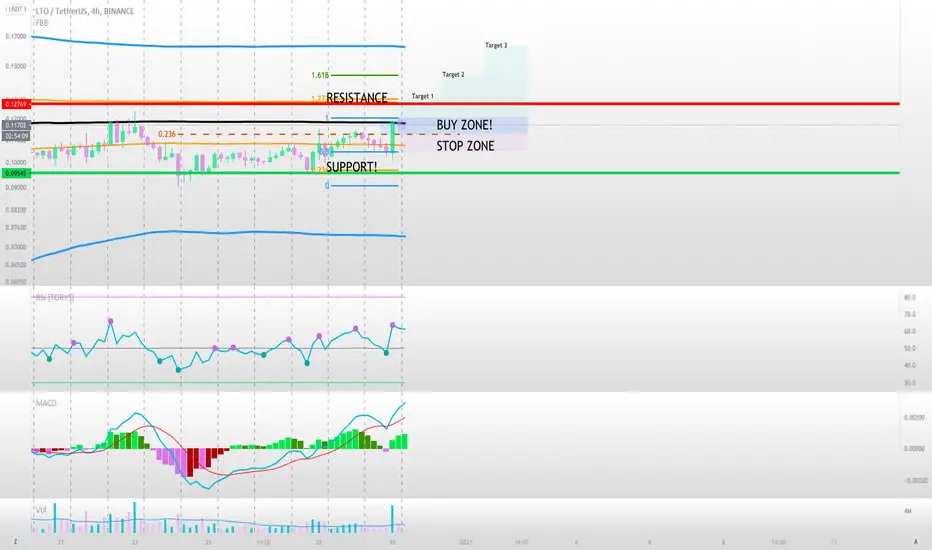
LTOUSDT AnalysisAt the moment, there are 3 sell signals present and I'm BEARISH.
So, I don't think this is a good time to buy.
If you want to buy again, we have 4 different options.
1- You can wait for EngineeringRobo's BUY signals to be present,
2- You can wait for candles to open-close above resistance level (0.11) for 1D to buy,
3- You can buy when candles touching the support line (0.055)
4- You can buy when candles open-close above up trend line.
After you buy, please watch out for EngineeringRobo's sell signals and consider selling it.

LTOUSDT Intraday Trading OpportunityDear Subscribers,
Technical analysis with the Automatic Engulfing Strategy revealed the price reverse opportunity from the downtrend to uptrend.
On the one hand, the increased bullish pressure is confirmed by Ichimoku Cloud Indicator. On the other hand, the price has a bounce off the support RSI line after the dramatic decline.
As a result, We expect the 3.3% price growth from 0.06372 to 0.06582. The alert was automatically executed by SkyRock Signals trading bot.

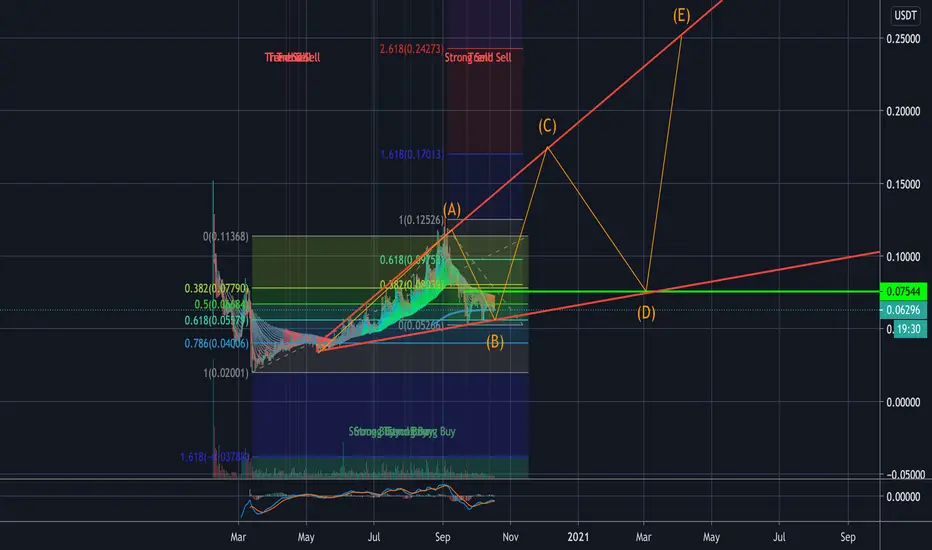
Possible LTO Expanding TrianglePossible Long term play for LTO, looks like an expanding triangle is happening, interested to see how this plays out.
LTOBTC - Consolidation mode It has withstood the recent market fluctuations and is now in a sideway correction. These show that it is strong and has good growth potential.

LTO/BTC (Retest Recent Key Support?)💎Technical Analysis Summary💎
BINANCE: LTOBTC
-The small rally from 510s sat has ended after a Double Top reversal
-This downfall will likely to retest previous key support area
-If LTO can from another base of support within the next few weeks
-There is a chance it may challenge to break the recent top
-This is a long process so being patient is very important
-I suggest studying the chart when there are no trading opportunities
A big Thanks for donating 💰 via Tradingview coins this week to billstenzel 🙏🎉
``````````````````````````````````````````````
Trading Involves High Risk ⚠️
Not Financial Advice 💸
Please Exercise Risk Management 💱
``````````````````````````````````````````````
If You Like My Daily Published Ideas 👍
A little Help By Supporting My Channel 📺
Through Leaving A Thumbs Up, Comment & Follow 💬
Happy Trading! ➡️ Thank You! 😊
``````````````````````````````````````````````


LTO Bearish caseIf you like my TA or other ideas, please leave a like to show support. It helps me out a lot
-------------------------------------------------------------------
- Resistance around 725 sats
- Strong Bearish divergence on the RSI
- Possible H&S pattern forming
Target: 525 sats zone

LTO bounces and next leg up!A bounce from the 200 Day MA & Golden pocket from the 61.8 FIB retrace, plus MACD turning to bullish on the daily... good things are coming for LTO.

LTOUSDTHi to all traders!
The chart is clear enough and well explanatory.
IF You Agree Hit The Like Bottom And Support Me.
The Information Provided Is Not Trading Advice But An Informative Analysis Of The Price Movement.
