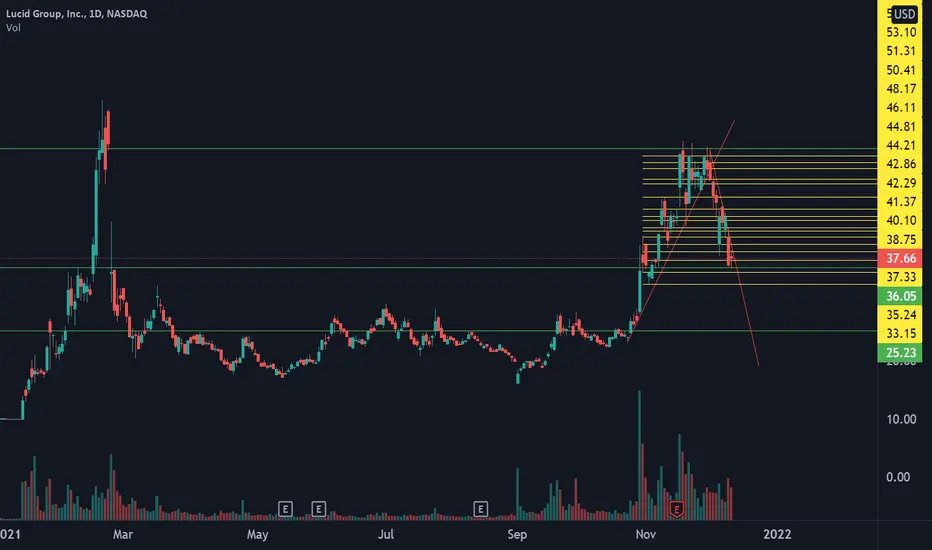
Potential Swing Idea - $LCIDPreferred instrument: common shares
Entry: 35.80 - 36.90
SL 1: $35.75
SL 2: $33
PT 1: $45
PT 2: $52
PT 3: $72
Potential wave 5 setup from Sept 1 low.
If 33 does not hold, next major support is 23-27
Lucid

LCID Lucid Group like AMC Entertainment in May Welcome to my extensive and detailed technical analysis of Lucid Group ( LCID ).
Lucid Group caught my eye because of its similarity to AMC Entertainment in May 2021.
A comparison I show at the end of this analysis.
This analysis is very extensive and detailed and I show several bullish formations in the most diverse time windows.
The following time windows are discussed:
Weekly Chart
Four hours chart
Hourly Chart
To each analysis there will be a linked idea, so there is the possibility to judge individual analyses retrospectively using the play button function at TradingView (timestamp).
Let's start.
1. weekly chart
In the weekly chart, we can see and project different bullish patterns.
As seen in this analysis, a W formation has formed (white lines), which is currently in a so-called retest.
This retest can trigger a correction phase that can continue to the Fibonacci lines 0.236, 0.382, 0.618 and maximum to 0.786.
Typically, corrections are made to 0.236, 0.382.
The formation becomes invalid only when the price falls below the lowest point of the W formation.
The target of this formation can be divided into three targets.
Target 1 measured from the middle high to the "neckline".
Target 2 measured from the Left Low to the "Neckline".
Target 3 measured from the right low to the "neckline".
Thus, the following price targets result from this formation: (purple lines)
Target 1 53.54 USD
Target 2 66.13 USD
Target 3 76.05 USD
What is exciting here is that the chart at 64.82 USD, similar to AMC Entertainment back then can form a Superior W Formation, with targets of: (Blue lines)
100.08 USD
112.49 USD
113.58 USD
If one takes the trend-based Fibonacci Extensions to the help, one can determine additional Max targets that could be reached with strong sustained volume, and according to Elliot waves could define the target of wave 3. The targets are here, at the following price values: (Yellow lines)
159.66 USD
214.49 USD
248.38 USD
2. four hours chart
In the four-hour chart, we can see an Inverted Shoulder Head Shoulder Formation, which has already reached its target of 41.41 USD.
An Inverted Shoulder Head Shoulder Formation is a sign of a trend reversal and hereby signals us the end of the correction phase that has lasted since 18.02.2021.
After reaching the target and a subsequent correction phase, the price very often rises back to the price target of the Inverted SKS (Superior Retest of the W Formation from the weekly chart) and continues the upward movement.
3. hourly chart
In the hourly chart, we see a Bearish SKS that has its target at 30.33USD. (0.382 Fibonacci area from the weekly chart).
Overarching the possibility exists that a harmonic pattern is formed ( Gartley Formation ).
The Gartley Formation is to be considered as a trend-following pattern and gives the following price targets from point D ( 30.62 USD ): (Blue lines)
Target 1 34.78 USD
Target 2 37.40 USD
Target 3 44.65 USD
All these formations give me personally a good feeling that Lucid Group has a lot of potential upside in the long term.
Finally, I would like to show you a comparison picture to AMC Entertainment, immediately after my analysis at that time, the price of AMC Entertainment rose impulsively to the current all-time high at 77.30USD.
If you liked this idea, I would appreciate a click on the Like button ;)
If you have any questions, suggestions or a different opinion, don't be afraid to use the comment function.
Thanks a lot
Disclaimer:
Please keep in mind that this is a pure analysis and only reflects what my eye shows me ;)
This analysis is for informational purposes only and is scientific in nature.
This analysis is not based on any fundamental data!
This analysis is not an investment advice and should not be considered as a buy, sell or hold signal.
Always do your own research before investing and seek the advice of a qualified person.
I am not an investment advisor or similar and do not make any investment recommendations here.

LCID Bearish Bat Pattern formationTrade breakdown:
1. Buy after price breaks $42.55 with stop-loss around $38.
2. PT @ $51.60.
Good luck!

LCID price forecastingBase on wave counting, it seems that price in range $31 - $33 will be the end of 5th wave and first wave will be completed. It will be a good chance to buy in that range before second wave start it's rally to upper prices.

[stock] Lucid - LCID - Next Bullish Wave?Lucid - LCID - Ready for the Next Bullish Wave? We will see? Edutainment Purposes Only!

LCID TECHNICAL ANALYSIS lcid is forming a cup and handle pattern on the daily.
if the trendline breaks, we may see a strong move.
hoping for the pattern to follow on through or hint to wanting to do so within the next two weeks.
i know it's a bit hard to see because u am trying something different with marking levels.
feel free to give and/or suggest advice on anything.
LCID TO NEW ATH LCID TO NEW ATH
chart is clear ,
4th wave regular flat
clear 5 wave ..
Divergence between 2 & 4
so ,
new ATH just a matter of time .

LCID is about to breakdownI believe LUCID will go beyond $60, but not now. Fib zone 0.382 - $45.12 is being the resistance, tested with very low volume. RSI and moving averages are suppressing the movement. $35-36 area needs to be visited before another run to $50's

LCID: Watch for a possible reversal pattern!Hello traders and investors! Let’s analyze LCID today! I’ve been analyzing during my videos on YouTube, but this is the first time I write about it here on TradingView. I hope you’ll find something useful.
First, in the 1h chart, LCID is clearly in a bear trend. We have a series of lower highs/lows, and the 21 ema is above the price, pointing down, potentially working as a resistance today, as it couldn’t break it during the first hour.
In order for LCID to reverse, we must see it breaking the 21 ema, and doing a bullish structure, preferably, a higher high from here, followed by a higher low.
What’s more, if LCID is about to reverse, now is a good time. We don’t see any confirmation yet, but we are just above a support level, which is better seen from the daily chart:
Yesterday, we had a very strong bullish candlestick, with decent volume, just above the $ 39.27, the previous support level. The only problem here is the 21 ema again, which is also working as a resistance. It is worth to notice that the 21 ema in the daily chart is almost at the same price seen in the 1h chart, something not that common to happen, making it a dual-resistance in different time-frames.
This candlestick pattern alone might be a buy sign for many, as the risk/reward ratio is making sense, in my view. I just prefer to see a better bullish structure in the 1h chart first.
Let’s see how it’ll play next. If you liked this analysis, remember to follow me to keep in touch with my daily updates on stocks and indices!
Have a good day.

$lcid #stock #short under investigation by #sec to 50DMA to $36said it received a subpoena from the Securities and Exchange Commission related to the deal that took the electric-vehicle company public this summer.
The Newark, Calif., startup is the latest electric-vehicle maker to draw the scrutiny of federal regulators, which comes as the SEC is taking a harder look at the optimistic revenue projections used by young businesses that have merged with special-purpose acquisition companies, or SPACs.
The burgeoning electric-vehicle industry has caught the attention of investors, but also federal regulators, with several of them the subject of investigations. In March, Lordstown Motors Corp. said it was cooperating with the SEC to provide information it requested. In September
lcid has the same #market cap with f ford. it is crazy… #ucidmotors is a bubble right now..
It will reach at least $36 the 50dma …
short position and here except dwac

$LCID Potential buy entry at 42.59As per the Chart Analysis and Spartan AI - We expect $LCID to hit $42.59 and this could be a potential long term buy entry in this.

LUCID GROUP Will Keep Growing! Buy!
Hello,Traders!
LCID stock is trading in an uptrend
And the pair, which is trading
In a rising opening wedge pattern
Has retested a rising support of the wedge
And showed a bullish reaction
So all the signals point in one direction
And I think that the growth will continue
Untill the pair retets the all-time-high resistance
Buy!
Like, comment and subscribe to boost your trading!
See other ideas below too!

$NIO | 11/25 | Watchlist #2 $NVDA +$43
(Over $43 for calls)
Price targets: $44, $44.8
Technical analysis:
- Cup and handle on the hourly chart

11/21/21 LCIDLucid Group, Inc. ( NASDAQ:LCID )
Sector: Consumer Durables (Motor Vehicles)
Current Price: $55.21
Breakout price trigger: $57.50
Buy Zone (Top/Bottom Range): $52.50-$47.90
Price Target: $64.70-$66.00
Estimated Duration to Target: 17-21d
Contract of Interest: $LCID 12/17/21 60c, $LCID 12/17/21 65c
Trade price as of publish date: $5.80/contract, $4.50/contract

$TSLA | Watchlist #2 | (11/22-11/24) $TSLA +$1150
(Over $1150 for calls)
Price targets: $1160, $1170, $1175
Technical analysis:
- Double bottom off pivot
- cup & handle formation on the hourly chart

$LCID Lucid Motors TA - Upcoming Week$LCID Lucid Motors TA and what to expect in upcoming week:
RECAP:
- We can see that Lucid Motors has broken the Resistance line and reversed from the $58/s range.
- Stock after correction bounced at the $42/s range and rose back to $55/s range last week.
- There was an RSI Divergence followed by a large price correction.
- REMEMBER always look out for RSI Divergencies.
- If you follow me I will always lay out the RSI Divergencies when I see them and publish it right away.
NOTES:
- IMPORTANT: Keep an eye on the $50 level range, as it is very important:
-- IF the stock bounces off the $50 level range, it will up-trend towards $58-$60/s range.
-- IF the stock BREAKS the $50 level range it will down-trend towards the next bounce at the $42/s
FUNDEMENTALS:
- We typically do not do any FA here, but very important to note that right now stock futures are -200pnts as I write this.

LCID94$ PT on LCID if it can continue strong and break above it's past highs.
LCID and TSLA should remain strong along with names like FSR , F , XPEV
Not too confident on NIO yet.

#LUCID Cup and Handle formation $71 #lucid long term Cup and Handle pattern prepping for long term target of $71 followed by $99.

$LCID $50 C 11/26 *SWING*$LCID +$50 C 11/26 *SWING*
will be holding this position for a few days
Price targets: $50, $51
Technical Analysis:
Break over hourly supply
C = calls
17k open interest on LCID $50 C 11/26 C
23k open interest on LCID $51 11/26 C

Cup and Handle on LCID (Lucid) to play out? Scenario 1 - Biggest thing to note is the cup and handle playing out on the larger timeframe.
This is a more likely scenario bc it could utilize the .382 retracement.
Although historically an ultimate rejection and retracement after a huge bull run gave us the .75 retrace.
This would be scenario 2, a retrace to the blue fan line. This is an ultimate reversal indication.
The green arrow is not drawn in time scale. This is the handle of the cup (possibly) in scenario 1.
A retrace to the .75 would be a possible buy zone to me unless the reason for retrace was extreme bad news for the company
and it was obvious capitulation. In scenario 2 a bounce off the lower 30s with confirmation would be a possible buy zone as well.
Or scenario 3 this thing just rips and rips. If that then I scratch all this and move on for now. Please critique me!

Lucid Ponzied - Double Topped BlowOff - EV Mania - SellSign of the times. Everything rally has expired weeks ago and morphed into what goes up must go up some more. What used to go up, better go up some more. Not how it works. The US5Y is rippin' with the US10Y. Go small cap gems.
#valueinvesting
#cannabisreform
#statesreformact
Historic Bi Partisan Justice Reform. $KERN has the compliance DATA.
GL
Welcome to the #metaverse future. Go #bravebrowser

LCID, very likely, would continue to rise until 52.04helo dear investors
As long as it is above the green line (level which tells the story (21.93) LCID is to be bought, it seems that the level 37.58 (level 0.5 fibo) is broken with force, so LCID, very likely, would continue to rise until 52.04.
Note that a good coincidence has occurred in this fibo and rectangle retracement, it is that the probable amplitude equals the same price of the red rectangle resistance and the 0.236 level of fibonacci (target 2).
i wish have reason but as we said it upto the market to decide if we will have it or no.
NB: a good signal had accured 28 oct 2021 that break out very strong (big buyer volume) and LCID is above the historical line

$LCID UP TREND TO $48/S$LCID Lucid Motors Up Trend Analysis
BREAK DOWN:
- As we see here LCID has bounced off the support line and is in up trend momentum.
- Despite seeing few RSI Divergence as shown on the graph followed by price correction, the stock is heading towards $48
- IF $LCID breaks the resistance line IT WILL CONTINUE upwards. The resistance line will now become new SUPPORT line.
KEEP AN EYE:
- On any RSI Divergence followed by price corrections to buy the stock at lower price
- The stock will break the Resistance line and continue up trend.
