Do Kwon discusses LUNA 2.0 And LUNA LOOKS TO HAVE NEW MOON!Dear traders,
Last there are adding a new video from Do kwon talking about the new Luna 2.0, and on this video he trying to explain also what happened. ( interesting to watch) just uploading some days ago. on this view it looks he still behind the project and want to do all to make it great again.
Before you go further with reading this article know that Trading in any coin could be very risk, and this all are not trading fiancé advice.
Are we going to enter a new huge hype on Luna what could bring the price above 2 usd, and from there to even 5 usd.
This could happen if the real change are coming where do kwon talking about - but same time there should be some trust back - so don't expect to fast increase - and increasing could take time.
Luna 2.0 have more chance to have more effect than luna classic.
One things is depending on TA important - and that's luna seeing new increases moving depending on structure volume trend, what this means the coming days will show the effect.
LUNA 2.0 is interesting to watch out coming time.
Nice time.
LUNA

LUNA - 58% BREAKOUT EXPECTING TARGETDear traders,
Luna seems to enter new breakout movement, this depending on the last data.
Long time ago we have seen not much more trends on Luna - but since this week - Luna looks to make some new volume structure - what means there is a high chance for a breakout.
WE will follow it, and see coming time where it can go .
If it go depending the expecting plan, then Luna could enter into new small hype - what could bring the coin above 2,40 and with the target 58% increase.
# know that this is not a hodl update - as there should be high risk management on any investment, and this is also not a trading advice.
Its 100% personally expecting.

LUNA UPDATE WITH CHANCE OF BREAKOUT AND THIS IS WHYDear friends,
First of all before starting this update - know that investing in Luna are very risky, this update means not that you should invest depending what it expect - do always your study fine. the below study depending on personally expecting.
The new luna did shows since start an increase - since that moment it did return 1,60 and below.
Today there is some changed into the chart depending on TA - and it seems Luna are going to show some effects - why this are i personally even don't know, but the thing it shows that the volume getting up with some structure trends. this could means that it can end into a whale update, as we have seen before with other coins.
Luna is not the best coin to have or to hodl - but if there are trading chances it could be an option.
If the plan going as it should go - we will have a focus on at last 30% price action change. with possibility the price return back over 2 usd.
This channel made to scan breakouts, lets see or there are coming what for Luna coming time.
This is not a trading advice - as there is no guaranty into markets.
The goal of this channel to scan the possibility increase coins - and to get the breakout view.

LUNA/USDT ----> TUTORIAL (when and why take position ) HI guys we have some questions and now answer that. if you have any idea , you can comment .
answers:
1 and 2 : if we had a strong sell movement it couldn't brake it without any react !! and now if it had broken it would pullback on that level.
(caution : the price goes everywhere finally it has to ( again i repeat it : it has to) pullback that level. and why it has to pull back you must find answer on supply and demand orders.
3: when you have strong movement it hasn't enough time to settled price level but anyway it settle on another time.
4:thats joking if you think Russian or Ukraine people buy and price grows whenever other currency were approximately constant. the answer is exchanger and market makers. but why? they are take profit with 2 strategy. one ,take profit with liquid novice trader with raising unexpected price for many times . two ,they bought on 40$ level and now price is above 90$ so they need time to sell. and they may make another trap for trader they brake the highest historical price and when novice traders were trapped exchanger and professional trader take sell position.
conclusion :
when you see enough reasons for take buy position or sell position and price have enough distance from your levels find entry situation and DONT FORGET MONEYMANAGEMENT then take a your position that's not important after that price go where you just need money management and wait.
be profitable.

GALA / USDT WEEKLY BUY SIGNAL!!!!!!!Gala approaching a very important resistance, if we break this to the upside we’ll see a price of 0,36 max.
Goodluck and DYOR!!!

Luna Classic Low Volatility Break outLow Volatility leading to a strong break out in the first situation
We are now experiencing low volatility on a larger scale
Waiting for break out

SOLUSDT:Trade Close:Target ReachedHello friends
.Update analysis
..Trade Close:Target Reached
.tp: 24 %
📢.New Analysis
.The price is now at the overlap of the static resistance and the midline of the channel
.According to the chart, we have two scenarios:
(1). The first scenario of price correction
.(2) The second scenario of resistance failure
..You can view and compare the attached chart and analysis
..Follow me to see more analysis

Long Trade(BTC)Keeping it super simple here since the 4hour MACD has been calling these moves pretty well so far.
Price setting up like last three swings so we get the cross we long simple , target CME gap 29k.

Ending Diagonal
As shown in figure, the ending diagonal is a subdivision of wave C in a zigzag. the trend at this point is unmistakable.
I still stand by my old target $ 0.1 ($ 0.2)

ANCUSD Seems Ready to Recover 50%-61.8% of it's Crash Losses.A few months ago every tradable asset associated with the Terra Ecosystem had major crash and Anchor Protocol was one of the assets affected. Since then ANC has been sitting here at these lows forming Bullish Divergence on the RSI and the MACD is refusing to turn negative as ANC Trades within this price range despite the steadily declining price. I believe that based off this ANC is signaling to us that it is ready to recover much of it's losses and my targets will be the 50% Retracement and the 61.8% Retracement.

LunaUSDT | Trend correction in the upward movementMy opinion is, JUST take buy trade for the next 24 hours.


Bitcoin has just entered a bullish cycle. The trend and indicatoBitcoin has just entered a bullish cycle. The trend and indicators and volumes have shifted to buy.

Luna classic descending triangle targetThe following is a luna classic update, I expect the coin to fall to that given level 7700 crossing the yellow resistance above1100 would be a bullish scenario.


Monday short with a high probability Monday short with a high probability vision of professional trader

LUNCBUSD RALLY UPDATERE: My June 16 2022 Post Titled - LUNCBUSD- NEW CYCLE UNDERWAY!
decline from June 29th high is rather corrective than impulsive looking like a zigzag 5-3-5
Price above June 29th high of 0.00016663 would suggest resumption of uptrend
Please drop in comment section any instrument you would want me to do a wave count for.
Disclaimer: We accepts no liability whatsoever for any loss or damage that may result, directly or indirectly, from any forecast or opinion, information or omission, whether negligent or otherwise, within this report

LUNCUSDT - 18% potencial profitLUNCUSDT - 18% potencial profit. .................................................................

MY MINIMALIST CHART ANALYSIS FOR $TERRA$LUNA
On a 4HR Chart
SHORT POSITION
06.30..22
1025H +8 SINGAPORE
Disclaimer:
The findings of the following analysis are the sole opinions of the publisher of this idea and should not be taken as a piece of investment advice.
My Published Ideas are not 100% Accurate. There are many factors at a given time that can change the forecast.
ALERT:
My Bearish Bias: All white price notes are possible entries depending on future price action.
Based on VITAL SIGNS ( RSI, STOCH, VOL., MA VOL.) Looks healthy and is on a reversal of a trend.
Bitcoin is still bearish at this moment, but on a weekly, it has compressed too much and is about to reverse. Maybe we see a bull trap to further push it down or not. (See linked chart for $BTC)
1. We may see it climb further to 0.0007667 zone a FIB reversal, depending on the closing of the bar on its FIB retracement.
2. Trading ranges may develop between 0.00007478 - 0.00016300 before pushing upward, beyond our maximized target in the next few months.
3. Probable back to 0.00004226 trading ranges will take effect as smart money will try to wash out and rinse all the long positions after a bull trap on its way down.
4. Bitcoin is still bearish at this moment, but on a weekly, it has compressed too much and is about to reverse. Maybe we see a bull trap to further push it down or not. (See linked chart for $BTC)
Hoping that this BENTO BOX CHART ANALYSIS will efficiently help you with your DYOR as we Enter a NEW SWING CYCLE for LONG positions, either short, mid, or long term.
INSTRUCTIONS:
HOW TO USE THIS MINIMALIST CHART a.k.a (Bento Box)
"Follow the white rabbit!"
Just Follow the TOPS and BOTTOMS of the BOXES as a GUIDE to where the MARKET will take you.
TARGET ZONE IDENTIFICATION:
The LARGE BOXES (Tops and Bottoms) are MAJOR turning points that will occur sometime in the future. While the SMALL BOXES (Tops and Bottoms) are MINOR turning points.
These can be entries to a BUY/ SELL POSITION, EXIT/PARTIAL EXIT/TOP-UP AREAS, as well as Support and resistance levels
Also includes MAXIMUM TARGET EXIT AREA OF VALUE - CONSERVATIVE (If price action conditions are right at that given moment.)
If it cannot break a TOP or BOTTOM of a BOX, It signifies a reversal.
NOTE:
1. That PRICE TARGETS for ENTRY and EXITS are DYNAMIC and can CHANGE from time to time.
2. Created on a MONTHLY, WEEKLY & DAILY Analysis of a MARKET'S CHARACTER.
3. My BENTO BOXES are designed for SWING TRADES at the LOWEST or START of a SWING CYCLE.
4. At times I will include a WAY BEYOND PARABOLIC PRICE TARGET, depending on The Character of the Market (CRYPTOS ONLY).
5. DYOR for your Fundamentals, Volume, Chart Patterns, Candlestick Math, FIB COILS ( ABC ), Price Action, FIB LEVELS, Market Dynamics, AB=CD Pattern especially institutional and retailer trading psychology .
Wishing you all The Best Trades and Thank you all for your Appreciation and Support of My Work.
Much thanks to My 3 Mentors. They are so much of a Blessing that I also wish to share my knowledge.
Vive Le Autist!
Vive Le Diamond Hands!


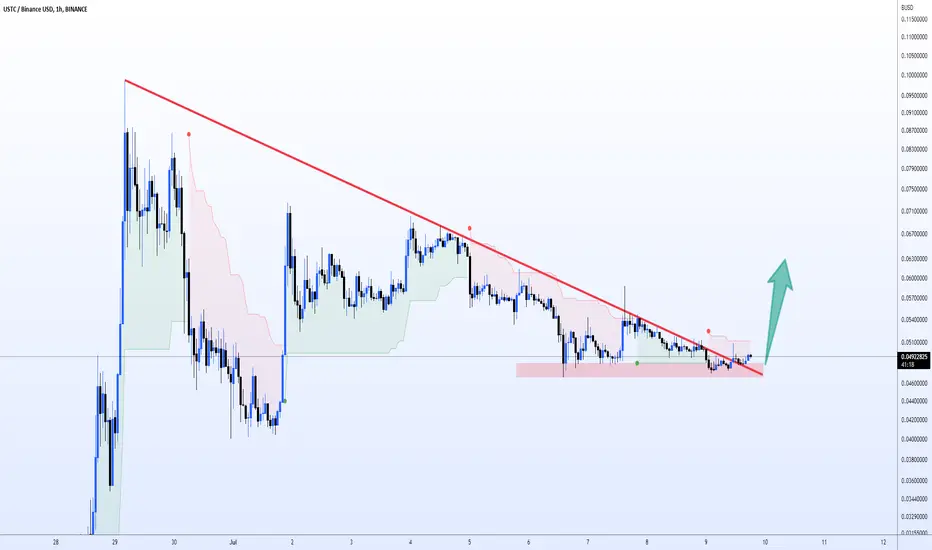
$USTC : Bullish continuation Soon?USTC Had an insane rally in the past week and is currently now in a bullish pennant. Now the price broke out and retested toe broken red resistance line and i am Expecting continuation of the bullish momentum.
Also, No wonders if we see some more sideways before the uptrend continuation.
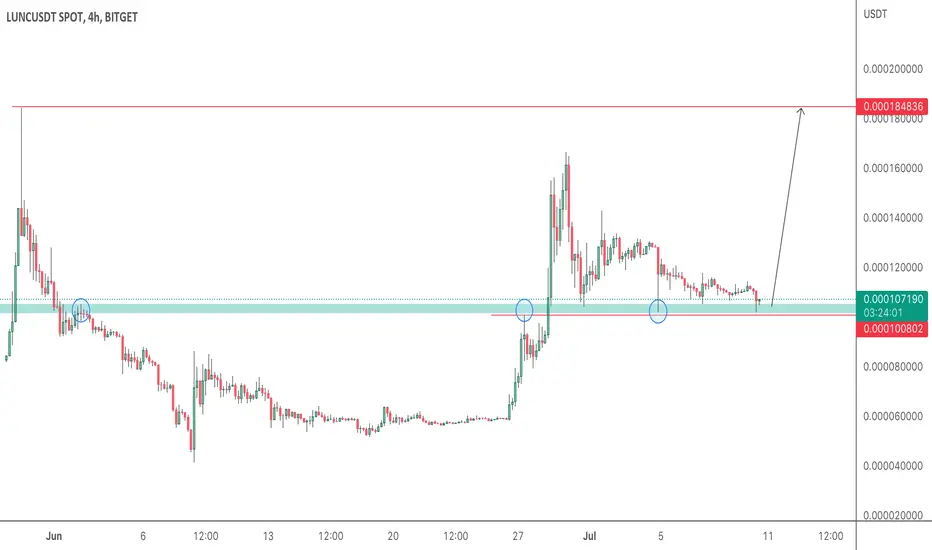
LUNCUSD H4Strong impulse previously to the upside, breaking through resistance to create a higher high. Price has now pulled back & retested broken resistance structure as support, where we see some consolidation taking place. Price could now be preparing to continue the uptrend above this region here for a potential higher high towards the previous all time high.
Luna 2.0 Analyze (Symmetrical Triangle)!!!Luna 2 is running in Symmetrical Triangle and it was able to complete its pullback and I expect that it will go UP .
🔴 Resistance Zone 🔴 & 🟢 Support Zone 🟢 that we have in front of Luna 2 .
🔴 Resistance Zone 🔴: 2.38$ until 2.34$
🟢 Support Zone 🟢: 2.05$ until 2.00$
Terra Analyze ( LUNAUSDT ) Timeframe 30 min⏰ (Log Scale)
❗️ Note ❗️: Please just invest 1%_max 4% of your fund in this project at this time.
Do not forget to put Stop loss for your positions (For every position you want to open).
Please follow your strategy , this is just my idea, and I will be glad to see your ideas in this post.
Please do not forget the ✅' like '✅ button 🙏😊 & Share it with your friends; thanks, and Trade safe.
