EGLD / USDT hello guys this is my idea about EGLD /USDT
I thing that sellers from this area will be defend this short position..
and when the price come back to this area, strong sellers will be push down the market again...
Downtrend + previous support become resistance + Strong volume area is my mainly reason for this short trade....
Thanks
Rebeng
LUNA

LONG LUNAC GOING TO REVIVEThe bearish trend is ending we have to way rang or up trend in my opinion we have about 80%b

$BTC Bull MACRO - Target Hitweekly breakdown to nearest macro support happened, fed aggressive hike to countered inflation happened, most crypto capitulated, I'm long until macro resistance, highlighted on the swing.

Waves - Another stablecoin disaster ✈️Since downfall of luna Waves stable coin USDN had been suffering a lot.
As project tries to keep it up, looks like they can't stabilize it anymore.
If bitcoin falls lower, WAVES holders may capitulate which will lead to the end of whole ecosystem.
You can try to short on support breakdown with closest target at at least 2$
P.S. Always do your own analysis before a trade. Put a stop loss. Fix profit in parts. Withdraw profits in fiat and reward yourself and your loved ones

ATA - BREAKOUT SCAN - We are now into a point where the most lose their belief in crypto markets, a time of panic, but it's not the first time we have seen this. also before years the same story. on this manage always your risk.
ATA has lost much of its worth since a time ago and it's on the breakdown, also with this new bear market it did more.
It depends also on BTC - but this point could be an important return depending on technical analysis if BTC stays stable or increase - for ATA could this be the reason to have an On the breakout scan depending on the technical analysis we could see coming time a breakout on this coin
This channel is made to make also scan updates for breakouts - and this is one. with time we could see whether this will be done or not - at last, it will stay the market going in the way it goes.
This is not investment advice, know that entering any crypto market is riskier in times of huge volume change.

Luna/Usdt pair Luna technically working with Elliot waves pattern complete and now corrective wave in process and according to this scenario C wave will reached to 5.4. Let's See

LUNCBUSD1-2 formation from low at 0.00005 which is holding up nicely
Ideal entry would be price above wave B with stops below wave c
Trend confirmation for wave 3 would be price moving pass high of wave 1 and a break above the declining channel line about 0.00008.
Disclaimer: We accepts no liability whatsoever for any loss or damage that may result, directly or indirectly, from any forecast or opinion, information or omission, whether negligent or otherwise, within this report

LUNA2.0 trade will be boost up for short term LUNA2.0 trade will be boost up for short term from blue range area as we predicted before. There is one leg up before head down to zero. Trade scenario will completely change as it crosses 50% Fib level which is around $25. We are expecting two mega negative candles then up after long accumulation period.

LUNCBUSDWave 3 takes time to evolve & it’s never the shortest wave
Post crash of LUNA (now classic) and Pre LUNA-genesis correction of LUNABUSD (now LUNCBUSD) has been “complex”
Channel line draw here is based on the fact that labelled wave 2 is “already in place”
Ideal entry would be price above wave B with stops below wave c
Trend confirmation for wave 3 would be price moving pass high of wave 1 and a break above the declining channel line about 0.00008.
Disclaimer: We accepts no liability whatsoever for any loss or damage that may result, directly or indirectly, from any forecast or opinion, information or omission, whether negligent or otherwise, within this report

LUNA is going to drop a lot, where to find a bottom?LUNA is going to drop a lot, where to find a bottom?

Tron is dying? New Luna?😱😱😱Tron dropped 18% and looks like it only accelerates.
It may be connected to problems with it's stablecoin - USDD. At the picture you can see that reserves cover only 90% of supply.
How death spiral may look like?
As people start to sell USDD, USDD will have to sell TRX to keep itself stable, TRX drops in price, reserves become even smaller and so on.
I advise you to be careful with TRX for now and keep your savings in other stablecoins if possible. A lot of people believed LUNA wouldn't fail because it's such a big project but it still happened.

BTCUSDT DailyHi guys , Explain the BTC roadmap that I expect,
👤SecondChanceCrypto
📅13.june .22
⚠️(DYOR)

LUNA technical Or Market sentiment #LUNA Technical Analysis:-
#LUNA 1.0 = 100% Dumped from ATH
#LUNA 2.0 = -90% Down From ATH within 13 Days.
What's TA..?
If hold $2 support then we can see $7 in Coming Days otherwise Ready for #LUNA 3.0

A lot of buyers have come to the party (Exhaustion gap + 600%)Hi everyone.
As shown in the chart, a very sizeable gap in prices is created. what might this be?
Breakaway gap: Breakaway gaps often occur early in a trend (show conviction in the new trend direction).
Runaway gap : A runaway gap is when the price opens significantly higher than the prior close in an established uptrend (S&P500).
Exhaustion gap: exhaustion gap occurs near the end of a trend (An exhaustion gap signals a reversal in trend direction).
A bullish exhaustion gap occurs near the end of a downtrend and is caused by a final group of sellers, who regret not having sold prior*
Tatget= a move equal to the size of the gap (+ 600%)
*A bearish exhaustion gap works exactly the same way but in reverse.


ADA SHORT - MA 50 rejectionShorting here - Rejected at MA 50 on 6/8. Should the rejection continue with a nice profit. Use stop losses and take profits when you are ready.


Terra Analyze (Zigzag Correction)!!!🧐Hi, Luna is running in Zigzag Correction (5-3-5). It completed its main wave A by Leading Expanding Diagonal , and now it wants to find the end of main wave C in the Support Zone (6.5$_6.18$).
Terra Analyze (LUNAUSDT) Timeframe 15min ⏰
The structure of microwave 4 of main wave C can be a Symmetrical Triangle .
🔴 Resistance Zone : 7.63 $ until 7.48 $
🟢 Support Zone : 6.5 $ until 6.18 $
Do not forget to put Stop loss for your positions (For every position that you want to open).
Please follow your strategy , this is just my idea, and I will be glad to see your ideas in this post.
Please do not forget the ✅' like '✅ button 🙏😊 & Share it with your friends; thanks, and Trade safe.

LUNC Terra Classic Ponzi SchemeThe collapse of Terra's LUNA and TerraUSD cost investors over $40 billion.
Some of them lost their lifetime savings, others lost borrowed money and some even committed suicide.
This project made investors lose trust in the crypto space as well.
The CEO of Terraform Labs, Do Kwon, is facing criminal charges for building a Ponzi scheme in South Korea, Terra investors being victims of fraud. Billionaire Bill Ackman also considered the project to pyramid scheme.
Do Kwon was the one behind Basis Cash, another failed algorithmic stablecoin in which people lost $54 million.
Terraform Labs also lost US Appeal Securities and Exchange Commission Subpoena.
I don`t see a future for this project.
There is a chance that its founder, Do Kwon, end up in jail if the criminal charges for building a Ponzi Scheme will turn out to be true.

LUNA Ponzi SchemeThe collapse of Terra's LUNA and TerraUSD cost investors over $40 billion.
Some of them lost their lifetime savings, others lost borrowed money and some even committed suicide.
This project made investors lose trust in the crypto space as well.
The CEO of Terraform Labs, Do Kwon, is facing criminal charges for building a Ponzi scheme in South Korea, Terra investors being victims of fraud. Billionaire Bill Ackman also considered the project to pyramid scheme.
Do Kwon was the one behind Basis Cash, another failed algorithmic stablecoin in which people lost $54 million.
Terraform Labs also lost US Appeal Securities and Exchange Commission Subpoena.
I don`t see a future for this project.
There is a chance that its founder, Do Kwon, end up in jail if the criminal charges for building a Ponzi Scheme will turn out to be true.

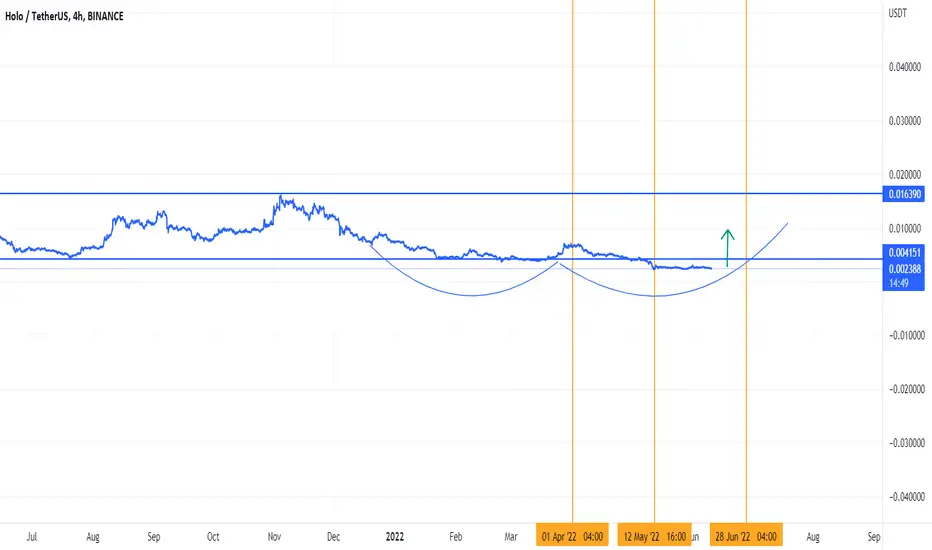
WILL THE FIAT WHALES EXPLODE HOT(HOLO) TO THE MOON?Hot ( Holo) looks into a side of technical analyses very interesting for the possibility to have a whale increase, but at same time knows we are still into breakdown trends on most of the markets. learn from historical trends.
BTC is the main coin, on this reason, there is no guarantee in markets, and on every trade, you invest make sure there is a risk management ready, we have seen from history trades what can happen, also from Luna and more coins.
Back to Holo
It's not about the new network holochain for the web3 that is that seems to be ready, and where there can be some interest for the price action, but it's about a point where are now, that could be interesting for the whale side.
We are into a golden point for Holo - and with time we will see or this point will get confirmed with an increase as it shows, or we will get the unexpected breakdown.
At last, it's interesting to follow it.
This is not investment advice, all markets could be very risky.

Whale data : Shows interesting for OMG : OmisegoCrypto has seen last times more breakdown trends - it's a time where the most users have low interest in crypto - and same time for whales to choose to best long-term coins.
And it's not my best first choice - but if we follow the whale data - then we see OMG is one of the coins , why is these? the time will and should show the effect.
OMG is known as a coin that had the good times before - and same time we know that ETH founder :
Vitalik Buterin has some work on it before, this could be a partnership or lower - but out of that - always study the markets well - as there is no guarantee into markets.
And we have seen that markets going last times also on the normal stock effect.
This update is only to show that this coin can be interesting coming time, and with time we will see or this will get confirmed.

TIME FOR HOT BREAKOUT? Signal shows possiblityIf we check Hot, then there is a possibility that it can get a new breakout.
This all-around the Techincal analysis
There is no guarantee in any market that a breakout will happen - make only study depending on your choice.
This is not a long-term expectation, but more take profit trade.