LUNAC Approaching a Breakout LUNA has been trading downwards along the upper trend line on this 45 min chart
From here it is possible a large break out upside occurs, in my thoughts to an over-reaction of the market drop
I expect upside as the issue was fixed
LUNA

SOLANA SOL short Entry Range, Take Profits and Stop LossSOL/USDT short
Entry Range: $34 - 40
Take Profit 1: $29
Take Profit 2: $23
Take Profit 3: $12
Stop Loss: $46

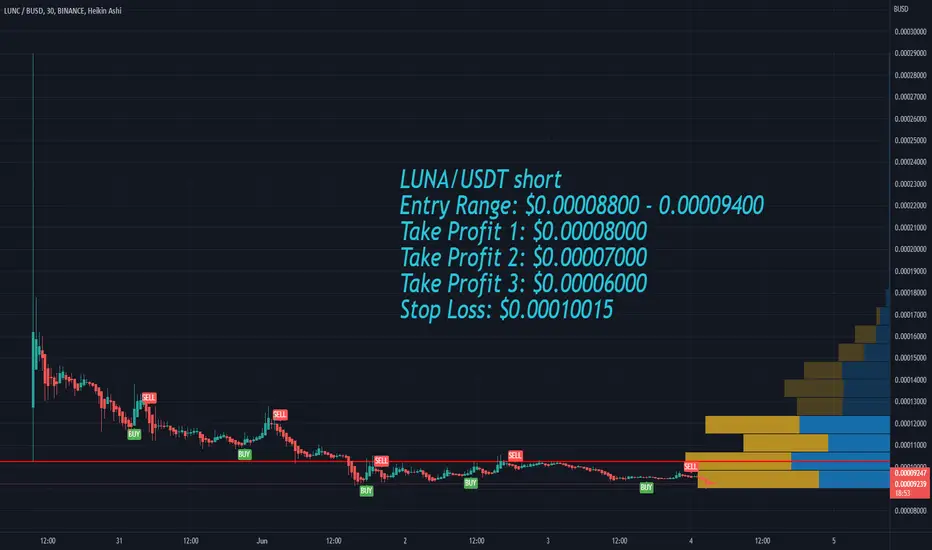
Terra Classic LUNC short Entry Range, Take Profits and Stop LossLUNA/USDT short
Entry Range: $0.00008800 - 0.00009400
Take Profit 1: $0.00008000
Take Profit 2: $0.00007000
Take Profit 3: $0.00006000
Stop Loss: $0.00010015
LUNA short Entry Range, Take Profits and Stop LossLUNA/USDT
Entry Range: $6.23 - 6.68
Take Profit 1: $6.00
Take Profit 2: $4.75
Take Profit 3: $3.17
Stop Loss: $7.57

HNT Breakout channel?will this channel of HNT get confirmed and entry new breakout above 10 USD
This is an important point to follow to see if we are going to enter an HNT breakout.

Ripple: XRP movement viewRipple: XRP movement view
possible targets as the chart show.
new volume entry on XRP with time we can see if this will get confirmed or not.

STELLAR : XLM movement viewSTELLAR: XLM movement view
Target 0,15 - in case there is a breakdown trend on BTC - this target could be canceled.
At this time XLM shows movement effect.


LUNA pumpCurrently, Luna is in the range of 6.1-7.2 $. If the price can break the roof of this range with force on Jun 5, a price pump up to 21 $ will occur.

LUNC vs LUNA - Who Will Win?Hello TradingView Family / Fellow Traders. This is Richard, as known as theSignalyst.
Many creators / authors here perfectly covered the fundamentals regarding LUNC and LUNA.
So I thought it would be a good idea to translate it into numbers, how I digest things better as a pure price action trader.
We can clearly see that LUNC and LUNA has been positively correlated lately , both in a bearish trend and approaching a demand zone in green.
Both LUNC and LUNA are stuck inside a range now.
Let's see which one will win the battle by breaking above the last major high first. (marked in gray for both)
Which team are you in? LUNC or LUNA? None? and why?
Always follow your trading plan regarding entry, risk management, and trade management.
Good luck!
All Strategies Are Good; If Managed Properly!
~Rich

LUNA 2 USD : HEAD AND SOULDERS POSSIBLE BREAK TO $.90 CENTS!Since my last update LUNA2 is not looking very good. I expected a solid bounce and then a continuation up but we've been hanging out around this major support which is beginning to get weaker by the hour. There is a major head and shoulders patter that has formed on the hourly time frame and if this plays out the measured move from the head to the neckline is a drop to about $.90 ninety cents (head and shoulders patterns are the most accurate in price action patterns at 85%-90% of the time). At this point nothing would surprise me with this project. Many people are saying that this was created just to give the initial investors some of their money back, AKA pump and dump! This head and shoulders pattern however doesn't have to play out and can reverse course and we start another run up. For this to happen we need to close at least an hourly above $7.75 for me to believe that the head and shoulders is invalidated! The blue lines are all support lines and breaks and closures below any of those lines will initiate a move down to the next line and the next line and so on. Once we break below the last support line at around $4 LUNA will free fall into the depths of hell. I will buy around $.85 cents and $.90 cents for a nice bounce possibly but I cross that bridge when we get there. Another thing that could be more towards the bullish side is the STOCH RSI has crossed to the upside and the MACD is starting to curl up on the hourly and on the 30 minute has a more defined curl. Volatility is also expanding so there is a big move imminent and soon. I believe this move will happen today! If not then we will probably see sideways action till Monday. If you appreciate my work then please give me a like and follow me for more updates and analysis. This is not financial or trading advice, its just my opinion, so please do your own research first. Thank you and good luck!

#LUNA/USDT BEST ENTRY !!Hello, traders welcome to another LUNA/USDT 30M chart update.
LUNA/USDT best entry at the price level.
LUNA/USDT will be open for trade. let's see how the new version performs.
Entry:-CMP, $6.12
Target:- long term hold on spot.
NOTE: This is not financial advice. This is for education purposes only. I am not responsible for the profits or losses you generate from your investments.
DO YOUR RESEARCH BEFORE MAKING ANY TRADES.
Thank you.

🚀ADA: does it reach these targets? Cardano reached my second take profit. After such a strong momentum movement overtook XRP in the list of the largest cryptocurrencies and took 6th place.
🚩What are the preconditions for a local correction?
🔶Breakout of the trend line and test it as a resistance.
🔶Rising volumes on the previous momentum. Indicates that a major player made a big sell-off.
🔶Weakness of altcoins to the Bitcoin.
🔶Bitcoin weakness near the $30K level.
🔥Fuel for the fall, will be traders who bought Cardano on rising momentum. In case of fall they will close their longs at loss and pushing the price down.
📊Targets:
0.51-0.54 - local target
0.45-0.47 - possible target
💻Friends, press the "like"👍 button, write comments and share with your friends - it will be the best THANK YOU.
P.S. Personally, I open an entry if the price shows it according to my strategy.
Always do your analysis before making a trade.

WLUNA LUNC Luna classic symmetrical triangleI am using wrapped Luna data from Coinbase because it is the most consistent and did not suffer the meddling of the airdrop.
We can see a symmetrical triangle forming and currently price is at the triangle support. The RSI is in an uptrend after printing bullish divergences. The CCI is breaking it's downward trendline.
A small inverted head and shoulder has formed. I am targeting the 1.276 of the fib extension congruent with the triangle resistance. A breakout of the triangle has a measured move to 0.00042 at the 3.618 of the fib extension.

BSV Possible Breakout Coming. Something to watch. I am not exactly a fan of this coin. But if it can close a 4 hour candle above this fib finally. You could see a significant breakout. Just a coin to watch.

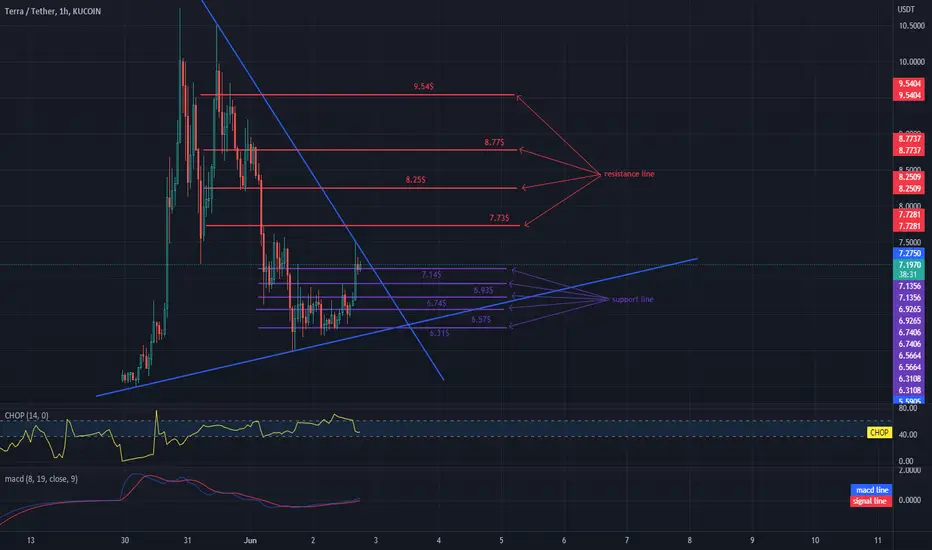
LUNA with the support of.Hello everyone, let's take a look at the LUNA to USDT chart on the 1H interval. As you can see, the price is close to the top exit from the blue line channel.
Let's start with the designation of the support line and as you can see the first support is $ 7.14 where the current price is, if the support breaks down, the next ones are $ 6.93 and $ 6.74, $ 6.57 and $ 6.31.
Now let's move from the resistance line as you can see the first resistance is $ 7.73, if you can break it the next resistance will be $ 8.25 and $ 8.77 and $ 9.54.
Looking at the CHOP indicator, we can see that we still have spopro energy on intervale 1H, while the MACD indicator shows that we are in a local uptrend on a small interval.
GBP/USD : Potential SELL 🔴(Update)Just Updating the chart : Potential SELL 🔴
Follow us for more analysis & Feel free to ask any questions you have, we are here to help.
⚠️ This Analysis will be updated ...
👤 Arman Shaban : @ArmanShabanTrading
📅 06.02.2022
⚠️(DYOR)
❤️ If you apperciate my work , Please like and comment , It Keeps me motivated to do better ❤️

LUNA/USDT stay on buy position
all of them were manipulation.
3.06 stop loss.
target : 9-13-23 $
don't forget money management
be profitable

FTMUSD H4 Hi Guys , Charts shows you everything , I think Bitcoin and Ethereum will be better to trade .
👤SecondChanceCrypto
📅02.june .22
⚠️(DYOR)
Thanks for your Likes and Comments

Terra Analyze (Road Map)Update!!!🗺️Hi, yesterday I tried to show you the end of the main wave 2. I hope that you were able to earn 💵money💵 from that posts.
My last post about Terra Analyze 👇
Luna can be in the main wave C, and Now, it is running in microwave 2 of the main wave 3; the main wave 3 can break Resistance Zone, and when it happens, then we can verify the end of Main wave 2.
If Luna breaks the Resistance Zone, we can expect Luna to grow higher than Main wave 1.
🔴Resistance Zone: 0.00026$ _ 0.00021$
❗️Note❗️: Please just invest 1%_max 4% of your fund in this project at this time.
Terra Analyze ( LUNAUSDT ) Timeframe 45 min⏰ (Log Scale)
Do not forget to put Stop loss for your positions (For every position you want to open).
Please follow your strategy, this is just my idea, and I will be glad to see your ideas in this post.
Please do not forget the ✅' like'✅ button 🙏😊 & Share it with your friends; thanks, and Trade safe.

Terra Analyze (Road Map)!!!🗺️Luna completed its main wave 2 by Double Zigzag Correction ; I expect that Luna can go up before 27 May.
How far can Luna grow? ❗️❓
🎯 Target 🎯: 0.00026$ _ 0.00021$ ( Resistance Zone )
❗️ Note ❗️: Please just invest 1%_ max 4% of your fund in this project at this time.
Terra Analyze ( LUNAUSDT ) Timeframe 45 min ⏰ (Log Scale)
Do not forget to put Stop loss for your positions (For every position you want to open).
Please follow your strategy, this is just my idea, and I will be glad to see your ideas in this post.
Please do not forget the ✅' like '✅ button 🙏😊 & Share it with your friends; thanks, and Trade safe.

Terra Analyze (Road Map)Update!!!🗺️Luna is running as I expected in my previous posts about Luna .
It seems Luna passed the end of microwave 2 and now Luna is on the way that can break Resistance Zone = Scenario 1
Microwave 2 can have a Double Three Correction = Scenario 2
If Luna breaks the Resistance Zone , we can verify the end of microwave 2 .
🔴Resistance Zone: 0.00026$ _ 0.00021$
❗️ Note ❗️: Please just invest 1% _max 4% of your fund in this project at this time.
Terra Analyze ( LUNAUSDT ) Timeframe 45 min ⏰ (Log Scale)
Do not forget to put Stop loss for your positions (For every position you want to open).
Please follow your strategy , this is just my idea, and I will be glad to see your ideas in this post.
Please do not forget the ✅' like '✅ button 🙏😊 & Share it with your friends; thanks, and Trade safe.

XMRUSDT (MONERO) Daily TA : 06.01.22If you're in profit you can close 50% of your position and just leave the rest of it for more gain . If price can break this resistance the nexty target will be $ 265 .
Follow us for more analysis & Feel free to ask any questions you have, we are here to help.
⚠️ This Analysis will be updated ...
👤 Arman Shaban : @ArmanShabanTrading
📅 06.01.2022
⚠️(DYOR)
❤️ If you apperciate my work , Please like and comment , It Keeps me motivated to do better ❤️
