BITCOIN, something is moving.BITCOIN, something is moving.
We are witnessing a technical rebound that has the substantial possibility of a change in trend, also due to the trend of the S & P500 and the Nasdaq 100 (also on the 200 1-week moving average and 50% of the Fibonacci Relegation).
For a substantial change in the uptrend after so many months of taking profit, a consolidation of Support 1 is needed for a break to the upside with a consequent break of Technical Macro Resistances 1 and 2.
S1 (Support): Priced at $ 27,000 on Media 200 (Blue) at 1 week.
R1 (Resistance): Priced at $ 42,700 / $ 48,500 technical resistance of the first weekly low from the high of $ 70,000 on November 8, 2021.
R2 (Resistance): at the price of $ 33,000 / $ 37,500 technical resistance of the last weekly low point and the 1-week Average 100 (yellow).
We have designed a Falling Wedge which is only hypothetical as at the theoretical moment, but if it is respected (we will see it in the next few weeks) it would be a signal of a change in trend from the current profit taking to a powerful new UP TREND.
We will continue to monitor it.
HOLD on BTC and the main Crypto always to be recommended, possibility to accumulate when the price is low but beware of high volatility
For info contact us in private
LPI.sa, Grow with us
LUNA

Will LUNA Recover? The Chart Says ...So much going on with Luna (Terra) after the major crash...
Remember the bear run?
Even though they are trying, this thing is doom... Based on the chart.
It can easily go lower.
There are better options/choices out there.
Move away.
The chart does not support additional growth.
Namaste.
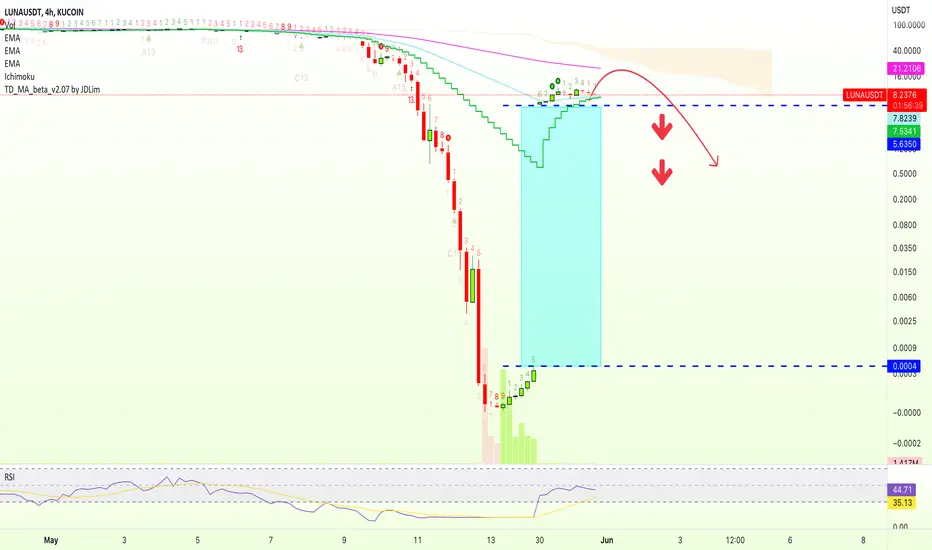

TERRA LUNA 2 USD : Dip down to $6-$7 then run up to $17LUNA2 has some potential upside, I'm not sure how sustainable it is but I have my buy orders set at $6, $6.5, and $7 and selling around $17 to complete the 5th wave of this mini cycle. After that we will revisit and see if this price can be sustained or another major dump party to new lows. LUNA2 right now is only alive on hype and speculation and I don't believe it has legs for the long term outlook. Good trading in the short term, you can make an easy 300% if this plays out. Anyways let me know what you think by leaving a comment below, and follow me for more updates and analysis. This is not trading advice just my opinion, please do your own research.

$BTC support #2 retest? 👁🗨*This is not financial advice, so trade at your own risks*
*My team digs deep and finds stocks that are expected to perform well based off multiple confluences*
*Experienced traders understand the uphill battle in timing the market, so instead my team focuses mainly on risk management
!! This chart analysis is for reference purposes only !!
If you want to see more, please like and follow us @SimplyShowMeTheMoney

LUNA longLUNA long. Need to get to grips with where my stops would be on this, and would probably prefer an entry on the lower support of the descending falling wedge. I welcome others critique and comment on this.
Thanks

WAVES Makes Waves. Crypto's "Decoupling" ContinuesAfter Friday's "decoupling" event, the markets have mostly stayed flat (it feels like there's a lot of confusion and uncertainty in the market as a whole right now) with a few exceptions - WAVES seems to be the big winner today, followed by AXS (Axie Infinity) and ADA (Cardano). XTZ (Tezos) had a very good week this week but at least for today, it seems to be in the red.
With altcoins normally moving in parallel to each other, these trends are interesting to look at because it seems like after Friday each coin seems to have suddenly gained independence as we start to see less and less parallel motion over time. Time will tell if this "decoupling" trend continues - but so far, it seems to be the case.
By the way, if you invested in LUNA right at its rock-bottom a few days ago you would have made a 5.9 MILLION % return today. High risk, high reward. 😂 I don't recommend putting your life savings into bets like these but there is something to the idea of supporting a project during its struggles since that's often how investors make their biggest returns.

Luna classic VS NEW LUNA. What's future of this project?Luna classic VS NEW LUNA. What's the future of this project?

🔥ADA: don`t miss second opportunity! Squeeze before breakout!Cardano (ADA). The price reached the first target of $0.52 level. This altcoin has all chances to reach the second target of $0.6.
How the entry point were identified:
1. someone buy a lot of Cardano at the bottom. You can see it at the volume indicator, which shows us amount of traded coins or $. The bars grow after the bottom were riched and second time before trendline breakout.
2. squeeze under the trendline which is bullish signal.
3. 2-3 weeks of consolidation of crypto market. BTC show signs of strength.
If Cardano starts to squeeze under the trend line after a small consolidation (accumulation of power), it will be a good opportunity to open a long with a short stop-loss and excelent RR 1:7-9.
Why this targets? As you see at the horizontal volume indicator there is huge valua areas which become a resistance for the price. But after a few week consolidation Ada have enough power to reach the second target.
💻Friends, press the "like"👍 button, write comments and share with your friends - it will be the best THANK YOU.
P.S. Personally, I open an entry if the price shows it according to my strategy.
Always do your analysis before making a trade.

📊DOGE: is it happen now? Don`t miss the chance!Hi, friends! DOGE is pumping on the news from Elon Musk, and the whales continue to sell well on it. What to do next time to not miss the long?
Notice how volumes rise on the lows and the highs. After the last fall, the volumes were huge, a large amount of liquidity to buy for the whale. Local sales on news from Elon and after a breakdown of the trend line. Local selling is perfectly visible on the volume indicator.
📊The possible scenario is a bear trap after a local pullback. When the global trendline is broken up, the price went up a few %, but stopped in the resistance zone of $0.083-0.09. This shows the weakness of Doge and a local pullback is possible. But where to?
Pullback to the global trendline is most likely. After a false break down, it could be a bear trap, after which the teddies will become fuel🔥 for growth.
📊The targets:
🔶$0,105-0,11
🔶$0,125-0,13
✅These value zones can stop the price, most traders will close their trades here.
💻Friends, press the "like"👍 button, write comments and share with your friends - it will be the best THANK YOU.
P.S. Personally, I open an entry if the price shows it according to my strategy.
Always do your analysis before making a trade.

BITCOIN BULLISH WEEK - 34.000 USD¿How are you doing traders?
As we've expecting last week, price needed some bearish rest, and it's happening this week.
The low sell pressure indicator + 27.000 USD support is giving us an idea of what the price could do on the upcoming days.
I think, as my personal thought, that on the next 14 days we are going to experience some gains on our portfolios,
The key resistance is the EMA9-34.000 USD level
cryp


🏃GMT: you can't run away from a SCAM.📊Actually, it`s +15% after the last idea. You can read about why the STEPN fell and possible scenarios of pump or dump in this idea.
📊At the moment on the volume indicator we can see an increase in volume at every test of the bottom, which means that the coin is being bought back. Especially it can be seen on the massive sell-off when the price temporarily renew its lows (2) and the coin has already risen by 50% after that. Definitely a sign of strength.
🔶1. $1.31-1.54 is the largest zone of value, a strong resistance for the price. After the 50% growth, GMT should consolidate under this area for some time, to accumulate the strength for continued growth.
🔶2. $1.87-2.02 - the first target, a value zone, an even number. Traders who bought a $1 coin will close their longs.
🔶3. $2,53-2,77 - the second target
✅Friends, trade with stop losses, this is a must. Remember, the Chinese players, were the main players and now this market is being shut down for STEPN. Even if the volume indicator shows buying, remember what happen to LUNA!
Do you think this is a scam or should we expect a strong growth of Move-2-earn projects and STEPN will be the largest of them? Let me know in the comments!
💻Friends, press the "like"👍 button, write comments and share with your friends - it will be the best THANK YOU.
P.S. Personally, I open an entry if the price shows it according to my strategy.
Always do your analysis before making a trade.

LUNA 2.0 Luna 2.0 just launched . Buy around 5,80$(future support) and enjoy the ride. My first short term target is 8$ , future targets 20-30-40 ez.
NO FINANCIAL ADVICE DYOR


LUNC vs LUNA - Correlation Shift!Hello TradingView Family / Fellow Traders. This is Richard, as known as theSignalyst.
Many creators / authors here perfectly covered the fundamentals regarding LUNC and LUNA.
So I thought it would be a good idea to translate it into numbers, how I digest things better as a pure price action trader.
Let's split the charts into two phases:
PHASE 1: Green Level: 29 May 00:00
LUNC (Left Chart) rose 117%
while
LUNA (Right Chart) rose 28%
The correlation between LUNC and LUNA was positive. But LUNC won the battle big time!
As both assets rose, but with LUNC moving upward more aggressively!
HOWEVER... here is when it becomes interesting!
PHASE 2: Purple Level: 30 May 09:00
LUNC (Left Chart) dropped 57%
while
LUNA (Right Chart) rose 50%
The correlation suddenly shifted from Positive to Negative.
What really happened in PHASE 2 ? Are LUNC holders taking profit to buy LUNA?
Which team are you in? LUNC or LUNA? None? and why?
Always follow your trading plan regarding entry, risk management, and trade management.
Good luck!
All Strategies Are Good; If Managed Properly!
~Rich

6 candles range, and a 0.618 fib pullback. So we did get this pullback, it was a bit stronger then i did expect, we need to see some sign of strength upwards now.
We do have a high of 0.00018808, and a swing low (pb) of 0.00012600, let us see if we can break the upwards trendline, and continue the trend.
New update if we break the 0.00014540 area...

BTC - Price action analysis on 15m timeframeRemember, if the BTC price breaks down this demand zone, the price will go deeper.
On this chart, we are searching for the short positions, but don't rush; not yet

can luna moon 1000% from here?luna(2) needs to close the monthly above the $6 area.
if luna is truly back and the people believe it then 1000% should be easily obtainable as money flows back into the project (trust?).
the question is what happens after the 1000%, $800 would be on cards from fibonacci workings but too early to tell.

BITCOIN Daily TA : 05.30.22 (Update)As you can see, the market is still in the Trading range and Accumulating , today's bullish move if continues is a trap to collect liquidity of BUY STOPS above $ 32,700 , so be careful of price movements in this range as you may fall into the trap and Practically become liquid for the whales in the market. Previous analyzes are still valid and be sure to read and review previous analyzes along with this analysis. Prerequisites for climbing up to $ 37,600 have also been mentioned in previous analyzes.
Follow us for more analysis & Feel free to ask any questions you have, we are here to help.
⚠️ This Analysis will be updated ...
👤 Arman Shaban : @ArmanShabanTrading
📅 05.30.2022
⚠️(DYOR)
❤️ If you apperciate my work , Please like and comment , It Keeps me motivated to do better ❤️

#LUNC/BUSD Buy and hold! Are u ready 15M BEST ENTRY UPDATE !Welcome to this quick LUNA/BUSD analysis.
I have tried my best to bring the best possible outcome in this chart.
Reason for trade:- Luna Classic (LUNC) is the native token of the original Terra Luna blockchain. The renaming of this token comes after the recent collapse of the.
LUNA/BUSD best entry at the price level.
In a few minutes, LUNC/BUSD will be open for trade. let's see how the new version performs.
Entry:-CMP, $0.00011757
Traget:- 90%
Remember:-This is not a piece of financial advice. All investment made by me is at my own risk and I am held responsible for my own profit and losses. So, do your own research before investing in this trade.
Sorry for my English it is not my native language.
Do hit the like button if you like it and share your charts in the comments section.
Thank you...

Big Red Candle here And spike in Volume.So we did get a pullback here, let's see if we can keep the upwards trend, and not break the pullback..
Going out for a while, stay tune.

The New Chainlink Cycle Has StartedThis could very well be the new Chainlink channel before breaking the 8/1 Gann Fann and going to all time high.
So as you can see from the two yellow circles this channel is becoming pretty important for link. Last time we hit the bottom of this channel it was the Covid crash March 2020.
791 days later we had the same thing happen capitulation crash to the bottom of this channel and so far things are looking pretty good, we keep closing weekly candles above it .
The BTC/LINK time sequence is now officially started, check out this TA below .
From here onwards Link has now started its new cycle, a potential rally could take it as high as 20 dollars this year , before rolling over at the top of this channel going into 2023.
The next BTC/LINK sequence is now April 2024 which lines up with Bitcoin halving and March 2024 time Fib you see in this chart. It is possible that during the period April -March 2024 chainlink will break the 8/1 Gann Fann and start its parabolic move upwards and break all time high.
Target for late 2024 would be 185-200 dollars.
