LUNC squeezing for a breakout. Circle #1 shows where the Pro Blue Osc (Blue Dotted Line) rose above the zero line (Light Blue Line) back at the end of June and is now moving nicely in a consolidation pattern above it. The Bollinger Bands are now starting to come together in a tight squeeze while RSI stays at a healthy bullish level around 50. It just made a Bullish MACD cross as well so all indicators on the Daily pointing to a nice move up.
Lunc

Lunc reacting with the fibs.Well, Who knows with this coin.
Here's some fibs to keep an eye on. I don't really have a bias with this coin. I'm holding a small bit as the R/R is good to my mind.
Not financial or trading advise just educational content. DYOT+R.

What is happening?
This candle shows that a strong buying pressure drove the price back up.
It can potentially reverse the trend from downtrend to uptrend.

DECISION COMING IN 2 DAYS FOR THIS TRIANGLE SQUEEZELuna classic is getting trapped inside this triangle, where is the breakout be?

Easy money maker
The action of the market itself should provide the best guidance!
I have my eyes on. Have a great trading day.

Luna classic descending triangle targetThe following is a luna classic update, I expect the coin to fall to that given level 7700 crossing the yellow resistance above1100 would be a bullish scenario.

LUNC 50% - 100% Profit Clear Bullish Falling Wedge breakout , Retest is done successfully
Entry Price - Now
TP1 : 0.000015
TP2 : 0.000018
TP3 : 0.000021
TP4 : 0.000024

FTT TOKEN , RETEST —> PUMPMy thoughts on FTT are bullish , buy here on the retest. First target is 40$. Have to break 31$ first.
In my opinion FTT is highly undervalued.No financial advice.


INVERSE HEAD AND SHOULDERS, POTENTIAL 24% PUMP !!Check out htis bullish reversal pattern on luna classic broken out of the neckline as well !!


86% (with a one track mind)
TerraUSD (UST) was launched in September 2020. It has a circulating supply of 10,254,324,366 UST coins.

LUNCBUSD RALLY UPDATERE: My June 16 2022 Post Titled - LUNCBUSD- NEW CYCLE UNDERWAY!
decline from June 29th high is rather corrective than impulsive looking like a zigzag 5-3-5
Price above June 29th high of 0.00016663 would suggest resumption of uptrend
Please drop in comment section any instrument you would want me to do a wave count for.
Disclaimer: We accepts no liability whatsoever for any loss or damage that may result, directly or indirectly, from any forecast or opinion, information or omission, whether negligent or otherwise, within this report

Happy CPI (Consumer Price Index)!
Market manipulation increases volatility, traders can avoid this whale tactic by basing their decisions on historical price trends (& Total Supply) instead of recent movements (drastic drop).

LUNCUSDT - 18% potencial profitLUNCUSDT - 18% potencial profit. .................................................................


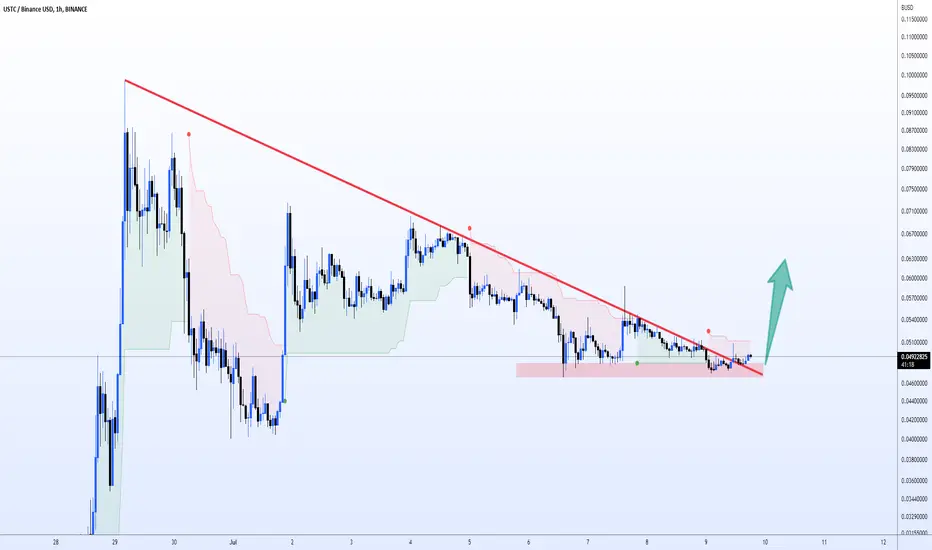
$USTC : Bullish continuation Soon?USTC Had an insane rally in the past week and is currently now in a bullish pennant. Now the price broke out and retested toe broken red resistance line and i am Expecting continuation of the bullish momentum.
Also, No wonders if we see some more sideways before the uptrend continuation.

Am I being crazy? LUNCI am very green when it comes to Elliott wave and also fib extensions. I just feel that these moves have fitted the pattern rather well, and we have had the 3 wave correction from the big leg up we saw for LUNC. Now for the pattern to be carried on, up to the 0.0002 mark

LUNCBUSD RALLY UPDATEWave degree appears dynamic at this point.
From June 8th 2022 low of 0.00004123 to June 29th high of 0.00016663 is 5 waves up- wave I of 3.
decline from June 29th high to July 4th low is a rather corrective than impulsive looking like a zigzag 5-3-5- wave II of 3.
Price above 0.00014298 July 1st high would suggest wave III of 3 is underway provided July 4th low of 0.00010100 remains intact.
Disclaimer: We accepts no liability whatsoever for any loss or damage that may result, directly or indirectly, from any forecast or opinion, information or omission, whether negligent or otherwise, within this report

LUNA Will be short term upLUNA2.0 trade will be boost up for short term from blue range area as we predicted before. You can see trade is accumulated in narrow range. Now anytime it can go up. There is one leg up before head down to zero. Trade scenario will be completely changed it crosses 50% Fib level which is around $25 level. We are expecting two mega negative candles then up after long accumulation period.

LuncUsdt 15MinHello friends ,
It seems to be a classic pattern formed in the 15-minute time frame.
It will break in any direction, it will go in the same direction...
Of course, this is just a simple analysis, maybe I'm wrong...
