Bitcoin Wave Analysis – 4 July 2025- Bitcoin reversed from long-term resistance level 110000.00
- Likely to fall to support level 105000.00
Bitcoin cryptocurrency recently reversed down from the major long-term resistance level 110000.00 (which has been steadily reversing the price from the start of this year, as can be seen below) – intersecting with the upper daily Bollinger Band.
The downward reversal from the resistance level 110000.00 stopped the previous medium-term impulse wave (3) from the start of June.
Given the strength of the resistance level 110000.00 and the overbought daily Stochastic, Bitcoin cryptocurrency pair can be expected to fall to the next support level 105000.00 (low of the previous correction (2)).
M-oscillator

SMCI: The Monthly Chart says it ALL
Stochastic is way oversold.
MACD is converging.
RSI is converging back up.
Would not be surprised to see this soar back towards the CRT value of $65, then take on new challenges back towards it previous ATH of $122.90 in March, 2024.
Regards,
Terrapins

AAVE Breakdown Could Trigger Major DropYello Paradisers — did you spot the bearish setup forming on AAVEUSDT? If not, you might already be a step behind, but there’s still a high-risk-reward opportunity on the table — if you approach it with discipline.
💎Currently, AAVEUSDT is looking increasingly bearish. The asset has confirmed a bearish Change of Character (CHoCH), broken down from a rising wedge pattern, and is showing clear bearish divergence on the chart. These combined signals suggest that the probability of further downside is increasing.
💎From here, there are two main scenarios we’re monitoring. First, AAVE could attempt a pullback to fill the Fair Value Gap (FVG) above, which would offer a clean short-entry zone with strong risk-reward potential. Alternatively, price could reject directly from the nearby Bearish Order Block (OB), offering another chance for well-structured entries. Both setups depend on confirmation and timing, so patience is key.
💎However, if AAVE breaks and closes decisively above the current resistance zone, the bearish thesis becomes invalid. In that case, the best move is to wait on the sidelines and allow new, higher-quality price action to form before re-engaging.
💎This market demands patience and discipline. You don’t need to catch every move — just the right ones. Stay sharp, stay focused, and let the market come to you.
Strive for consistency, not quick profits. Treat the market as a businessman, not as a gambler.
MyCryptoParadise
iFeel the success🌴

EURCAD Wave Analysis – 3 July 2025- EURCAD reversed from resistance zone
- Likely to fall to support level 1.5800
EURCAD currency pair recently reversed down from the major resistance zone located between the strong resistance level 1.6150 (former yearly high from 2018) and the resistance level 1.5965 (former Double Top from 2020).
The downward reversal from this resistance zone stopped the previous impulse waves 5 and (3).
Given the strength of the resistance level 1.6150 and the bearish divergence on the weekly Stochastic indicator, EURCAD currency pair can be expected to fall further to the next support level 1.5800.

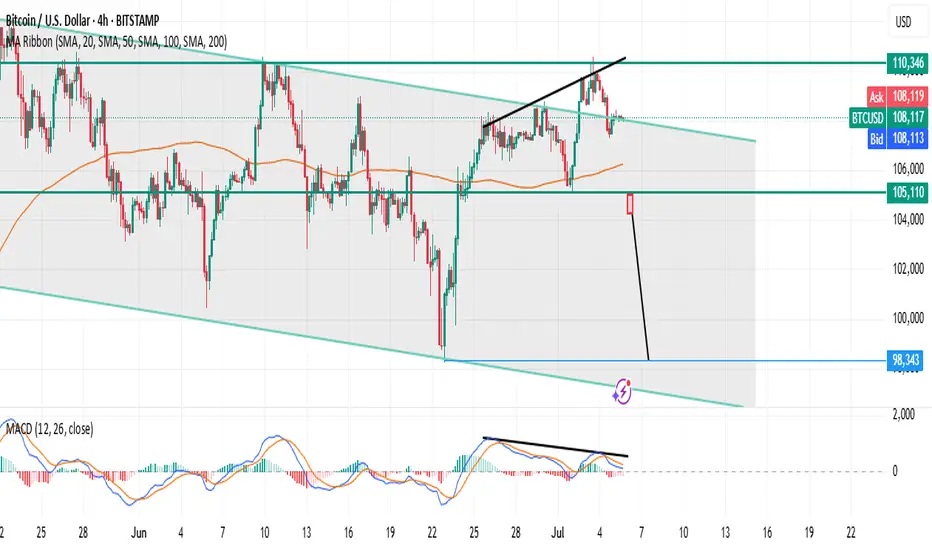
BTC/USD (4H): Classic FRL short setup unfoldingTrading = capital management under uncertainty.
Bitcoin is trading inside a clear descending channel on H4.
Price recently tested the upper boundary of this channel while forming a bearish divergence on MACD. This divergence hints at a weakening upward phase, signaling a possible phase shift according to Fractal Reversal Law (FRL).
Why is this a classic FRL setup?
✅ Phase Identification:
The prior local upward phase within the descending channel is weakening.
✅ Reversal Pattern:
A double top / wedge has formed at the upper boundary with a bearish divergence.
✅ Neckline:
The neckline aligns with the MA100 cluster on H4, now acting as a horizontal rubicon.
✅ Confirmation:
We wait for a full candle close below the neckline on H4 to confirm the phase shift.
✅ Targets:
– TP1: Mid-channel grey zone.
– TP2: Lower boundary of the channel.
✅ Stop:
Above the recent highs or channel top, depending on your risk management.
Plan:
Wait for H4 close below neckline → enter short.
Use the channel structure for target planning.
Manage risk with a tight, structure-based stop.
This is a clean FRL textbook scenario:
Phase → Pattern → Neckline → Confirmation → Target.
It aligns with the larger market structure, using the combination of price action, divergence, and structure clarity to guide your trade decisions.
Why FPT?Starting first looking at what the company is doing.
AI
The buzz word of most news headlines.
$200 Million Investment: FPT has committed to a landmark $200 million investment to build an AI Factory in partnership with global chip giant NVIDIA. The goal is to create a complete ecosystem for AI development, offering not just the raw computing power (GPU infrastructure) but also the software platforms (FPT AI Studio) and expert consulting needed to build and deploy AI solutions.
This one ties AI and chips together:
University Collaboration: FPT University is a strategic asset. They are working directly with NVIDIA and other institutions like the VNU University of Technology to incorporate AI into their curriculum, aiming to help train the 30,000 to 50,000 AI and semiconductor engineers Vietnam needs by 2030.
Chips
FPT is targeting the design aspect of making chips and there is a lot of international demand to cut into China's monopoly. FPT being in Vietnam is already in a strategically significant area. Samsung is Vietnam's single largest foreign investor and happens to be able to fabricate chips. They also have multiple existing partnerships with FPT and are no strangers to working together. Compute is hottest commodity of the modern age. Though compute is the final product I'll go over how we get there.
First stage mine it
Vietnam has an estimated 3.5 million metric tons Rare Earth Reserves. The world's sixth largest reserves. The key challenge is converting this immense potential into actual production and processed materials. In 2024 Vietnam produced 300 metric ton. So there is a lot of room to grow.
Why this matters:
This national ambition is backed by a new, aggressive legal framework. Key policies like Resolution 10-NQ/TW and the new Law on Geology and Minerals (effective July 1, 2025) mandate that raw ores must be processed in-country and explicitly push for Vietnamese companies and their partners to lead the charge. This strategy aims to prevent the export of raw minerals and build a complete high-value supply chain within Vietnam.
While FPT is not a mining company, these laws are designed to create a stable domestic supply of processed rare earths and high-value materials. This is a critical long-term advantage for a company like FPT aiming to build a world-class semiconductor design center, as it ensures future access to a secure, local supply chain.
Stage 2 is processing
Multiple countries are working on doing this. It's very complicated and the struggle seems to be making in cost effective outside of China.
Stage 3 Design
Conceptualizing the chip's architecture. (Fabless companies like NVIDIA do this). This is precisely the high-value role FPT is targeting.
Stage 4 Fabrication
This is mostly TSMC and Samsung. It's why Taiwan and chips is so related. Also worth mentioning Samsung not do fabrication in Vietnam. It does it in South Korea.
Stage 5 Assembly, Test, and Packaging (ATP)
Cutting the finished wafers into individual chips, assembling them into protective packages, and testing them to ensure they work. Companies like Intel and Samsung already do this in Vietnam.
Telecommunications Segment
While its growth is more modest (around +11.3% in 2024), it is highly profitable and provides consistent, predictable cash flow that helps fund the high-growth initiatives in the Technology segment.
Education & Other Investments
The education section has 1 simple con and that's birthrates in Vietnam. Currently below the replacement rate but effort is being made to change that. Other then that it's all good news. Over the last 50 years Vietnam has gone from it being common to have some elementary school education but no high school or university or English. To pumping out highly educated English and Vietnamese speaking students ready to take on global competition. This factory of new skilled workers means both proud parents and a nation about to steal the spotlight on a global stage. Vietnam while a small country by land mass makes up for it in a population of 100 million and a relentless work ethic. It's the definition of hard times make strong people and strong people make good times. The good times are coming. Why this matters to FPT Education? Good education costs money but it also makes $$$. With this new labor force they will be able to afford great education for the next generation. What else? Well when you got great education other people will use it. Looking forward, as Vietnam solidifies its status as a stable, high-tech hub, it's plausible that its top-tier educational institutions, like FPT University, will attract foreign students, creating an entirely new, high-margin revenue stream that is likely not on most investors' radar today.
Price Chart
Price is sitting on the weekly 8 SMA. Waiting for a move above 122000 VND this is the next FIB retracement level. Right now we have a possible low at 106000 VND and possible higher low at 115000 VND . Stoploss at 110 000 VND means that upside potential is way bigger then the downside risk. To be clear the stoploss can't be at 114900 while this might work with low volatility stocks on larger US exchanges. The risk of getting wicked out of a position here on HOSE is way different. My optimistic target right now would be 190 000 VND and FIB retracement projection is 192 500 VND. Most likely I'll take profit before that.
MACD cross
MACD is still bearish there is a chance of a cross in the next few weeks.
Daily saw a nice move up. It's also very close to attempting a cross up. It's bearish but allows for an asymmetric trade when down side stop loss can be small. While upside can be huge. Lose small and win big. I opted for tight stoploss rather then waiting for signals to all line up. Some people might be less aggressive but not waiting here is about identifying in the price favorable conditions for minimal downside. Meaning it's clear where the position become invalid.
RSI
The daily RSI has a really nice double bottom. To me this increases the likelihood of a reversal substantially.
Stoch RSI
With Stochastic RSI continuing to move up we should know soon if this position is correct of not.
Disclaimer:
The information provided in this post is for educational and informational purposes only. It does not constitute financial advice, investment recommendations, or a solicitation to buy or sell any financial instruments. All investments involve risk, and the past performance of a security, market, or trading strategy does not guarantee future results. I am not a financial advisor. Please conduct your own thorough research and consult with a qualified financial professional before making any investment decisions. You are solely responsible for any investment decisions you make.

CLX Clean-Up RallyClorox NYSE:CLX is rebounding from the $117 swing low on rising volume.
Fibonacci measured from the Jul-’24 high ($171.37) to that low shows the 50 % retrace at $144.36 .
A nine-wave corrective drop has completed, and the daily RSI crossover mirrors the two prior bottoms highlighted on the chart.
Confluence to the upside
Bullish RSI divergence off the 30-line
Price back above the 9-EMA ribbon: targets 23.6 % ($130.10), 38.2 % ($137.99), 50 % ($144.36)
200-DMA ≈ $150 — often acts as a magnet once 50 % breaks
Street context
Consensus 12-mo target sits around $150–152 (FactSet), with the high at $165 and low at $130 .
Short interest ≈ 3 % of float—no squeeze fuel, but little overhead supply until the $140s.
Next catalyst: FY-Q4 earnings – guidance indicates week of Jul 29 to Aug 2 (date TBD); options price an implied ±4 % move.
Trade Setup
Entry zone: $123–126
Primary target: $144 (50 % fib).
Secondary target: $149–150 200-DMA / analyst mean.
Invalidation: Daily close back below $118.
NOT FINANCIAL ADVICE! Always manage risk!

CAD/CHF 4H Reversal Setup – Stoch RSI Signals Exhaustion CAD/CHF 4H Reversal Setup – Stoch RSI Signals Exhaustion 📉📈
Pair: CAD/CHF
Timeframe: 4H
Date: July 3, 2025
---
Market Overview
The CAD/CHF pair remains in a strong downtrend. Price is trading below both the 50 EMA and 200 MA, which are sloping downward. This confirms bearish momentum. After a small bullish bounce, the pair is testing the dynamic resistance zone formed by the 50 EMA.
---
Indicator Confluence
Stochastic RSI (3,3,14) is deep in the overbought zone (above 94), suggesting bullish momentum may be fading.
Price has failed to break above the 50 EMA (0.58564), which could serve as a resistance barrier.
EMA and MA crossover shows 50 EMA remains below the 200 MA, confirming the dominant trend is bearish.
---
Trade Idea: Short Setup
Entry Zone: 0.58240 – 0.58300 (wait for bearish confirmation candle)
Stop Loss: Above 0.58600 (just beyond the 50 EMA)
Take Profit Targets:
TP1: 0.57200 (recent swing low)
TP2: 0.56000 (next support zone)
---
Strategy Logic
This is a trend-continuation reversal entry, catching the top of a pullback within a bearish structure. The Stochastic RSI overbought condition, combined with resistance at the 50 EMA and overall trend alignment, makes this setup attractive for swing or intraday short trades.
---
Risk Disclaimer
This idea is for educational purposes only. Always apply proper risk management and confirm setups with your trading plan.
---
If you found this helpful, feel free to like, comment, or share your thoughts below. Are you short on CAD/CHF too?
\#CADCHF #Forex #TradingView #StochasticRSI #BearishReversal #EMA #4HSetup #ForexEducation #TrendTrading #PriceAction
---

GBPUSD 30m – Elliott Wave + AO ConfirmationPrice is currently testing the 1.36277 zone. I’m closely monitoring for a break of structure below this level. If it breaks, I’ll be watching for a pullback setup to short, ideally aligning with BBMA/EMA confluence.
The wave structure looks clean:
• ✅ Wave (1), (2), (3), and (4) are completed.
• ✅ AO histogram also confirms momentum waves (1) to (4), with the current move likely to complete Wave (5) to the downside.
• 🔻 Wave (4) retraced into the previous imbalance zone and respected resistance, giving further confluence for bearish continuation.
Looking to target below 1.3500 for Wave (5) completion.
Key Levels to Watch:
• 🔑 Break below 1.36277 = Bearish confirmation
• 🎯 Potential TP Zone: 1.3450 – 1.3425
• 🚫 Invalidation if price closes above 1.3700 with momentum
Let’s see how price reacts at this key level 👀
#GBPUSD #ElliottWave #AO #PriceAction #BreakOfStructure #TradingView

80% drop into the abyss for Solana? - July 2025** The months ahead **
Examination of the 3-week chart for SOLANA reveals several compelling technical signals that suggest a potential bearish trend reversal. This analysis highlights crucial patterns traders and investors of Solana should consider.
1. Formation of a 3-Week Death Cross:
A notable bearish signal prints on the chart: a ‘3-week death cross’. This follows a ‘2-week death cross’ that preceded a significant downward movement, just as in early 2022. The death cross, where a shorter-term moving average crosses below a longer-term one, is a strong indicator of a shift towards a bearish trend, especially on higher timeframes like this 3-week chart.
2. Broken Market Structure:
The chart clearly indicates a “broken market structure.” This typically occurs when the price fails to create higher highs and higher lows during an uptrend, or in this case, breaks below a significant support level that had previously held. It is absolutely possible price action backtests past support for a resistance confirmation, however on looking left, such a test never occurred on the last death cross.
3. Resistance from Previous Peaks (Head and Shoulders Pattern):
Price action leading up to the recent highs resembles a potential ‘Head and Shoulders’ pattern. The three distinct peaks, with the middle peak being the highest, suggest a classic reversal pattern. A subsequent break below the ‘neckline’ (implied support level below the peaks) would confirm the bearish outlook.
4. RSI Oscillator (bottom of chart) resistance
The lower panel of the chart displays an RSI oscillator indicator, which shows a clear pattern of "resistance." following a period of support since 2023. The RSI has clearly confirmed resistance from almost 3 years of support.
5. Solana vs Bitcoin
All the bearish observations made on the SOL-USD trading pair can be observed on the same 3 week time frame for the SOLANA - BITCOIN trading pair:
6. Potential for Significant Downside Target:
Based on the measured move from the previous death cross and breakdown and Fibonacci extension, the chart illustrates a potential downside target of approximately -70% from current levels toward the $30-40 area. While this is a projected target and not guaranteed, the historical precedent following similar bearish signals provides a context for the potential severity of the downturn if the bearish momentum continues.
Conclusion:
Considering the confluence of a 3-week death cross, broken market structure, resistance from previous peaks (suggesting a potential Head and Shoulders pattern), and the confirmation of RSI resistance, the outlook for SOLANA on the 3-week timeframe appears distinctly bearish.
Is it possible price action continues upwards after a 3200% rally? Sure.
Is it probable? No
Ww

Bullish confirmation today on both the daily and 4hrly.Bullish confirmation today on both the daily and 4hrly.
4hrly Chart:
Caught the dip?

Better MACDWhat is the MACD?
The MACD (Moving Average Convergence Divergence) is a momentum and trend-following indicator. It’s based on the difference between two EMAs (Exponential Moving Averages) and helps spot:
Trend direction
Momentum shifts
Reversals
Entry/exit points
✅ Basic MACD Techniques
1. Signal Line Crossovers
Bullish Crossover: MACD line crosses above Signal → buy signal
Bearish Crossover: MACD line crosses below Signal → sell signal
🔸 Works best in trending environments, 200 SMA as a filter.
🔸 Combine with volume or trend filters for best results
2. Zero Line Crossovers
When MACD crosses above 0, the shorter EMA is above the longer EMA → bullish. This is typically the sign of a larger trend than crossovers.
When MACD crosses below 0, shorter EMA is below → bearish
🔸 Zero line = baseline momentum direction
🔸 Cross above = bullish trend confirmation
🔸 Cross below = bearish confirmation
3. Histogram Momentum
The histogram is often the first sign of a shift before a crossover happens.
Read it like this:
Histogram growing: Increasing momentum in that direction
Histogram shrinking: Momentum is fading
Histogram changing color (in many indicators): Potential reversal
🔸 Use histograms to get early signals, even before crossovers. Confirmed with volume surge and Price Action.
🔍 Advanced MACD Tricks
📉 4. Divergence Detection
Divergence occurs when price and MACD move in opposite directions.
🔸 Bullish Divergence:
Price makes lower lows
MACD makes higher lows
→ Hidden buying pressure, trend reversal likely
🔸 Bearish Divergence:
Price makes higher highs
MACD makes lower highs
→ Trend weakening, reversal likely
🔹 Confirm with:
RSI, when the lower timeframe RSI is oversold and the higher timeframe MACD is rising, then it's a good sign, and the opposite is true for bears.
Support/resistance zone: draw trendlines either on the volume or price and watch out for retests on the breakout.
Candlestick reversal patterns: some bearish patterns are bullish on indexes because of dollar cost averaging.

Bank of America Wave Analysis – 1 July 2025
- Bank of America reached resistance level 48.00
- Likely to fall to support level 46.00
Bank of America recently reached the powerful multi-month resistance level 48.00, which has been reversing the price from last November.
The resistance zone near the resistance level 48.00 is strengthened by the upper daily Bollinger Band.
Given the strength of the resistance level 48.00 and the overbought daily Stochastic, Bank of America can be expected to fall to the next support level 46.00.

KHC | Reversal Breakout in Motion – Triggered with Target $31📍 Ticker: NASDAQ:KHC (The Kraft Heinz Company)
📆 Timeframe: 1D (Daily)
📉 Price: $26.61
📈 Pattern: Falling wedge breakout + horizontal support reclaim
📊 Breakout Probability: ~68% upward
🔍 Technical Setup:
KHC has just broken above a descending wedge, paired with a clear reclaim of horizontal structure (~$26.00). Volume surged on the breakout candle, confirming participation.
✅ Falling wedge → bullish breakout confirmed
📈 RSI crossed 50 with strong upside momentum
📉 Prior resistance at $28.45 and $30.70 now set as key swing targets
🧠 Trade Plan:
📥 Entry Zone: $26.40–$26.70 (confirmed breakout)
⛔ Stop-Loss: Below $24.80 (beneath last major support & wedge base)
📐 Pattern Breakout Probability: ~68% bullish
🎯 Upside Targets & ROIC (from $26.61):
Target Price Return
🎯 Target 1 $28.48 +7.04%
🎯 Target 2 $30.70 +15.4%
⚠️ Key Observations:
Classic falling wedge structure → statistically strong setup
High-volume breakout = institutional confirmation
RSI breakout supports momentum
Risk is tightly defined, reward is clearly measurable
💬 KHC is triggering a textbook breakout from a falling wedge pattern with strong volume confirmation.
Backed by historical performance metrics, this setup carries a 68% probability of success.
#KHC #BreakoutSetup #FallingWedge #TechnicalAnalysis #BulkowskiPatterns #TargetTraders

ELLIOTT WAVE XAUUSD H4 update
EW Trade Set Up H4
monitoring the end of subminuette wave ii
subminuette wave ii is going to end in a double zigzag.
Waiting for an accumulation in the price range 3250/3315 before subminuette iii starts.
daily key levels (area)
3315
3275 POC
3250

HELE | Historic Support Reclaim – Falling Wedge Breakout +113% 📍 Ticker: NASDAQ:HELE (Helen of Troy Ltd.)
📆 Timeframe: 1W (Weekly)
📉 Price: $28.10
📈 Pattern: Falling wedge + long-term horizontal support
🔍 Technical Setup:
NASDAQ:HELE is rebounding from a major horizontal support zone that's been in place since 1998, and just broke above a multi-year falling wedge. This marks the start of what could be a powerful bullish reversal.
🔻 Breakdown structure from 2022 now being tested from below
🟡 Long-term horizontal support: ~$26.00–27.00
📈 Breakout potential with plenty of headroom into prior supply zones
🧠 Trade Plan & Return on Invested Capital (ROIC):
📥 Entry Zone: $27.50–$28.50
⛔ Stop-Loss: Weekly close below $25.00 (structure invalidation)
🎯 Target 1: $47.99
→ 🔼 ROIC: +70.8%
🎯 Target 2: $60.06
→ 🔼 ROIC: +113.8%
⚠️ Key Observations:
Large-volume bottoming zone, breakout confirmed above falling trendline
Price targets align with key prior support → resistance flip zones
Multi-year trend reversal possible if price sustains above $31–32
Strong candidate for mid/long-term swing trades or LEAP call positioning
💬 Will Helen of Troy return to its former strength with a clean wedge breakout?
Add HELE to your watchlist for 2025–2026 recovery potential.
#HELE #FallingWedge #BreakoutTrade #LongTermSetup #ReversalPattern #TargetTraders

DXY USD Dollar Bearish Short term, then bullishI am not a financial advisor. This is not meant to be and does not constitute financial, investment, trading, or any other types of advice or recommendation.

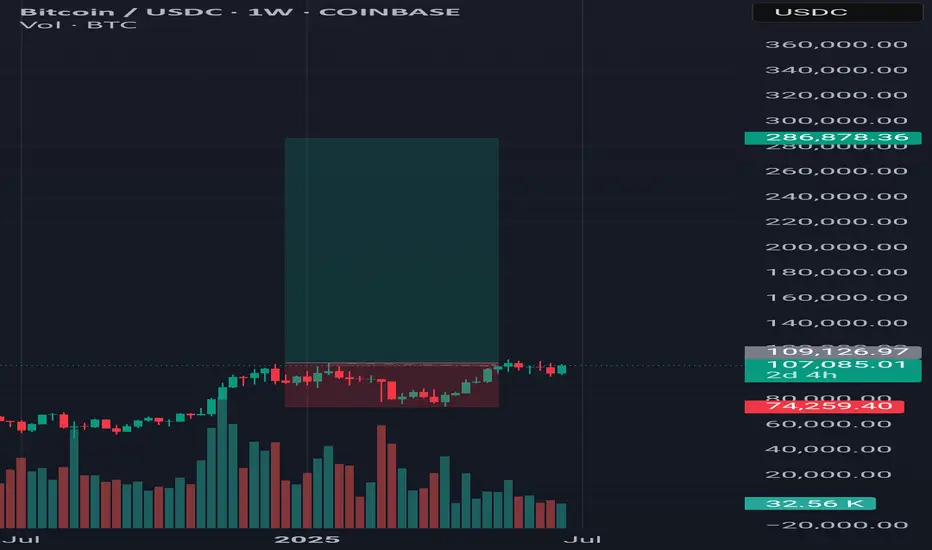
Navigating the ETH Volume Wall as Capital Rotates to High-Beta
In the intricate and often volatile theater of the cryptocurrency markets, Ethereum (ETH) currently finds itself in a moment of profound tension. As the undisputed king of smart contracts and the foundational layer for decentralized finance (DeFi), its price action sends ripples across the entire digital asset ecosystem. The current outlook presents a fascinating dichotomy: on one hand, Ethereum is staring down a formidable "volume wall," a dense zone of historical trading activity that acts as a powerful barrier to upward momentum. On the other hand, the tantalizing prospect of a decisive breakout above the key $2,900 level beckons, promising a new leg up for the bull market.
This standoff has created a fertile ground for a classic market phenomenon: capital rotation. As Ethereum grinds sideways, battling for every percentage point against heavy resistance, impatient capital is beginning to flow into more nimble, higher-risk assets within its orbit. Traders and investors are increasingly eyeing "cheap crypto"—smaller, more volatile altcoins built on or related to the Ethereum network. These "ETH beta" plays are rallying in anticipation of an eventual Ethereum breakout, offering the potential for outsized returns.
This comprehensive analysis will dissect the complex dynamics shaping Ethereum's current price outlook. We will explore the nature of the heavy volume wall that is capping its ascent and the strategic implications of the resulting price range. We will then delve into the mechanics of capital rotation, examining why traders are turning to lower-cap altcoins as a proxy for Ethereum's future success. Finally, we will weigh the bullish and bearish cases, charting the potential path to a $2,900 breakout while acknowledging the significant risks that could invalidate the optimistic thesis. For investors and market observers, understanding this intricate dance between consolidation, rotation, and breakout potential is paramount to navigating the next chapter in Ethereum's journey.
Part 1: The Great Wall of Ethereum - Deconstructing the Heavy Volume Range
To understand Ethereum's current struggle, one must first grasp the concept of a "volume wall." This is not a literal barrier, but a powerful technical and psychological construct visible on a price chart. It represents a price range where an unusually high volume of tokens has changed hands in the past. This area of high trading concentration becomes a major point of contention for future price movements, acting as a powerful magnet for both support and, in this case, resistance.
What is a Volume Wall and Why Does It Form?
A volume wall is best visualized using an indicator like the Volume Profile Visible Range (VPVR). Unlike traditional volume bars at the bottom of a chart that show volume per unit of time, the VPVR displays it horizontally, showing volume per price level. A large, protruding bar on the VPVR signifies a "High-Volume Node" (HVN), which is the technical term for a volume wall.
These walls form for several key psychological reasons:
1. Breakeven Sellers ("Bagholders"): A significant number of market participants may have bought ETH within this price range during a previous rally. When the price fell, they were left holding at a loss. Now, as the price returns to their entry point, their primary emotion is relief. Their goal is not to make a profit, but simply to exit their position at breakeven. This creates a steady stream of sell orders as the price enters the high-volume zone.
2. Strategic Profit-Takers: Investors who bought Ethereum at much lower prices see this high-volume area as a logical and predictable place to take profits. They recognize it as a zone of contention and potential reversal, making it an opportune moment to sell a portion of their holdings and de-risk.
3. Opportunistic Short-Sellers: Traders who are bearish on Ethereum view the volume wall as a high-probability area for the price to be rejected. They will strategically place short-sell orders within this range, adding to the selling pressure and betting on a move back down.
When these three forces converge, they create a formidable supply zone that can absorb a tremendous amount of buying pressure. For Ethereum to break through, it requires a catalyst strong enough to overwhelm this confluence of sellers.
Identifying Ethereum's Current Range
For the purpose of this analysis, let's assume this heavy volume wall for Ethereum is situated roughly between $2,750 and $2,850. This range becomes a battleground. When the price enters this zone, it often loses momentum and begins to move sideways in a "chop," characterized by volatile price swings without a clear direction.
The implications of being trapped below such a wall are significant. The market enters a state of consolidation or ranging. This means that for the time being, the explosive, directional trend is on pause. Bulls and bears are locked in a battle for control, and until one side emerges victorious, the price will likely remain contained. This period of consolidation, while frustrating for trend-followers, is a critical phase where the market digests previous gains, flushes out weak hands, and builds energy for its next major move. The key question for every trader is which direction that move will be.
Part 2: The Rotation Game - Chasing Beta in a Sideways Market
When a market leader like Ethereum enters a prolonged consolidation phase, a fascinating secondary effect begins to take hold: capital rotation. Traders and investors, particularly those with shorter time horizons, grow impatient with the lack of volatility in the primary asset. Their capital seeks higher returns and more immediate action, leading them to rotate out of the ranging asset and into more speculative plays. In the context of the crypto market, this often means moving into "high-beta" altcoins.
Understanding "ETH Beta"
In traditional finance, "beta" measures an asset's volatility in relation to a benchmark, like the S&P 500. An asset with a beta of 1.5 is expected to move 1.5% for every 1% move in the benchmark. In cryptocurrency, Ethereum itself often acts as a benchmark for the broader altcoin market.
"ETH beta" refers to altcoins that are highly correlated with Ethereum's price but exhibit much higher volatility. These are typically smaller, newer, or more speculative projects within Ethereum's ecosystem. The logic behind the "ETH beta play" is straightforward:
• If you believe Ethereum will eventually break through its resistance wall and rally, you can simply buy and hold ETH.
• However, if you want to maximize potential returns, you can instead buy a high-beta altcoin. The thesis is that when ETH finally moves up 10%, this smaller altcoin might surge 30%, 50%, or even more.
This strategy is essentially a leveraged bet on Ethereum's success, but without using financial leverage like futures or options. The leverage comes from the inherent volatility of the smaller asset.
The Allure of "Cheap Crypto"
The rotation often targets what is colloquially known as "cheap crypto." This term doesn't necessarily mean the project is undervalued, but rather that its token has a low unit price (e.g., under $1 or even fractions of a cent). This has a powerful psychological appeal:
• Accessibility: It feels more accessible to buy 1,000,000 tokens of a memecoin for $1,000 than to buy a fraction of one ETH.
• Perceived Upside: The low unit price creates the perception of explosive growth potential. It's psychologically easier to imagine a token going from $0.01 to $0.10 (a 10x return) than it is to imagine ETH going from $2,800 to $28,000.
During Ethereum's consolidation, we would likely see this rotation manifest in several key sectors of its ecosystem:
• Layer 2 Solutions: Projects like Arbitrum (ARB), Optimism (OP), and Polygon (MATIC) are prime candidates. They are fundamentally linked to Ethereum's scalability and success, making them a direct beta play. As traders anticipate an ETH breakout, they will front-run the move by accumulating these L2 tokens.
• DeFi Blue Chips and Dapps: Protocols for lending, borrowing, and trading, such as Uniswap (UNI), Aave (AAVE), or Lido (LDO), also fall into this category. Their usage and value are directly tied to the health of the Ethereum network.
• Memecoins and Newer Narratives: This is the highest-risk, highest-reward end of the spectrum. Memecoins built on Ethereum (like PEPE or SHIB) or on its Layer 2s can experience parabolic rallies based on pure speculation and social media hype, driven by the narrative that a rising ETH tide will lift all boats.
This rotation is a double-edged sword. While it signals underlying bullish conviction in the Ethereum ecosystem, it also diverts buying pressure away from ETH itself, potentially prolonging the consolidation phase. However, it is a clear sign that the market is positioning for an eventual breakout.
Part 3: The Bull Case - Charting a Path to the $2.9K Breakout
Despite the formidable resistance, a powerful bull case for Ethereum is building, suggesting that a breakout above the $2,900 level is not a matter of if, but when. This optimism is rooted in a combination of bullish technical patterns, strengthening on-chain fundamentals, and a powerful external narrative.
The Technical Setup for a Breakout
While the price may be moving sideways, a closer look at the chart often reveals underlying strength building beneath the surface. Several technical patterns and indicators could signal an impending breakout:
• Ascending Triangle Formation: A classic bullish pattern. This would be characterized by the price making a series of higher lows while being capped by the horizontal resistance of the volume wall (around $2,850-$2,900). The higher lows indicate that buyers are becoming more aggressive on each dip, squeezing the price upwards against the resistance. A breakout from the top of this triangle would be a powerful technical signal.
• Bullish Engulfing or Hammer Candlesticks: The appearance of strong bullish candlestick patterns at key support levels below the range would indicate that buyers are stepping in with force, absorbing selling pressure and defending the uptrend.
• Resetting Momentum Oscillators: During a consolidation phase, indicators like the Relative Strength Index (RSI) will cool off from "overbought" levels. If the RSI can reset back to neutral territory (around 50) while the price remains stable, it suggests the market is building up energy for another push higher without being overextended. A "hidden bullish divergence," where the price makes a higher low while the RSI makes a lower low, would be an even stronger signal of trend continuation.
• Support from Key Moving Averages: For the bull case to remain intact, Ethereum's price must hold above critical long-term moving averages, such as the 50-day and 200-day Simple Moving Averages (SMAs). These levels often act as dynamic support, and successful bounces from them reinforce the underlying bullish trend.
Fundamental and On-Chain Catalysts
Beyond the charts, Ethereum's fundamental health provides a strong tailwind for a potential rally:
• The Spot Ether ETF Narrative: The single most powerful potential catalyst on the horizon is the approval of a spot Ether ETF in the United States. Following the monumental success of the Bitcoin ETFs, the market anticipates that an Ether ETF would unlock a similar torrent of institutional capital. This narrative alone is enough to encourage accumulation, as investors look to position themselves ahead of a potential approval. Any positive news or regulatory progress on this front could provide the immense buying pressure needed to shatter the volume wall.
• Deflationary Supply Dynamics (The Burn): Thanks to the EIP-1559 upgrade, a portion of every transaction fee on Ethereum is "burned," or permanently removed from circulation. During periods of high network activity, this can make ETH a deflationary asset, meaning more coins are being destroyed than created. This programmatic scarcity is a powerful long-term value driver that makes holding ETH more attractive.
• The Growth of the Layer 2 Ecosystem: The success of Layer 2 solutions like Arbitrum and Optimism is not a threat to Ethereum but a testament to its success. These networks bundle transactions and settle them on the Ethereum mainnet, increasing its overall throughput and utility. A thriving L2 ecosystem drives demand for ETH as the ultimate settlement and data availability layer, strengthening its fundamental value proposition.
• Staking and Supply Sinks: A significant and growing portion of ETH's total supply is locked up in staking contracts to secure the network. This staked ETH is effectively removed from the liquid, circulating supply available for sale on exchanges. This continuous supply reduction creates a "supply shock" dynamic, where even a moderate increase in demand can have an outsized impact on the price.
When these technical and fundamental forces align, they create a powerful case that the consolidation phase is a temporary pause before the next major uptrend. A decisive break and close above $2,900 would liquidate short positions, trigger FOMO (Fear Of Missing Out) buying, and likely signal the start of a rapid move towards the next major psychological and technical target, potentially $3,500 or higher.
Part 4: The Bear Case and Prevailing Risks
A balanced analysis requires acknowledging the significant risks that could invalidate the bullish thesis. The volume wall is formidable for a reason, and a failure to break through could lead to a sharp reversal. Several factors could contribute to a bearish outcome for Ethereum.
Rejection at the Wall
The most immediate risk is a decisive rejection from the volume wall. If buying pressure wanes and sellers take firm control within the $2,750-$2,850 range, it could signal a local top. This would likely be confirmed by a break below the recent series of higher lows and key moving averages. Such a rejection could trigger a cascade of stop-loss orders from long positions, accelerating a move downwards to retest lower support levels, potentially in the $2,400-$2,500 range.
Macroeconomic Headwinds
As a major global asset, Ethereum is not immune to the broader macroeconomic environment. A "risk-off" sentiment sweeping through traditional markets would almost certainly impact crypto. Factors that could trigger this include:
• Hawkish Central Bank Policy: Unexpectedly high inflation data could force central banks like the Federal Reserve to maintain high interest rates for longer, or even signal further hikes. This "tight liquidity" environment is generally negative for risk assets like cryptocurrencies.
• Geopolitical Instability: An escalation of global conflicts can cause investors to flee to perceived safe havens like the US dollar or gold, pulling capital away from more speculative markets.
• Recessionary Fears: Signs of a weakening global economy could dampen investor appetite for risk, leading to broad-based selling across asset classes.
Regulatory Uncertainty
Regulatory risk remains a persistent cloud over the entire crypto industry, and Ethereum is at the center of a key debate. The U.S. Securities and Exchange Commission (SEC) has not definitively clarified whether it views ETH as a commodity (like Bitcoin) or a security. A negative ruling, or even prolonged legal battles suggesting it will be classified as a security, could have a chilling effect on the market. It would create significant compliance hurdles for exchanges and could derail the spot Ether ETF narrative entirely. Any negative headline on this front could be the catalyst that turns the volume wall from a temporary obstacle into an impenetrable ceiling.
Competitive Pressures
While Ethereum remains the dominant smart contract platform, it faces ever-growing competition from other Layer 1 blockchains (often dubbed "ETH Killers") like Solana, Avalanche, and others. These platforms boast high transaction speeds and low fees and are constantly vying for market share in the DeFi and NFT spaces. While a multi-chain future is the most likely outcome, a significant migration of developers and users away from Ethereum to a competitor could erode its network effect and negatively impact its long-term valuation.
Conclusion: A Pivotal Moment of Decision
Ethereum stands at a critical juncture, a crossroads where powerful bullish and bearish forces are locked in a tense equilibrium. The price is pinned against a heavy volume wall, a technical barrier representing the collective memory of the market. This has forced the asset into a period of consolidation, a sideways grind that is testing the patience of even the most steadfast bulls.
This very consolidation is fueling a secondary narrative of capital rotation, where traders, anticipating an eventual breakout, are channeling funds into higher-volatility "ETH beta" plays. The rallies in Layer 2 tokens and other ecosystem projects are a vote of confidence in Ethereum's future, a sign that the market is positioning for upside. The fundamental picture, bolstered by the potential of a spot ETF, deflationary supply mechanics, and a thriving ecosystem, provides a strong foundation for the bull case. The path to a $2,900 breakout seems not only possible but plausible.
However, the risks are undeniable. A failure to breach the wall could lead to a sharp correction, exacerbated by potential macroeconomic headwinds or negative regulatory surprises. The outcome of this battle will be pivotal. A successful breakout would reaffirm Ethereum's market leadership and likely kickstart a new wave of adoption and price appreciation across the entire altcoin space. A rejection would signal a deeper correction and a longer period of uncertainty. For now, the market holds its breath, watching the wall, waiting for the rotation to culminate, and anticipating the decisive move that will set the tone for the months to come.

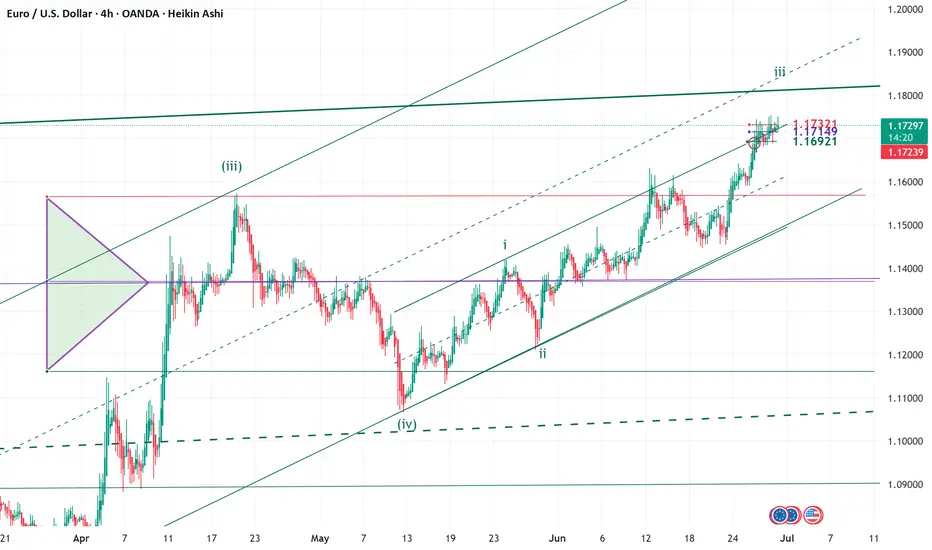
ELLIOTT WAVE EURUSD H4 update
EW Trade Set Up H4
minuette W4 ended, w5 running
with the decisive break of the 1.1570 level, wave 4 can be declared finished and wave 5 is underway in motive way. Not clear yet the type of motive wave impulsive or diagonal.
daily key levels (area)
1.1732
1.1715 POC
1.1690
XAGUSD – Bullish Setup for a Move Toward 40 1. What happened recently
After the massive selloff in early April, Silver (XAGUSD) reversed aggressively — gaining nearly 10,000 pips and breaking into multi-decade highs near 38. That kind of move is not noise. It’s power.
The month of June brought consolidation, with price slowly correcting and stabilizing. But this doesn’t look like distribution — it looks like new accumulation.
2. The key question
Is Silver building a base for the next breakout, or has the rally run out of steam?
3. Why I expect another leg up
- 35.00 is now acting as a solid support — tested, respected
- The correction has been shallow, typical for a bull rectangle structure
- Momentum remains on the buyers’ side — no major breakdown signs
- If buyers step in strongly, the next target is clearly the 40.00 psychological level
- This is a textbook bullish continuation setup.
4. Trading plan
Swing traders should watch the 35.00–35.20 zone for buying opportunities.
The risk/reward is attractive — with a potential for +5000 pips on a move toward 40, while keeping stops under the base.
Buy the dips — not the breakouts.
5. Final thoughts 🚀
Silver is shining again. The trend is up, the structure supports further gains, and the chart is offering a clean setup. Until 35 fails, the bias remains bullish.
Disclosure: I am part of TradeNation's Influencer program and receive a monthly fee for using their TradingView charts in my analyses and educational articles.

How To Short Sell This Forex Pair In A 4h (Time Frame) EntryAm always a curious person and thats what
allows me to penetrate any culture.I have this knack for adventure.
This is means i enjoy challenging myself.
I dont want to live a boring life.So even when i visit
a "Extremely High" poverty area, am good.
Because i know i have to check in.
Every place in the world has these places.
You have to check in with the G's of
that area otherwise you cooked!!. These areas
are notorious to high crime, and disease.
So if you dont check in bro you f'*d!
Remember every trading signal has to have a double confirmation
think of this double confirmation like
checking in the "hood".
You might be the king in your area
but in another area bro you aint the king.
You have to stay humble.
If you want to learn more you have to check in
with the financial trading experts like myself.
Is that fair? heck no.But you gots to check in man.
If you want more coaching just hit
me up for a reason fee on a monthly
basis and i got you.
Rocket boost this content to learn more.
Disclaimer:Trading is risky learn risk management
and profit taking strategies.Also don't use margin.
Use a simulation trading account
before you trade with real money.

Btc have big long chanceI want to get an optimistic scenario from Bitcoin, which can increase up to five times as far as the history of Hawings.
🇮🇷Long Live Iran🇮🇷
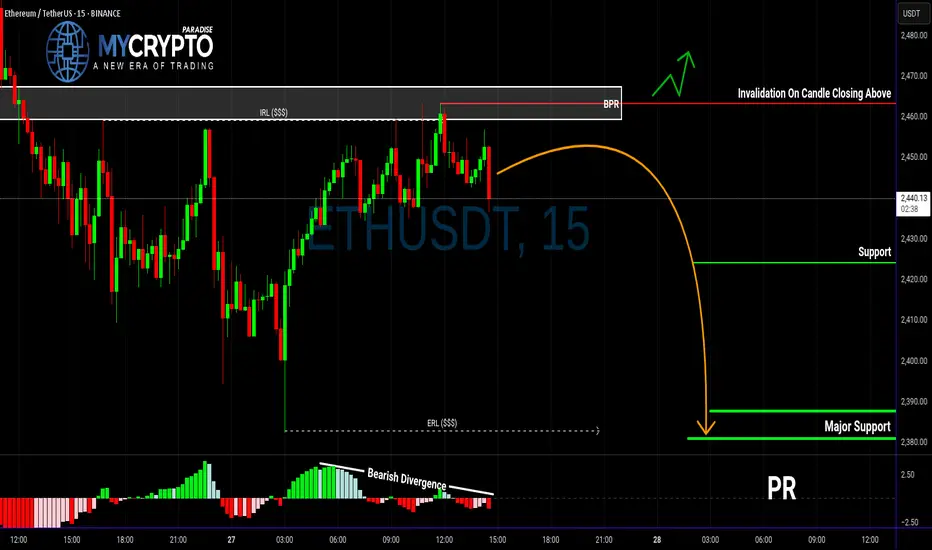
ETH in Trouble? This Breakdown Could Be Just the BeginningYello, Paradisers — are you spotting the same warning signs we did before the last major ETH correction? If not, now’s the time to pay close attention.
💎ETHUSDT is currently showing multiple bearish signals across both higher and lower timeframes. On the higher timeframe, we’ve confirmed a bearish Change of Character (CHoCH), which is often the first major clue that momentum is shifting from bullish to bearish. This shift suggests that ETH could be preparing for a deeper move down.
💎On the 15-minute timeframe, price has reacted directly from the BPR zone. What adds even more weight to this reaction is the clear bearish divergence we’re seeing on the MACD indicator. Together, these signs point to increased bearish pressure in the short term.
💎More importantly, ETH has already taken out Internal Range Liquidity (IRL), which often sets the stage for a move toward the External Range Liquidity (ERL). When IRL gets swept and momentum remains bearish, it’s typically a sign that the market is hunting for liquidity on the other side of the range—and that’s exactly where we believe ETH is headed next.
💎That said, to take this setup with high confidence, we’re waiting for a clean bearish candlestick pattern to form. Confirmation is key. A solid entry backed by strong price action improves the probability of success and allows for tighter, more efficient risk management.
💎However, if ETH breaks out and closes decisively above our invalidation zone, the entire bearish idea is off the table. In that scenario, patience will be our best tool—we’ll wait for price action to realign and only re-enter the market once a new high-probability setup presents itself.
🎖Strive for consistency, not quick profits. Treat the market as a businessman, not as a gambler. Patience and discipline are what separate the professionals from the herd. Stick to the process, trust the strategy, and you’ll stay ahead of 90% of the market.
MyCryptoParadise
iFeel the success🌴