Nike Wave Analysis – 21 April 2025
- Nike reversed from the long-term support level 52.60
- Likely to rise to resistance level 60.00
Nike recently reversed from the strong support area between the long-term support level 52.60 (which has been reversing the price since 2012) and the lower monthly Bollinger Band.
This support area was strengthened by the support trendline of the long-term down channel from the start of 2023.
Given the strength of the support level 52.60 and the oversold monthly Stochastic, Nike can be expected to rise to the next resistance level 60.00.
M-oscillator

Bitcoin Bearish Dead Cat BounceI am not a financial advisor. This is not meant to be and does not constitute financial, investment, trading, or any other types of advice or recommendation.

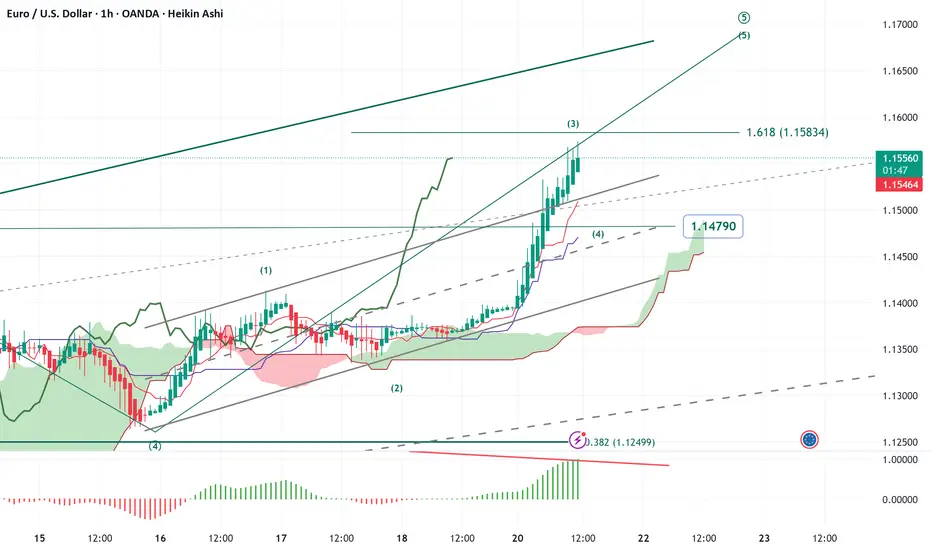
EWTSU EURUSD H1 minuette ((iii)) is going to end
Elliott wave trade setup EURUSD H1
minuette ((iii)) is going to end
micro wave ((5)) of subminuette v of minute (iii) is going to end in five waves:
micro wave degree is developping -> (3)-(4)-(5)
once minute ((iii)) is finished corrective minuette (iv) should follow
EWTS XAUUSD H1 subminuette v developping
Elliott wave trading setup XAUUSD H1
subminuette wave v of minuette wave (i) going to end in 5 micro waves.
once minuette wave (i) is finished then minuette wave (ii) should follow in a corrective mode

What If Trump’s Tariffs Are Actually Bullish for SPX ?Hello Traders 🐺
In this idea, I want to take a closer look at SPX and break down why the new U.S. tariffs and Trump’s economic policies could either boost or damage the U.S. economy in the coming months. So make sure to stay with me until the very end.
🔍 Let’s start with the chart:
As you can see, SPX is currently holding above a weekly support level, marked by the orange ascending trendline. So far, so good. However, we’re also seeing a massive bearish divergence on the RSI — and in my opinion, this was one of the key reasons behind the recent Black Monday-style selloff.
⚠️ But here’s the deal: If SPX breaks below this orange trendline, the next strong support is around 3375 — aligned with the 0.5 Fibonacci level and the monthly blue trendline inside our green support zone.
🤔 Should we be bearish on SPX and the U.S. economy?
That’s the big question… and it’s tricky to answer right now. Let’s break it down.
🔧 1. Tariffs and Trump: What’s really going on?
We’re currently in a pause phase of the ongoing tariff war — with countries negotiating to avoid escalation. But here’s the catch: markets hate uncertainty, and that’s why we saw panic selling recently.
Still, most people miss the bigger picture here.
The U.S. has long been a consumer-driven economy, importing heavily from other nations. Meanwhile, U.S. producers have struggled to compete — both domestically and internationally — due to low tariffs at home and high tariffs abroad.
So what do Trump’s new tariffs do?
✅ They level the playing field for U.S. companies at home
✅ They push other countries to lower their tariffs through negotiation
✅ They reduce dependency on foreign imports and support domestic production
In short, if combined with smart monetary policy, these moves could actually help revive U.S. manufacturing and strengthen the economy in the mid-to-long term.
📉 Final thoughts on SPX:
I personally don’t believe the bearish breakdown is coming — but as a trader, I focus on reality, not preference. Right now, we’re still holding above major support, and unless that breaks, the bullish scenario remains in play.
Let me know what you think about this macro setup in the comments.
And as always remember:
🐺 Discipline is rarely enjoyable, but almost always profitable 🐺
🐺 KIU_COIN 🐺

Bitcoin UP!A new Bitcoin ATH appearance is possible after saying Hello! to our green rising trend line from way back!
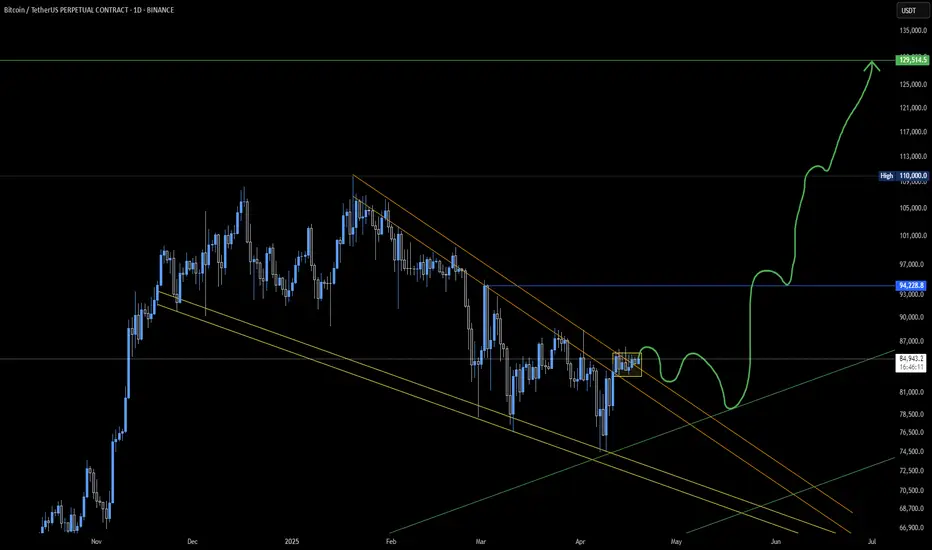
BTCUSDT - Trade Log BTCUSDT – Weekly Bullish Outlook
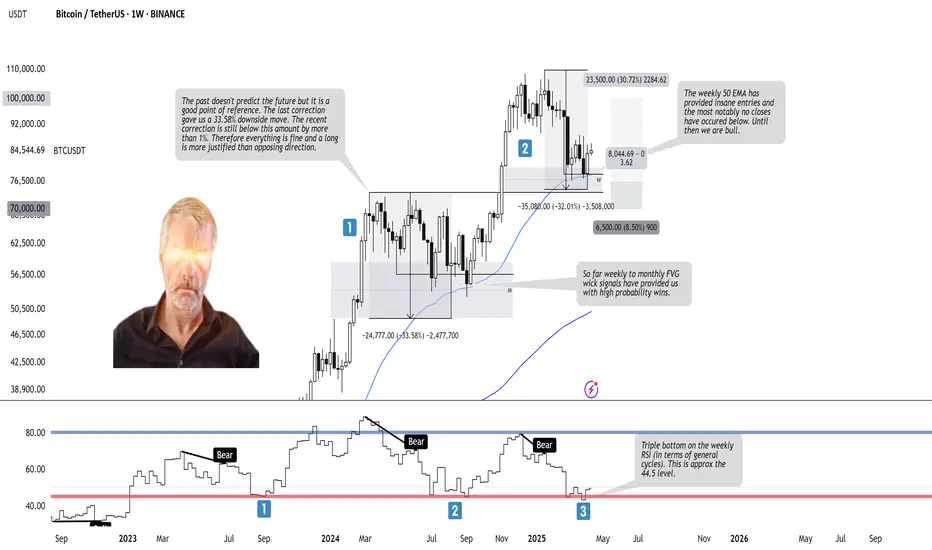
Weekly Context: Price has held the weekly Fair Value Gap and bounced off the 50 EMA, with clean wick rejections signaling strong buyer demand. The recent pullback (~32% from ATH) remains within historical correction bounds, and the tiny current retrace (<1%) suggests low downside risk. A triple bottom on the weekly RSI cycle around 40 further supports a bullish reversal.
Trade Plan (Long):
– Entry: Add longs near the weekly FVG / 50 EMA (around 75–87k).
– Stop: Place just below the FVG low (≈70k), risking ~5% of account.
– Target: First at 100k (psychological level), then previous ATH region for a 1:3+ RRR.
Bullish Catalysts:
• Weekly 50 EMA has only closed below twice—support intact.
• Weekly FVG wick signals have historically delivered high-probability bounces.
• Triple bottom on weekly RSI signals major capitulation is complete.
• Macro backdrop (equities & gold) remains positive for BTC.
Stay alert for any decisive weekly close below the EMA—until then, the bulls remain in control. 🚀
LINK Potential Falling Channel Reversal + RSI SignalsBINANCE:LINKUSDT has been in a downtrend since December, grinding inside a falling channel for 2 months, and it's now sitting right above the key ~$10.00 demand zone.
Price Action
• Price is respecting both bounds of a well-defined falling channel.
• Currently consolidating just above the demand area, early signs of potential strength.
RSI Insights
• Clear bullish divergence at demand zone retest.
• RSI could be approaching a breakout of its multi-month downtrend — worth watching closely.
Key Zones
• Support: $9.5–$10.5 is critical. It held last time and could fuel a reversal. If broken, it would invalidate the setup.
• Resistance: Falling channel upper boundary.
• Confirmation: RSI breakout + channel breakout = potential confirmation of trend reversal.
Also watch $15.5-$16 (previous S/R) and the whole $18-$20 area, which previously acted as support and has a high volume traded. Both could be good levels to take profits, together with the main supply zone in the $25-$27 area.
Still in a No-Trade Zone until a breakout is confirmed.

These 3 Things Will Show You How To Take Profit On Trades.Its been a crazy week.This is because i am developing
a new trading strategy.Trying to learn something new
is not easy at all.
When you look at this chart you will see:
-The cross below the 20 level
-The blue line is above the orange line
-The Stochastic has coordinates
These 3 things will show you how to take profit on
trades.Also they will show you when to enter them.
i had to change Stochastic coordinates
to show you the "Dip Buy" Strategy.
This strategy is based on buying
prices that are cheap.
It is not easy to follow.Because when you decide to
buy at these prices,You are going against the crowd.
To take profit , you have to exit at the top of this indicator.
This is why these coordinates are important.The purpose
is to show you when to take profit, and how to take profit.
This will help you on your trading path.
Rocket boost this content to learn more.
Disclaimer:Trading is risky please risk management
and profit taking strategies.Also feel free to
use a simulation trading account.

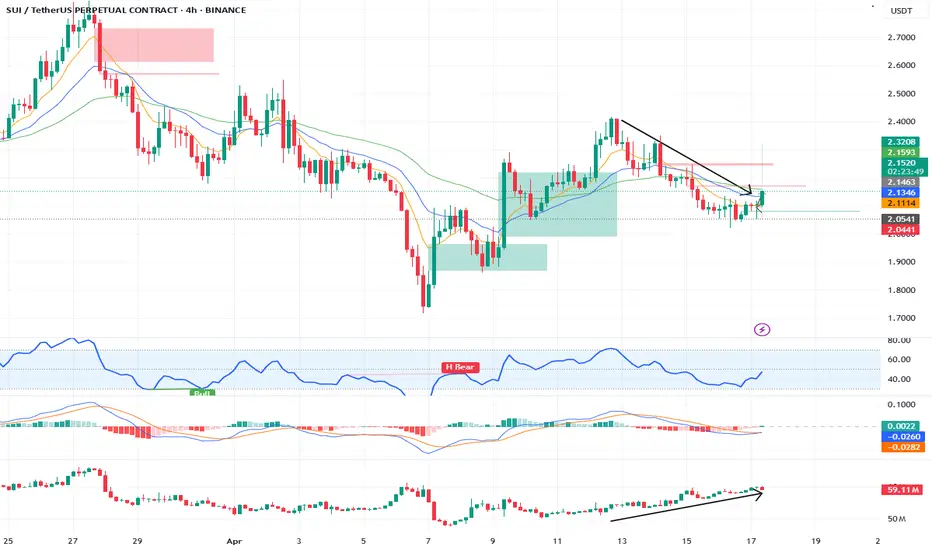
Long setup on SUISetting up long for SUI.
Using 4H time frame.
You can see OI increasing and Price decreasing which is divergence.
Silver Bulls Breaks Resistance, Eyes on $34.57 RetestThe upside risk we flagged earlier this week has now materialised for silver, with the spot price staging a bullish break above the 50-day moving average, resistance at $32.73, and the December 2024 uptrend on Wednesday.
Having closed above this former resistance zone, it may now provide a base for fresh longs targeting a retest of the March 28 swing high at $34.57. Levels to watch in between include Wednesday’s high at $32.16 and $33.50 which acted as support around the turn of the month. A stop loss beneath the uptrend would offer protection should the trade move against you.
While momentum indicators remain more neutral than outright bullish, the bias is to the upside following the breakout and ongoing trends in RSI (14) and MACD.
Good luck!
DS

Bitcoin is heading into its final low before bull market?Bitcoin got rejected at the 1-Day Cycle top and is now pulling back toward the 1-Day Cycle lows.
While most investors are getting bored and slowly shifting their attention elsewhere, crypto is quietly consolidating and gearing up for a BIG move...
Will we break above $100K, or are we heading into a recession and full-on bear market mode?
Next week will be a decisive one for the entire crypto market this year.
If Bitcoin manages to hold above $77,000 as the 1-Day Cycle hits Day 20, we could be on the verge of a run toward $100K. But if we drop below the previous 1-Day Cycle low, trouble’s coming.
Confused? Just check out this chart.
It’s easy to lay out both the bullish and bearish cases—but it’s a whole different game to quantify, commit to a position, and wait for the more probable outcome to play out.
Which scenario is more likely?
In short: the green one . Here’s why:
The 2-Week Cycle has spent over 4 weeks below 20, completely crushing bullish sentiment.
The 1-Week Cycle has been below 20 for over 2 months—the longest stretch in the past 5 years.
The 3-Day Cycle hasn’t fully reset, but reversed to the upside last week due to positive price action.
We’re on Day 46 of the 60-Day Cycle, and price has been holding up well. We’ve tested the $80K zone a couple of times, and Bitcoin still seems eager to push higher.
For the first time in a while, there are more bears than bulls (according to Polymarket).
On that note—check the Polymarket predictions

BTC.D Bitcoin Dominance!Are you ready for a big Altcoin rally? We are facing an Altcoin Season that may not last long. Load Your Bullets!

Bitcoin: Shooting Star Breaks Wedge, Bearish Bias BuildsDownside risks appear to be growing for bitcoin with Tuesday’s shooting star candle triggering a bearish break of the rising wedge it had been sitting in over the past week.
Shorts could be established on the break with a stop above Tuesday’s high for protection. Some may opt for the 200DMA as a trade target, but the preference would be to look for a return to the lows beneath $75,000 hit last week.
The neutral momentum picture is also showing signs of turning bearish, with RSI (14) breaking its uptrend as a result of the latest pullback. While RSI is trending higher, it remains in negative territory, indicating downside momentum is only lessening—not reversing entirely.
Good luck!
DS

USDJPY Wave Analysis – 15 April 2025
- USDJPY reversed from long-term support level 142.00
- Likely to rise to the resistance level 144.65
USDJPY currency pair recently reversed up from the support zone between the long-term support level 142.00 (which has been reversing the price from the end of 2023), support trendline of the weekly down-channel from January and the lower weekly Bollinger Band.
The upward reversal from this support zone stopped the previous intermediate impulse wave (3) from last month.
Given the strength of the support level 142.00 and the oversold weekly Stochastic, USDJPY currency pair can be expected to rise to the next resistance level 144.65.

Best Technical Indicator to Identify Order Block & Imbalance
Your ability to correctly identify Order Blocks on a price chart is essential for profitable trading Smart Money Concept.
In this article, I will show you a great technical indicator that will help you to spot Order Blocks on any financial market.
First, in brief, let me give you my definition of Order Block.
The problem is that in SMC trading there is no one single definition of that and many traders interpret it differently.
To me, an Order Block is a specific zone on a chart from where a strong price movement initiates and where a significant imbalance between supply and demand occurs .
This imbalance should strictly originate from a liquidity zone.
That definition implies that in order to identify an Order Block zone, one should learn to properly identify the imbalance and liquidity zones.
And again, there is no precise definition of an imbalance on a price chart. To me, a bullish imbalance is a formation of a bullish engulfing candle - the one that engulfs a range of previous bearish candle with its body.
Above is the example of a valid Order Block on GBPUSD.
A bearish imbalance is a formation of a bearish engulfing candle - the one that engulfs a range of a previous bullish candle with its body.
Above, you can see the example of an Order Block on USDCAD, based on a bearish imbalance.
There is one technical indicator that will help you to recognize such Order Blocks. It is called " All Candlestick Patterns" on TradingView.
Open settings of the indicator and make it show ONLY Engulfing Candles and choose "No Detection" in "Detect Trends Based on".
After that, hide the indicator and first, Identify the liquidity zones on a chart and wait for a test of one of these zones.
Here is a test of a liquidity zone on NZDUSD on an hourly time frame.
After that, turn on the indicator, and wait for its signal.
You can see that after some time, the price formed a bullish imbalance with a bullish engulfing candle. The indicator highlight that candle.
The Order Block zone will be based on the lowest low of 2 candles and the high of a bearish candle preceding the imbalance.
One more example. We see a test of a significant liquidity zone on EURAUD on a 4H time frame.
We turn on the indicator and look for a signal.
A bearish imbalance is formed and the indicator immediately notifies us.
An Order Block Zone in that case will be the area based on the highest high of 2 candles and the low of a bullish candle preceding the imbalance .
Of course, there will be the rare cases when the indicator will miss the imbalances. But while you are learning to recognize Order Blocks, this indicator will definitely help you a lot!
Thank you for reading!
❤️Please, support my work with like, thank you!❤️
I am part of Trade Nation's Influencer program and receive a monthly fee for using their TradingView charts in my analysis.

EURCHF Wave Analysis – 14 April 2025
- EURCHF reversed from support zone
- Likely to rise to resistance level 0.9365
EURCHF currency pair recently reversed up from the support area between the strong long-term support level 0.9245 (which has been reversing the price from the end of 2023) and the lower weekly Bollinger Band.
The upward reversal from this support area stopped the previous downward impulse waves 3 and (3).
Given the strength of the support level 0.9245 and the bullish divergence on the weekly Stochastic indicator, EURCHF currency pair can be expected to rise to the next resistance level 0.9365.

AUDUSD Wave Analysis – 14 April 2025- AUDUSD reversed from the long-term support level 0.5945
- Likely to rise to resistance level 0.6400
AUDUSD currency pair recently reversed up from the support area between the major long-term support level 0.5945 (which started the sharp weekly uptrend in 2020) and the lower weekly Bollinger Band.
The upward reversal from this support area created the weekly Japanese candlesticks reversal pattern Bullish Engulfing – strong buy signal for AUDUSD .
Given the clear bullish divergence on the weekly Stochastic indicator and the strongly bearish US dollar sentiment, AUDUSD currency pair can be expected to rise to the next resistance level 0.6400.

Nifty Trend directionNifty 22828 - Is trading in rounding bottom pattern in daily chart. Immediate support at 22430 and Support 2 at 22030. Resistance at 23440 and 23856

Monday bounce points to extension of bullish move
Silver bounced off minor support at $31.84 in early Asian trade on Monday, indicating the level may be useful for traders eyeing a potential bullish setup.
Longs could be established above the level with a tight stop beneath to protect against reversal. Overhead, former uptrend support currently intersects with the key 50-day moving average around $32.50, making that a potential initial target. A break above would bring $32.73 into play, a level that acted as both support and resistance during March.
The momentum picture has become more palatable for bulls, with RSI (14) trending higher and back near neutral. MACD remains in negative territory and is yet to cross the signal, though it’s starting to curl higher, suggesting bearish momentum is ebbing.
If silver reverses and breaks $31.84, the setup would be invalidated, opening the door to trades targeting a partial retracement of the recent bounce.
Good luck!
DS

RSI 101: Revealing the Special Characteristics of RSIWhy does RSI have support and resistance levels at 40 and 60?
Why does divergence happen between RSI and price?
What is RSI momentum?
All the characteristics of RSI (that I know) will be explained here.
Formula and Meaning
If you are using TradingView, you probably already know what RSI is and what "overbought" and "oversold" mean. So, I won’t repeat it here. Instead, I’ll dive deeper into the true nature of RSI, giving you a different perspective.
You can skip the mathematical formula of RSI, it’s already discussed everywhere online. Just remember this ratio table:
Here’s how I explain the table:
At RSI = 50, the average gain equals the average loss (I'll call this the buy/sell ratio). This is a balanced point. Buyers and sellers are equally strong.
At RSI ~ 60 (66.66), the buy/sell ratio = 2/1. Buyers are twice as strong as sellers.
At RSI ~ 40 (33.33), the buy/sell ratio = 1/2. Sellers are twice as strong as buyers.
At RSI = 80, the buy/sell ratio = 4/1. Buyers are four times stronger.
At RSI = 20, the buy/sell ratio = 1/4. Sellers are four times stronger.
The formula shows that when RSI reaches 80 or 20, the buyer or seller is extremely strong — about four times stronger — confirming a clear trend.
At these levels, some Trading strategies suggest placing a Sell or Buy based on the overbought/oversold idea.
But for me, that’s not the best way. The right approach is: when a trend is clearly formed, we should follow it.
I'll explain why right below.
Look at this chart showing RSI changes with the buy/sell ratio:
When RSI > 50:
When RSI < 50:
You can see that the higher RSI goes, the slower it climbs, but the high buy/sell ratio makes price move up faster.
Similarly, when RSI goes lower, it drops slower but price drops faster.
That’s why at overbought (RSI=80) or oversold (RSI=20) areas, you need to be careful. Even a small RSI moving can lead to big price changes, easily hitting your stop loss.
On the other hand, if you follow the trend and wait for RSI to pull back, you will trade safer and more profitably.
RSI Key Levels
Here are some special RSI levels I personally find useful when observing FX:XAUUSD :
(These levels are relative. They might vary with different timeframes or trading pairs. Check historical data to find the right ones for you. On bigger timeframes like M15 or above, the accuracy is better.)
RSI = 20
When RSI hits 20, sellers dominate. This confirms a trend reversal to bearish.
RSI = 80
When RSI hits 80, buyers dominate. This confirms a trend reversal to bullish.
RSI = 40
This is a sensitive level. Sellers start gaining the upper hand (sell/buy = 2/1).
If buyers lose 40, they lose their advantage.
So RSI >= 40 is "buyer territory". In an uptrend, RSI usually stays above 40.
RSI = 40 acts as support in an uptrend.
RSI = 60
Same idea. RSI <= 60 is "seller territory".
RSI = 60 acts as resistance in a downtrend.
40 and 60 are considered the key levels of RSI.
Now you guys know why RSI has support/resistance around 40/60!
RSI Range
As you know, RSI moves between 0 and 100.
Since RSI >= 40 is buyer territory, we can see the relationship between price and RSI:
When RSI stays above 40, price tends to move in an uptrend:
When RSI stays below 60, price tends to move in a downtrend:
When RSI stays between 40 and 60, buyers and sellers are balanced, and price moves sideways in a box:
When RSI is moving, It creates a RSI Range.
Whenever the trend switches between the three states — uptrend, sideways, and downtrend — a Range Shift is formed.
At first, RSI moves in 40-60 range, price moves sideways. A strong price move pushes RSI to 80. Later, RSI stays above 50, helping price grow strongly. When momentum fades, RSI returns to 40-60 and price moves sideways again.
Note:
RSI reflects Dow Theory by showing the stages of accumulation, growth, and distribution.
And as you see, when RSI touches key levels, the trend often pulls it back.
RSI Momentum
Price momentum means how fast price changes.RSI momentum represents the change in the strength between buying and selling forces.
When RSI > 50:
If price falls, RSI shows high momentum — RSI drops fast but price drops slowly.
If price rises, RSI shows low momentum — RSI rises slowly but price rises fast.
For example, at first RSI is above 50.
Price drops from (a) to (b) by 44 units, RSI drops from (Ra) to (Rb) by 25 units.
Later, RSI drops from (Rb) to (Rc) (also 25 units) but price drops from (b) to (c) by 73 units.
When RSI < 50:
If price falls, RSI has low momentum — RSI drops slowly but price falls fast.
If price rises, RSI has high momentum — RSI rises fast but price rises slowly.
RSI and Price Divergence
Divergence happens when price and RSI move in opposite directions:
Price goes up but RSI goes down, or vice versa.
Why does divergence happen?
In a strong downtrend, price forms a bottom at point (1), and RSI drops to level (r1).
When a price pullback happens, price pushes up to a peak at point (2), and RSI also bounces back to level (r2).
Because the downtrend is strong, after completing the pullback (1-2), price continues to make a lower bottom at point (3).
At this point, remember the behavior of RSI momentum when RSI is below 50:
It takes a large price drop (from 2 to 3) to cause a small RSI drop (from r2 to r3).
Meanwhile, even a small price increase (from 1 to 2) causes a large RSI rise (from r1 to r2).
Since the distance (1-2) is smaller than (2-3), but the RSI move (r1-r2) is bigger than (r2-r3), divergence is created.
Divergence shows that the current trend is very strong, not a complete signal of a trend reversal.
(I might share with you how to spot a complete RSI reversal signal in future posts.)
As shown in the example above, after forming bottom (5) and creating a bullish divergence between (3-5) and (r3-r5), price still kept dropping sharply while RSI kept rising.
In these areas, if you keep trying to catch a reversal just based on divergence, you will likely need to DCA or cut your losses many times.
That’s why the most important thing in trading is always to follow the trend.
RSI Exhaustion
RSI Exhaustion happens when RSI keeps getting rejected by a resistance or support zone and can’t break through.
After a strong downtrend, RSI recovers but stalls around the 5x zone.
It tries many times but fails, showing buying power is weakening.
Then the downtrend continues:
Exhaustion near high or low RSI levels creates stronger divergences than exhaustion in the middle range:
Double or triple tops/bottoms on RSI (M or W shapes) basically indicate RSI exhaustion.
RSI Can Identify Trend Strength
In an uptrend:
If RSI pulls back to a higher level before going up again, the trend is stronger.
The pullback should not fall too deep (below 40).
Example:
First rally: RSI drops to 60 before rising again → strong rally (273 units).
Second rally: RSI drops to 50 before rising again → weaker rally (94 units).
Same idea for a downtrend:
If RSI pullbacks to 50 then drops again, the downtrend is stronger than if it pullbacks to 60.
RSI Support and Resistance
Besides 40-60 acting as support/resistance, RSI also reacts to old tops and bottoms it created.
Why does this happen?
RSI is calculated from closing prices.
On a higher timeframe, the candle close price is a high/low or support/resistance price on lower timeframes.
When RSI moves in a trend on a higher timeframe, it maintains a buy/sell ratio, forcing lower timeframe RSI to oscillate within a range.
Example:
On H4, RSI stays above 40 → uptrend.
It makes H1 RSI move between 30-80.
Sharp RSI tops/bottoms react even stronger because they show strong buying/selling forces.
Summary
When looking at the price chart, we can see that price can rise or fall freely without any defined boundaries.
However, RSI operates differently: it always moves within a fixed range from 0 to 100.
During its movement, RSI forms specific patterns that reflect the behavior of price.
Because RSI has a clear boundary, identifying its characteristics and rules becomes easier compared to analyzing pure price action.
By studying RSI patterns, we can make better assumptions and predict future price trends with higher accuracy.
I have shared with you the core characteristics of RSI, summarized as follows:
Besides overbought (80) and oversold (20), RSI respects 40 and 60.
40 is support level in an uptrend. 60 is resistance level in a downtrend.
In an uptrend, RSI stays above 40.
In a downtrend, RSI stays below 60.
An RSI Range-Shift leads to a trend change.
RSI Divergence shows strong trends.
Double or triple tops/bottoms show RSI exhaustion → potential reversals.
The higher the RSI level, the slower it moves, but the faster the price rises.
The lower the RSI level, the slower it moves, but the faster the price falls.
A strong uptrend can be identified when RSI moves within a higher range or shows continuous bearish divergences.
A strong downtrend can be identified when RSI moves within a lower range or shows continuous bullish divergences.
RSI reacts to its old tops and bottoms.
Sharper RSI peaks show stronger selling.
Sharper RSI bottoms show stronger buying.
In the next parts, I’ll show you how to apply these RSI's Characteristics to trend analysis, multi-timeframe analysis, and trading strategies, that you might have never seen before.
I trade purely with RSI. Follow me for deep dives into RSI-based technical analysis and discussions!

Bitcoin Dominance Update (1D)Bitcoin dominance is currently showing signs of weakness and appears to be losing momentum for another upward move.
If we see a breakdown below the 62% level, a sharp decline toward 57% is likely.
During this phase, it may feel like an altcoin season is approaching, but in reality, most altcoins will likely just be retracing previous losses rather than entering true price discovery.
Still, for those who buy the dips, it can present a profitable rally opportunity—especially in short to mid-term cycles.
— Thanks for reading.

Baidu Wave Analysis – 11 April 2025
- Baidu reversed from support zone
- Likely to rise to resistance level 90.00.
Baidu recently reversed from the support zone between the major long-term support level 78.60 (which has been reversing the price from the end of 2022) and the lower weekly Bollinger Band.
The upward reversal from this support level 78.60 is likely to form the weekly Japanese candlesticks reversal pattern Hammer (strong buy signal for Baidu).
Given the strength of the support level 78.60 and the clear bullish divergence on the weekly Stochastic indicator, Baidu can be expected to rise to the next resistance level 90.00.
