There is a good probability on the bullish side.There is a strong support zone holding on the weekly timeframe, and it's exactly from this level that a reversal signal has appeared on the four-hour chart, along with a structure shift and a candle close. Moreover, the RSI indicates a bullish divergence. Now, it's just the weekly trendline that needs to be broken—once that happens, nothing can stop ETH from turning bullish.
M-oscillator
Is the Finnish Bank OmaSp about to collapse?The charts are suggesting caution. On the above 10-day chart:
1) Double top in price.
2) Regular bearish divergence.
The higher the timeframe you look the more ugly this divergence is.
Laterally I’m wondering if the small banking crisis that hit the US is now venturing to other parts of the world. OmaSp does not appear to be in isolation.
There were some tell-tell signs before the collapses of Silicon Valley and Signature Banks. (No one in Europe heard of those banks!) They were:
1) Strong bond market exposure.
AND
2) Same TA as above.
“OmaSp has been active in the bond market since 2013” says their website. Very true..
Until recently you could get the information on their Bond market exposure.. You click on the WebPage today and you get:
www.omasp.fi
“Unfortunately the webpage you were looking for can not be found”
Oh dear…
Ww
Type: Trade, short
Risk: <=3%
Timeframe: Candles closing at 19 and under.
10-day Silicon Valley Bank
before
after
10-day Signature Bank
before
after
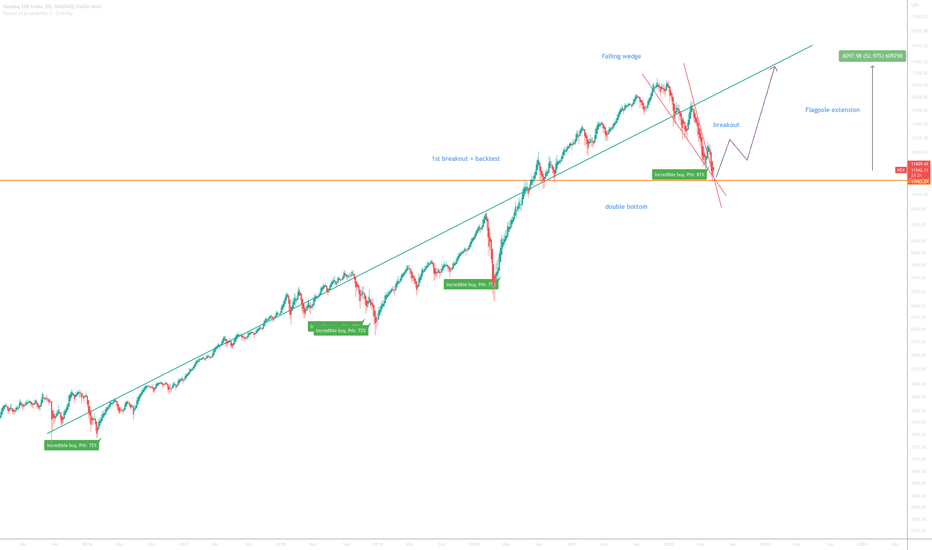
Nasdaq 100 to 17000On the above 3-day chart price action has corrected 33% since late December. A number of reasons now exist to be bullish, including:
1) The ‘incredible buy’ signal has printed. Look left.
2) The buy signal is coming in at 81% probability. The previous were 75%, 72@, & 72% percent, respectively. Look at the strength of if a 75% recovery, what do you think a 81% will be like? This can only be the result of a massive short squeeze, in my opinion.
3) Price action has just printed a ‘double bottom’ (orange line) on past support / resistance - look left!
4) Most recently price action has broken out of a bullish falling wedge formation with back test confirmation, see below.
Is it possible price action falls further? For sure.
Is it probable? No.
Good luck!
Ww
A little closer
EURUSD Testing A 25-Year Long Rising Trendline From BelowAfter breaking a 22-year long trendline 3 years ago, and testing it from below a few times, EURUSD has come back up to test what is now a 25-year long trendline.
A reversal pattern below this line on the monthly chart will suggest a potential reversal, while a firm close above this line will suggest a continuation up.
The stochastic indicator is signaling a bearish divergence, but it's not a clear cut.
USD/CAD bears eyeing deeper downside flushUSD/CAD bears will be eyeing a meaningful downside flush with the pair breaking and closing beneath the 200-day moving average on Thursday, hitting fresh year-to-date lows in the process.
The price now finds itself below 1.3947, the high set in August last year. The break may encourage others to join the bearish move, generating a setup where shorts could be established with a stop placed above the level for protection.
1.38115 screens as an initial target, with other minor levels such as 1.3748, 1.3700 and 1.3647 also in play. Momentum indicators favour retaining a bearish bias, with RSI (14) trending strongly lower but not yet oversold. MACD further bolsters the bearish signal.
If the price were to reverse back above the 200DMA, the overall bearish bias would be invalidated.
Good luck!
DS
Does History Repeat Itself? How Far Can the Nasdaq Fall?Let's examine the current 2025 correction on a logarithmic chart: the price movements show significant similarities to the February 2020 decline. At that time, the global crisis—then driven by COVID-19 panic—fundamentally influenced market movements, while now, trade uncertainties are generated by President Trump's aggressive tariff announcements.
The chart reveals that the Nasdaq is declining steeply, and technical levels play a decisive role: yesterday, the price bounced back from the 61.8% Fibonacci retracement level. However, it is clear that supporting technical indicators—such as the break of the RSI convergence trend on the days triggering the decline—confirm the downward movement.
In the earlier 2020 decline, massive volume accompanied the initial weeks' movements, while this year's movement is characterized by steadily increasing volume. Nevertheless, the current volume peak falls short of the peak measured in the 2020 week (4.45 million vs. 6.8 million), indicating that the trend may continue with further declines.
Overall, technical analysis—the examination of logarithmic charts, the break of the RSI trend, and volume movements—suggests that the current correction may deepen further, and the Nasdaq's target price can be estimated between 14,500 and 15,000 points.
Observing a similar scenario in history, when global events triggered high volatility, it appears that market reactions now do not differ from past patterns. If the current negative trend continues, a further deepening of the correction is plausible, as the lag in market volume (4.45M vs. 6.8M) indicates that investors have not yet been able to offset the negative sentiment prevailing in the sector.
ONDO Falling Wedge + Bullish DivergenceBITGET:ONDOUSDT is compressing inside a falling wedge, now trading near key support. Signs of potential reversal are building.
🔹 Key Observations
• Pattern: Falling wedge (bullish bias)
• Support: Price is holding just above the ~$0.68–$0.75 demand zone
• Volume: Declining throughout the wedge – typical pre-breakout behavior
• RSI: Bullish divergence forming + compression under 50, often seen before breakouts
🔸 What to Watch
• Breakout trigger: Daily close above wedge resistance (orange trendline), ideally with volume
• Target zones: $1.30 to $1.60, then $1.90 to $2.10 (prior S/R levels)
• Invalidation: Breakdown below the green demand zone ($0.68)
⚠️ As always, confirmation matters – no breakout yet. But the setup is clean and worth watching closely.
BTC/USD – Bearish Correction Ahead? Eyes on $44K
After failing to hold above the $70K psychological level, Bitcoin is showing clear signs of weakening momentum. The recent price action has formed a lower high, and bearish divergence on the RSI is becoming more evident across multiple timeframes.
From a technical standpoint, BTC is currently testing key support around $66K. A clean break below this zone could trigger further downside movement. Based on Fibonacci retracement levels and prior consolidation zones, the next significant support lies around the $44K area.
This level aligns with the 0.618 retracement from the recent bull run and coincides with previous accumulation zones from early 2024. A retest of this level could provide a healthier base for the next bullish wave.
🚨 Watch for a potential drop toward $44,000 in the coming weeks if current support fails to hold.
Long NQ FuturesLooking for a 50% retracement back to roughly the 19300 level. Will likely be a bumpy ride up, with the first test of resistance at 18300 (minor wave A), back down to the bottom of the gap at 16900 (minor wave B), and then back up to 19300 (minor wave C).
Expecting to reverse short once 19300 is reached, but will evaluate further if and when target is reached.
Bullish setup for Bitcoin for coming 6 monthsIf we look at pure technicals. Basic technicals, things couldn't be more bullish. The sentiment is at extreme fear, but look at this beautiful chart.
Maybe we chop here for a bit, but once the MACD flips in momentum weakness, then I suspect massive upwards move for Bitcoin.
Apple Wave Analysis – 9 April 2025
- Apple reversed from the support zone
- Likely to rise to the resistance level 180.00
Apple earlier reversed up from the support zone surrounding the long-term support level 170.00 (which has been reversing the price since the end of 2023) – standing very far below the lower weekly Bollinger Band.
The upward reversal from the support level 170.00 stopped the previous weekly downward impulse wave 3 from February.
Given the strength of the support level 170.00 and the oversold weekly Stochastic, Apple can be expected to rise to the next resistance level 180.00.
HBARUSDT Approaching Key Weekly Zone with Potential Reversal SetBINANCE:HBARUSDT HBARUSDT is approaching a weak support zone, which shows a higher probability of breaking due to insufficient strength. Below this lies a weekly strong Fair Value Gap (FVG), which is a critical level for potential price reversal and continuation of the bullish trend.
If the price enters this weekly FVG zone, it could signal a high-probability buying opportunity for traders anticipating a rebound. On the other hand, failure to hold this zone could lead to further downside.
Keep an eye on price action near the key levels for confirmation of potential entries. Always ensure to have clear stop-loss levels and realistic profit targets in place.
Best regards,
Happy trading!
USD/JPY: Long Setup as Regulators Move to Calm MarketsWe're seeing financial regulators schedule emergency meetings to calm markets just as USD/JPY approaches levels where it has repeatedly bounced over the past week, presenting a potential long setup for those willing to go against the prevailing grain.
Longs could be established ahead of 144.50 with a tight stop just below for protection, targeting a return to Tuesday’s low of 146.00 or minor resistance at 148.15.
Momentum indicators remain firmly bearish, favouring a downside bias. But in headline-driven markets like this, the signal may not carry its usual weight.
Good luck!
DS
LTC 1W Support Level ..Bullish Case (If Trendline Holds):
• Possible upside targets:
• Resistance at $100
• Medium-term: $160
• Long-term potential: $280+, if the crypto market enters a strong bullish phase.
⸻
Bearish Case (If Trendline Breaks):
• If it breaks below this trendline with volume, downside risk could open to:
• $36
• $22
• or even retest the lows around $13, depending on market sentiment.
⸻
Long-Term Spot Strategy:
• High-probability entry zone for long-term holders.
• Dollar-cost averaging (DCA) around this zone can be a solid plan.
• Stop-loss placement (for risk-managed traders) can be considered slightly below the trendline, e.g., $60 or $50, depending on your risk tolerance.
$$$ BTCUSD MACRO-BULLISH $$$ 1W CHART $$$BITFINEX:BTCUSD 1W Chart
There are many reasons to look at this weekly chart and see that there's absolutely no reason to be bearish on Bitcoin yet.
Holding strong r/s flip support.
Holding regression trend.
Holding parabolic trend.
Stoch RSI at the bottom.
Weekly bullish divergence.
Assuming this plays out in a way that's similar to the last local bottom, the current target is around $134k-$135k.
It would take a lot to invalidate all of these bullish indicators, but if that does somehow happen, with a CLOSE of the weekly candle that invalidated these, then It's pretty much definitely over for a loooong time.
NFA blah blah blah..
Bearish Bias Builds as SGX Futures Test Key SupportSGX iron ore finds itself teetering on key technical support, unable to muster any meaningful bid despite significant gains in other China-linked plays on Tuesday.
$95.40 is the level we’re watching, waiting for a definitive move to signal how to proceed. A downside break would open the door for a flush towards $89.30, generating a setup where shorts could be established beneath the level with a stop above for protection. Alternatively, if the price were to bounce, the setup could be flipped, targeting a move back towards former support at $99.
Momentum signals are firmly bearish with RSI (14) trending strongly lower but not yet oversold. MACD has confirmed the signal, crossing from above beneath 0 earlier this month. The backdrop therefore favours selling rips and bearish breaks.
Good luck!
DS
Is HCLTECH done?
HCLTECH has had a phenomenal run from ₹12.9 in September 2001 to ₹2,012.2 earlier this month, a growth of ~15,500% in 279 months, averaging 40% annually.
But is it all about to end? 5/35 MACD, which I love to use to validate my EW count is showing a massive divergence on the weekly charts combined with a big high-volume engulfing bar concurrently taking shape. I can also count clear 5 waves on the monthly charts.
Based on my calculations, I can see two targets on the downside: 1418 and 970 .
Do share your opinions below.
Best!
Why I think EURUSD will continue to buy this week...Hey Rich Friends,
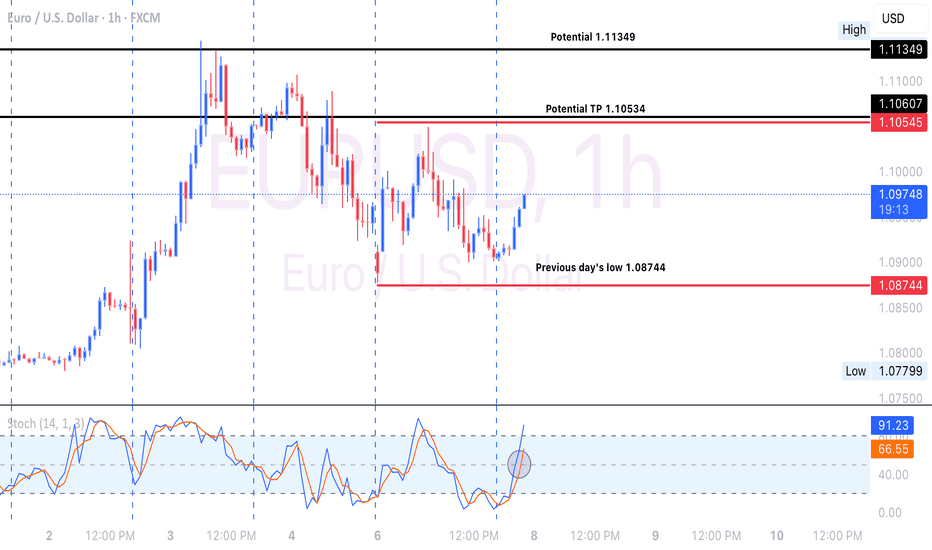
I think EURUSD will continue to buy today and maybe this week. This is only my technical analysis, so please check the news and cross-reference the indicators on your chart. Here is what I am looking at:
- The market has bounced from the previous day's low around 1.08740
- Bullish candles have picked up momentum in the last few hours
- Structure was broken on H1 and resistance was retested as support
- The STOCHASTIC is facing up, the orange line (slow) is below the blue line (fast), both have crossed above 50%.
These are all bullish confirmations for me. I will set my SL at the previous day's low and use previous highs as my TPs. Good luck if you decide to take this trade. Let me know how it goes in the comments below.
Peace and Profits,
Cha
Bitcoin Holding Strong! Key Levels & Entry PointsWeekly Chart: BTC still holding above $78,000, maintaining the overall uptrend despite short-term breakdowns.
🔍 4-Hour Chart: Temporary breakdown below trend line, but volume is low—likely a shakeout before resuming upward.
📊 Two-Pole Oscillator: Showing strength in oversold territory—potential sign of a bounce.
💰 Entry Point: Current levels are likely as close to bottom as it can get, barring external factors like politics or tariffs.
🚨 Key Level to Watch: Weekly close above $78,000 will reinforce bullish trend.
⚠️ Remember to DYOR (Do Your Own Research)!


