Skeptic | EUR/USD: Long and Short Triggers Ahead – Key LevelsWelcome back, guys! 👋 I'm Skeptic.
Today, we're diving deep into EUR/USD , breaking down the current structure and upcoming trade opportunities. 🔍
Recap & Current Structure:
As mentioned in our previous analysis , after breaking the descending trendline and pulling back, we had created a higher high, indicating a potential move toward the top of the box at 1.09453. Our long trigger at 1.08454 played out well, reaching a 2.77 % upward move! If you followed the idea, you saw the results!
Currently, after breaking resistance at 1.09418 , we saw a pullback , and it's now acting as support. We also have a new resistance at 1.10892 , along with a higher high that confirms the uptrend. I’m still looking for long triggers as long as the trend remains intact.
However, as we always say, it's crucial to be skeptical and analyze the market from both sides. So, in the coming days, I’ll keep an eye out for both long and short triggers, depending on how the price moves.
📈 Bullish Scenario (Long Setup):
Trigger: Break & close above 1.10892
Confirmation: 7 SMA below the candle during the breakout + RSI entering overbought
Invalidation: Rejection + close back below 1.09418
📉 Bearish Scenario (Short Setup):
Trigger: Rejection at 1.10213 + drop below 1.09418
Confirmation: RSI entering below 42.22
⚠️ Key Notes:
Risk Management : Avoid overleveraging—wait for confirmed breaks before entering.
Stay sharp, and I’ll see you in the next analysis!
M-oscillator

Gold Gets Technical Sell Signal Amid Stock Market DownturnGold has triggered a sell signal based on a MACD system that has historically shown a 75% success rate since the major 2011 top. Out of eight total signals, six have worked, capturing an average downward move of 21.15%. While recent signals during the bull market have delivered more modest results, they have still successfully flagged key corrections. The latest signal appears to be working as well, though uncertainty in global markets remains high, and traders should proceed with caution.
The signal itself is simple: when the difference between the MACD and its signal line rises above 20, the likelihood of a correction increases.
While many market participants expect gold to rally during equity market crashes, history shows that in particularly sharp downturns, gold can initially follow the broader market. This is often due to rising margin calls and gold’s high liquidity, making it a common source of cash. However, this time, elevated short positions might help limit the downside risks for gold.

30% Bitcoin correction to circa $72kOn the above 2 day chart price action has printed 100% gain since September. A number of reasons now exist for a bearish outlook in the near term. They include:
1) Price action failed support.
2) RSI and MFI failed support.
3) Strong bearish divergence with price action. 10 oscillators price negative divergence with price action at this time.
4) The $72k forecast is the 50% Fibonacci level.
5) What will happen to overbought alt tokens? Nothing good.
Is it possible price action continues to print higher highs like most Youtube shills are calling for? Sure.
Is it probable? No.
Ww

Long SLVThis is a long term trade which may take longer time to develop and contingent on positive price action through key resistance levels.
First level to watch is the 30 handle, which is currently being tested. Break above 30 should take us close to the most recent high in Oct-2024, just below the 35 handle.
Assuming price action advances past the 35 handle, we'd likely see a quick move to new highs around the 52 handle.
Additional rate cuts in 2025, as well as increased deficit spending would likely be the fundamental monetary catalyst to drive prices higher.

Hang Seng Bull Market ImplodesHong Kong’s Hang Seng is imploding with the price cascading lower after breaking support at 22,570 earlier today. The subsequent unwind saw 21,728 and 21,377 melt like a hot knife through butter before the price eventually bounced at 20,535 — another minor level that acted as both support and resistance earlier this year. That makes it an initial level of interest for those contemplating setups involving Hang Seng futures.
A clean break of 20,535 would put a retest of minor levels such as 19,718 and 19,430 on the table. The 200-day moving average is also found at 19,891, although one glance at how price has interacted with it previously suggests it may be entirely ignored in this environment. Beyond that, the uptrend dating back to the early 2024 low is another level to watch, although it hasn’t been tested enough to declare it meaningful downside support. It’s located around 18,550 today, just beneath the January 2025 swing low of 18,694.
While they provided no support earlier today, 21,377 and 21,728 may still be of interest if bears choose to set up shop above either. Watch the price interaction at these levels if the Hang Seng gets back there.
Momentum signals remain firmly with the bears, with MACD and RSI (14) both negative and trending strongly lower. While RSI is now oversold, it was also extremely overbought earlier this year — and that didn’t stop further gains at the time. The same could easily apply on the downside. The overall momentum signal favours selling rips and downside breaks near term.
Good luck!
DS

Nikkei 225 Bounce Zone Holds AgainTraders should pay close attention to Nikkei 225 futures if the price returns towards 30,400. We’ve now seen decent bounces from around that level five times, including earlier today upon the resumption of trade after the weekend.
While momentum signals are firmly bearish, with RSI (14) and MACD both trending lower, the former now sits at its most oversold level since the pandemic plunge in early 2020. That means the market may be vulnerable to even a minor shift in the prevailing bearish sentiment. For now, the preference remains to sell rallies over buying dips.
A clean break of 30,400 would open the door for a run towards 28,400 or 25,600 — the latter a key technical level given how often it thwarted bearish moves in 2022. On the topside, resistance may be encountered around 33,300, marking where the price rout stalled last Friday. A break of that would put 35,120 on the radar.
Good luck!
DS

RSI 101: Scalping Strategy with RSI DivergenceFX:XAUUSD
I'm an intraday trader, so I use the H1 timeframe to identify the main trend and the M5 timeframe for entry confirmation.
How to Determine the Trend
To determine the trend on a specific timeframe, I rely on one or more of the following factors:
1. Market Structure
We can determine the trend by analyzing price structure:
Uptrend: Identified when the market consistently forms higher highs and higher lows. This means price reaches new highs in successive cycles.
Downtrend: Identified when the market consistently forms lower highs and lower lows. Price gradually declines over time.
2. Moving Average
I typically use the EMA200 as the moving average to determine the trend. If price stays above the EMA200 and the EMA200 is sloping upwards, it's considered an uptrend. Conversely, if price is below the EMA200 and it’s sloping downwards, it signals a downtrend.
3. RSI
I'm almost use RSI in my trading system. RSI can also indicate the phase of the market:
If RSI in the 40–80 range, it's considered an uptrend.
If RSI in 20 -60 range, it's considered a downtrend.
In addition, the WMA45 of the RSI gives us additional trend confirmation:
Uptrend: WMA45 slopes upward or remains above the 50 level.
Downtrend: WMA45 slopes downward or stays below the 50 level.
Trading Strategy
With this RSI divergence trading strategy, we first identify the trend on the H1 timeframe:
Here, we can see that the H1 timeframe shows clear signs of a new uptrend:
Price is above the EMA200.
RSI is above 50.
WMA45 of RSI is sloping upward.
To confirm entries, move to the M5 timeframe and look for bullish RSI divergence, which aligns with the higher timeframe (H1) trend.
RSI Divergence, in case you're unfamiliar, happens when:
Price forms a higher high while RSI forms a lower high, or
Price forms a lower low while RSI forms a higher low.
RSI divergence is more reliable when the higher timeframe trend remains intact (as per the methods above), indicating that it’s only a pullback in the bigger trend, and we’re expecting the smaller timeframe to reverse back in line with the main trend.
Stop-loss:
Set your stop-loss 20–30 pips beyond the M5 swing high/low.
Or if H1 ends its uptrend and reverses.
Take-profit:
At a minimum 1R (risk:reward).
Or when M5 ends its trend.
You can take partial profits to optimize your gains:
Take partial profit at 1R.
Another part when M5 ends its trend.
The final part when H1 ends its trend.
My trading system is entirely based on RSI, feel free to follow me for technical analysis and discussions using RSI.

Class A/B RSI Bearish Divergence on SPY Futures?Really posting here to see if anyone would validate this for me but I was looking on the chart and this idea came about. On the weekly chart for ES1!, there seems to be class A or B Bearish Divergence developing on the Weekly timeframe.
Listen, of course we all know SPY trends upwards over time but is this an indicator of a larger sell the market needs to go higher every once in a blue moon? This is guarenteed a macro trend and I probably will have to wait a year for this analysis to play out but hey, at least we're here. (***ponders on how I charted Gamestop at $10 but never traded because of lack of knowledge***) Anyways, this is something I will of course monitor but let me highlight instances in history this has happened. Please feel free to give your input on this analysis!
Jan 1998 thru Apr 2001 (News Driver: Dot-Com Bubble)
Price makes higher highs from Jan 98' thru Mar 00'
From Mar 98' thru Mar 00', the 3 peaks formed on the RSI leading to price establishing a lower high (SMT) on Sep 00'. Fails to make new all-time high
From Sep 00' to Apr 01' price moves down as much as 30% over the next 224d
Jan 2013 thru Feb 2016
Price makes higher highs from Jan 13' thru May 15'
From May 13' thru Jun 14', the 3 peaks formed on the RSI leading to price establishing a lower high (SMT) Jul 15' and a following lower high on Nov 15'
From Jul 15' to Aug 15' (42d) (News Driver: Lagging China Market) price moves down as much as 14% and as much as 14% on the Nov '15 lower high to Jan 16' (78d) (News Driver: Oil Prices)
Current: Jan 24' thru Nov 24'
Price has been making higher highs all year
From Mar 24' thru , the RSI has been making lower highs while price is making higher highs
We are now at a point where price is pushing to go higher but what I would want to see based off of historical data is for price to consolidate or some type of Bearish Turtle Soup forming. If this happens and the RSI returns to Fair Value, we could be in for a sizeable sell of for at least a couple of weeks in the near future.
I will come back to this in the next few months. Happy Trading!

ETH Is Oversold Like Never Before !Hello Traders 🐺
In the recent week, we saw a massive long position wipeout, especially in the stock market.
However, despite all the rumors, BTC held itself at these levels and is still inside a falling wedge pattern.
If you don't know what I’m talking about, you can check my last idea about it.
But ETH!
In my opinion, this is a huge discounted price for ETH.
You know why?
1_ Monthly RSI is currently at 25, which means we’re in an extremely oversold situation, and this usually means bulls are about to come back.
Yes — we have all the signs of a reversal from here:
(A): BTC.D RSI is at an all-time high and forming a bearish divergence, meanwhile:
(B): ETH/BTC is extremely oversold right now.
(C): BTC itself has formed a falling wedge pattern right above the weekly Cup & Handle neckline support!
Guess what?
If you zoom in a little bit on the daily chart, you can see there’s a pattern to break, and price is currently too close to the edge of it —
which means time is ticking for ETH, and we are about to see an explosive move.
Probably to the upside, because of all the signs we’ve talked about above.
I hope you enjoyed this idea — and as always, don’t forget our goal:
🐺 Discipline is rarely enjoyable, But almost always profitable 🐺
🐺 KIU_COIN 🐺

TON USDT Buy Setup 1. Price Action and Trend Analysis
• Current Price and Movement: The current price of TONUSDT is 3.2440, down by 2.72% (as shown in the header). The chart shows a recent decline from a high of around 3.58777 (marked on the chart).
• Trend: The price appears to be in a downtrend after hitting a peak. However, the chart also shows a potential ascending triangle pattern (a bullish continuation pattern) with higher lows forming around the 2.35877 and 2.65256 levels and a resistance zone between 3.1010 and 3.24439 (highlighted in purple).
• Key Levels:
• Support: Around 2.35877 to 2.65256 (previous lows and the lower trendline of the ascending triangle).
• Resistance: The purple zone between 3.1010 and 3.24439, which the price is currently testing.
• Recent High: 3.58777 (a potential target if the price breaks above resistance).
• Recent Low: 2.35877 (a critical support level if the price continues to decline).
2. Volume Analysis
• The chart includes volume bars at the bottom, but they are not explicitly labeled. Generally, in a pattern like an ascending triangle, you’d want to see increasing volume on upward moves (indicating buying pressure) and decreasing volume on pullbacks (indicating lack of selling pressure). From the chart, volume appears relatively stable, with no significant spikes, suggesting a lack of strong momentum in either direction at the moment.
3. Indicators
• Relative Strength Index (RSI): The RSI is shown in the lower panel, currently at 41.01.
• RSI below 50 indicates bearish momentum, but it’s not yet in oversold territory (below 30). This suggests the price could still decline further before a potential reversal.
• The RSI has been trending downward recently, aligning with the price decline from the 3.58777 high.
4. Pattern Analysis: Ascending Triangle
• The chart shows an ascending triangle pattern, which is typically a bullish continuation pattern:
• Higher Lows: The price has formed higher lows at 2.35877, 2.65256, and 2.80841, indicating buyers stepping in at higher levels.
• Flat Resistance: The price has repeatedly tested the resistance zone around 3.1010 to 3.24439 but failed to break above it decisively.
• Implication: If the price breaks above the 3.24439 resistance with strong volume, it could target the recent high of 3.58777 or higher. The potential target for an ascending triangle breakout is often calculated by measuring the height of the triangle (from the base to the top) and projecting it upward from the breakout point:
• Height of triangle: Approximately 3.24439 - 2.35877 = 0.88562.
• Potential target if breakout occurs: 3.24439 + 0.88562 ≈ 4.13001.
5. Liquidity Levels
• The chart marks liquidity levels with numbers in parentheses, such as (3.58777), (2.80841), etc. These likely represent stop-loss or take-profit levels where liquidity might be clustered:
• Above the current price (e.g., 3.58777), there may be sell-stop orders or take-profit levels from short positions.
• Below the current price (e.g., 2.35877), there may be buy-stop orders or stop-loss levels from long positions.
• The price often moves toward these liquidity zones to “hunt” stops before reversing, so a drop below 3.1010 could target the 2.80841 or 2.65256 levels.

$VIX Hits 45! $BTC Historically Pumps Soon AfterThe TVC:VIX has only hit above 45 on 5 occasions in the history of CRYPTOCAP:BTC
Each time it did, BTC pumped at least 20%

What Is Momentum – And Why It’s Not Just a Trend IndicatorMost traders follow price — candles, trendlines, support/resistance. But there’s another layer that often tells the story before the price moves: momentum.
⸻
🔍 In this post, you’ll learn:
• What momentum really measures
• Why it’s not the same as price direction
• How momentum can signal a shift before the chart confirms it
• Why combining momentum with structure improves timing
⸻
📈 Momentum ≠ Direction
Price can be rising while momentum is fading. That’s often a clue of an upcoming slowdown or reversal — long before the price turns. Similarly, price can be flat, while momentum builds in one direction. That’s tension… and tension leads to moves.
⸻
🔥 Why Momentum Matters:
• It reveals intensity, not just direction
• It can act as a leading indicator — not lagging
• Momentum divergences often hint at hidden accumulation or distribution
• Tracking it helps you avoid late entries or false breakouts
⸻
🔧 Takeaway for traders:
If you’re only watching price, you’re only seeing half the picture.
Momentum shows what’s driving the move, and when that drive starts weakening.
⸻
💬 What’s your favorite momentum indicator? RSI, %R, CCI, or something else?

Altcoins' Market Cap is About to Reclaim $1 Trillion..!Hello Traders 🐺
In my last idea about Altcoins' total market cap, I talked about the midterm price targets. Now, in this idea, I want to focus on the short-term volatility. As you can see in the chart, the price is already in a falling wedge pattern, and the target of the falling wedge is the top of the wedge. This means we are about to see a nice bounce in Altcoins, which could break BTC.D's upward movement and lead to a bigger correction.
In my opinion, in this case, we can also treat this pattern as a bull flag, and the target will vary accordingly. If you want to know more about the price target for TOTAL3, you can check my previous idea, where I also mentioned my final price target for this Altcoin Season. I hope you enjoy this idea! Don’t forget to like and follow! 🚀🔥
🐺 KIU_COIN 🐺

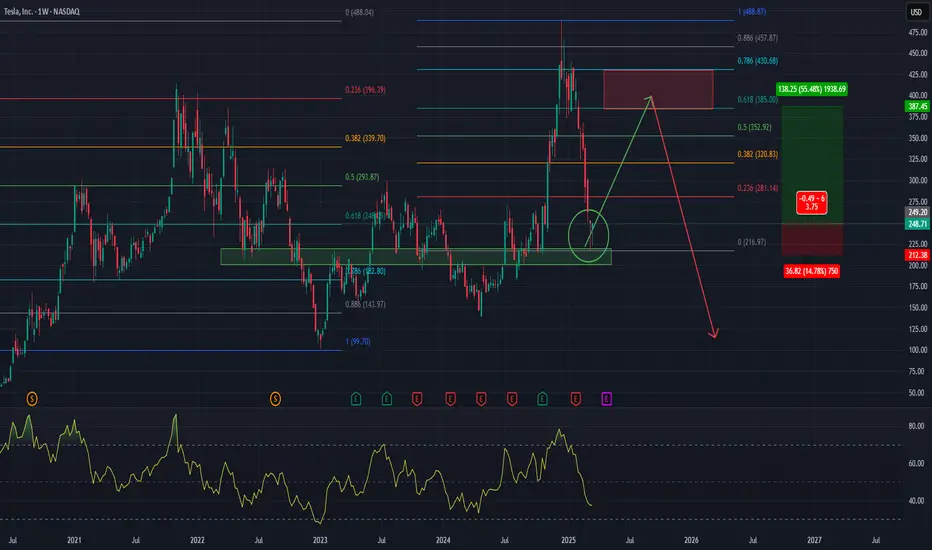
Tesla to bounce from hereNASDAQ:TSLA
Tesla has reach and bonce from a key support level, as seen on the chart, in the Golden Pocket, between the 61.8% and the 78.6% Fibonacci Retracement, and it is shown two weekly hammer candlestick bar near each other, which is bullish. Odds that it has already found a mid-term bottom is high.
Now I expect a multi-week bounce from here, probably to the next Golden Pocket at the top, which is between $385 to $430 USD.
And yes, Elon Musk upset his customer base, and the stock is very expensive compared to other car manufacturers, and will probably see little to no growth in sales this year, or even a decline, insiders has sold big amounts of shares and it is all looking bad. And yes, we have probably already seen the top in Tesla in December last year for a long time.
However, stocks don’t generally go down in a straight line, the stock, as well as the stock market in general is oversold and do for a bounce, maybe a big bounce.
After the bounce, I will be looking for shorts, but now, I’m looking for longs.
Good luck to you
Skeptic | EUR/USD at a Crossroads: Breakout or Reversal?Welcome back, guys! 👋 I'm Skeptic.
Today, we're diving deep into EUR/USD , analyzing key levels and potential triggers.
🔍Recap & Current Structure:
As mentioned in our previous analysis , after the previous uptrend, EUR/USD entered a consolidation phase. Our short trigger at 1.07124 played out well, reaching an R/R of 2—if you followed the idea, you saw the results!
Now, we’ve formed a new structure , which is more visible on the 1H timeframe. After breaking the descending trendline and pulling back , we've now created a higher high , indicating a potential move toward the top of the box at 1.09453 .
With DXY weakening, the expectation leans towards an uptrend continuation, but we remain flexible—if our short trigger activates, we'll take it as well because we approach the market with a two-sided, skeptical view rather than a fixed bias.
📈 Bullish Scenario (Long Setup):
Trigger: Break & close above 1.08454
Confirmation: 7 SMA below the candle during the breakout + RSI entering overbought
]Invalidation: Rejection + close back below 1.07666
📉 Bearish Scenario (Short Setup):
Trigger: Rejection at 1.08278 + drop below 1.07666
Confirmation: RSI entering oversold
⚠️ Key Notes:
Fundamentals: This Friday is NFP day—a crucial event for the markets.
Given the recent uptrend in EUR/USD, a pullback is likely, so stay prepared for both triggers.
Risk Management: Avoid overleveraging—wait for confirmed breaks before entering.
Stay sharp, and I’ll see you in the next analysis!

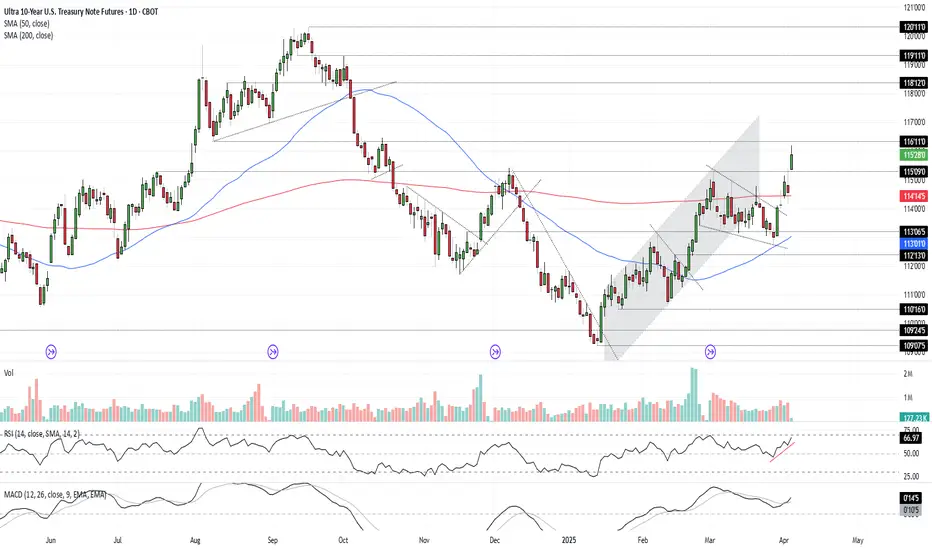
Bonds Don’t Lie: The Signal is ClearU.S. 10-year Treasuries are a crucial cog in the global financial machine, serving as a benchmark borrowing rate, a tool for asset valuation, and a gauge of the longer-term outlook for U.S. economic growth and inflation.
As such, I keep a close eye on 10-year note futures, as they can offer clues on directional risks for bond prices and yields. The price action over the past few days has sent a clear and obvious signal as to where the risks lie: prices higher, yields lower.
Futures had been grinding lower within a falling wedge for several weeks but broke higher last Friday on decent volumes following soft U.S. household spending data. It has since extended bullish the move, reclaiming the 200-day moving average before surging above key resistance at 115’09’0 after Trump’s reciprocal tariff announcement on Wednesday.
RSI (14) is trending higher but isn’t yet overbought, while MACD has crossed the signal line above 0, confirming the bullish momentum signal. That favours further upside, putting resistance at 116’11’0 and 118’12’0 on the immediate radar. For those who prefer it expressed in yield terms, that’s around 4% and 3.8% respectively.
Good luck!
DS
GOLD - Day Trading with RSI 04/03/2025FX:XAUUSD
Daily Timeframe (D1): Still in a strong uptrend, with RSI and both moving averages are pointing upwards. The WMA45 is above 60.
4-Hour Timeframe (H4): RSI is positioned between the resistance created by WMA45 (current price around 3152) and the RSI 60 support level (current price around 3121).
1-Hour Timeframe (H1): The WMA45 is trending upward, supporting the bullish trend.
Trading Plan: BUY
Entry Zone:
When the RSI on the M15 timeframe is supported at the 50 or 60 levels.
Entry Confirmation:
When M5 completes a wave, or a divergence appears.
Or even when M1 shows divergence.
Stop Loss:
20–30 pips below the M5 low.
Take Profit:
100 pips or R:R ≥ 1:1.
Or when M5 completes its own uptrend.
But be careful when RSI on H4 reaches its own WMA45.
You can check out the indicators I use here: tradingview.com/u/dangtunglam14/

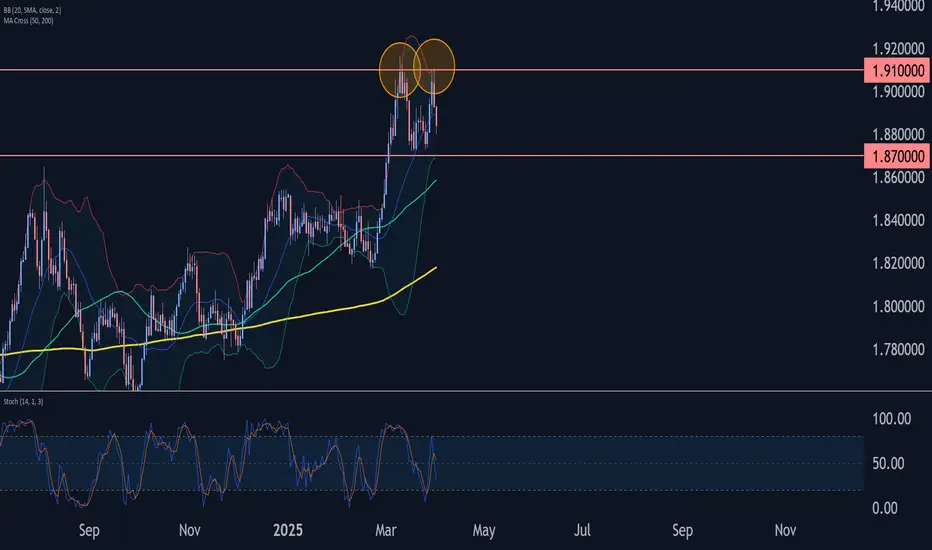
EURNZD Wave Analysis – 2 April 2025
- EURNZD reversed from resistance area
- Likely to fall to support level 1.8700
EURNZD currency pair recently reversed down from the resistance area located between the resistance level 1.9100 (which stopped the earlier sharp upward impulse wave I at the start of March) and the upper daily Bollinger Band.
The downward reversal from this resistance area stopped the earlier short-term impulse wave iii of the upward impulse wave 3 from the end of February.
Given the strength of the resistance level 1.9100, EURNZD currency pair can be expected to fall to the next support level 1.8700.
ETH Bullish Continuation on 1 & 4 hr!BINANCE:ETHUSDT has started a bullish trend on 1 and 4 hr timeframes. I am expecting continuation of the bullish trend with a market entry and stop loss below the 4 hr higher low!

GOLD - Day Trading with RSI 04/02/2025
Weekly and Daily Timeframes (W & D):
GOLD is still in an uptrend, as the RSI's WMA45 is still hovering near the 70 level, and RSI remains above both of its moving averages.
H4 Timeframe:
This timeframe is currently showing a correction. However, it's not yet considered a downtrend because the WMA45 is still in the high region, close to the 70 level. But, RSI has dropped below the WMA45.
At present, the RSI on H4 is facing dynamic resistance from the WMA45 above and has support around the 4x level (43-48). The corresponding temporary price levels are approximately 3128 (resistance) and 3088 (support).
This end-of-uptrend correction on H4 could lead to high price volatility. GOLD may move within a 300–400 pip range (between the resistance from WMA45 and the RSI support around the 4x zone).
H1 Timeframe:
Currently in a downtrend, as RSI is moving below both of its MAs, and the WMA45 has a noticeable downward slope.
H1 also has RSI support at the 30 level (temporary price ~3086) and resistance at WMA45 above (temporary price ~3130).
Since we’re focusing on intraday trading, priority is given to the H1 trend.
Figure 1
Trading Plan: SELL
Entry Zone:
When RSI on M15 approaches upper resistance: levels 50–55 or 65–70.
Confirm Entry:
Conservative/Safe approach: when M5 ends its uptrend and reverses (see example in Figure 1 – M5 ends uptrend when RSI crosses below both MAs).
Or when bearish divergence appears on M5.
Or even earlier, when there’s divergence on M1 and M5's WMA45 flattens out.
Stoploss:
20–30 pips above M5’s recent peak.
Or if RSI on M5/M15 breaks through its previous high.
Take Profit:
100 pips or R:R >= 1:1.
Or when M5’s downtrend ends (when RSI crosses above both MAs).
You can check out the indicators I use here: www.tradingview.com

Russell 2000: Squeeze Potential BuildsWith uncertainty surrounding U.S. trade policy about to be resolved and price signals turning bullish, the ingredients for a squeeze in Russell 2000 futures are now in place.
Unlike other stock indices with far larger constituents, U.S. small caps have lagged this week’s rebound—potentially due to recession concerns, which wouldn’t help unprofitable cyclical firms tied to the broader economy.
However, while fundamentals point to downside risks, recent price signals have been more constructive. Monday’s hammer candle formed after a reversal from known support. While Tuesday’s doji signaled indecision, it still closed slightly higher, with strong volumes going through.
While signals like RSI (14) and MACD remain in negative territory, bearish momentum is starting to ebb, suggesting we may be in the early stages of a turn.
Those considering bullish positions could look to establish entries above 1994.8 with a stop beneath for protection. Rallies over the past two sessions have fizzled around 2040, making that an initial focal point. If sellers there are overrun, it could encourage others to join the move, looking for a retest of horizontal resistance at 2132.5.
Good luck!
DS

GBPAUD Wave Analysis – 1 April 2025
- GBPAUD reversed from long-term resistance level 2.0820
- Likely to fall to support level 2.030
GBPAUD currency pair recently reversed from the resistance area located between the long-term resistance level 2.0820 (former multiyear high from 2020), resistance trendline of the weekly up channel from 2024 and the upper weekly Bollinger Band.
The downward reversal from this resistance area stopped the earlier short-term impulse wave 3 of the weekly upward impulse sequence (3) from the start of 2024.
Given the strength of the resistance level 2.0820 and the overbought weekly Stochastic, GBPAUD currency pair can be expected to fall to the next support level 2.030.

NAS - Instant Buy on 1 hrFX:NAS100 looks to be in a bullish trend on 1 hr timeframe after forming bullish divergence and reversing the bearish trend. Buying at current prices with SL set below the 1/4hr higher lows!
