Silver’s Bullish Breakout Raises Stakes for $34.24 RetestSilver delivered a monster bullish candle on Tuesday, completing a morning star pattern while smashing through wedge resistance that had capped gains earlier in the week. With RSI (14) setting higher lows and MACD on the verge of a bullish crossover, price and momentum signals suggest a growing risk of a retest of the March 18 high at $34.24.
Silver has a habit of gravitating toward round figures, making any pullback toward $33.50 a potential buying opportunity where longs could be established above with a stop beneath for protection. Resistance may emerge near $34, though $34.24 appears a more meaningful initial target. A break above that could encourage bulls to chase a move toward the October high of $34.87.
If silver reverses back beneath former wedge resistance and holds there, the bullish bias would be invalidated.
Good luck!
DS
M-oscillator

FART/USDTSEED_WANDERIN_JIMZIP900:FART Cup and Handle on 1D chart! 🔥
✅ The cup is nicely rounded - a sign of bullish accumulation.
✅ Neckline around 0.5561-0.6119 (V-WVWAP) - price is hitting resistance here.
✅ Volume is increasing during the breakout attempt - which is a positive signal.
✅ Possible "eye" - price may correct back to support before further growth.
Targets:
🔹 Cup height measurement: Bottom around 0.3194, neckline 0.5561, gap ~0.2367.
🔹 Target level: 0.5561 + 0.2367 = ~0.7928 (possible bull target on patterning confirmation).
🔹 Fib levels may help - I see first resistance around 0.6176.
How to play it?
📌 Ideal entry: after a pullback to neckline (retest) or during a confirmed breakout with volume.
📌 Stop-loss: Below the last low of the neckline or below the neckline if it becomes support.
📌 Confirmation.
Overall, the pattern looks very bullish, but the reaction to 0.5561-0.6119 will be important. If it fails there, the ears may go lower.

$SPY March 25, 20252nd Post.
This chart shows oscillator divergence in LL and 100% extension around 580.
Hence this also supports the previous post numbers of 579-580 at the moment for the day.

HSI testing resistance levels —will it break through or bounced?25/03/2025
🚨🚨🚨
HSI resistance is being tested for short-term!
Investors tend to take profit towards quarter end.
HSI:HSI
MACD - Deadcross formed 20/3/2025.Resistance 24750-24600 level.
4H chart: PEPPERSTONE:HK50
at point of writing ✍️: the Index uptrend mode is paused and moving out of bound from the uptrend channel.
MACD : moving below zero line - Bearish mode.
KDJ: below 30 level in the bearish zone. Hopefully the divergence cycle completing soon for a strong reversal.
BB - ranging at lower BB; mid-line:23986 (this is your 🗝️ level for your long/short TP/SL level)
Set your TP/SL and let the markets works.
For this week trade plan: Most likely short the index for days to few weeks until get confirmation of trendline back to uptrend channel. Buy into support Sell at resistance. Set your TP/SL.
🚨 as of ✍️ :
Support/Resistance Levels :
22979
23030
23242(23374)
23526
23997
24385
24586
24648
24945
🗝️🗝️🗝️Level: 23526-23620
HSI continues its Bullish mode.
W Chart:-
17Mar2025 -
24Mar2025 -
📰 another -ve news, but this might be distraction. 🚨
www.tradingview.com
Shares in Hong Kong slumped 487 points or 2.0% to 23,417 on Tuesday morning, reversing gains from the prior session amid concerns over U.S. recession risks and China’s deflation threat.
www.tradingview.com
** Hong Kong's benchmark Hang Seng Index declined 2.2%, and the Hang Seng Tech Index
HSTECH lost 3.5%.
For current markets condition, the CHN & HKG can be volatile with the continuing noise from tariff.
🎯 Reminder: For long term (6-18 months) continue to accumulate China & HKG for the potential upside for the year! All retracement is a good entry point.
🔎 DYODD and don't listen to anyone. Invest in yourself, do some study and learn along the way while you trying to verify or finding the answer if to start invest in CHN/HKG markets. If you don't know how or where, you may ask Deepseek/Chatgpt for most reputable Trading courses nearest to you.
Let's follow our own strategy and zen with 📙 and 🍵 for profits.
** Please Boost 🚀/LIKE 👍, FOLLOW ✅, SHARE 🙌 and COMMENT ✍ if you enjoy this idea! Share your trading journey to encourage the trading buddies.

Fil will increase againSince we have divergence at the support zone, it looks like the price might bounce back a little

Bitcoin on Breakdown Alert as Rising Wedge FormsBitcoin traders should be alert to the risk of renewed downside with the price forming a rising wedge pattern that often signals weakness ahead. While it's holding for now, the narrowing range suggests price momentum is fading, increasing the risk of a breakdown.
If the signal proves accurate, traders could establish shorts beneath wedge support with a stop above for protection. The obvious target would be the key 200DMA where the price bounced strongly from on March 11.
RSI (14) and MACD are both grinding higher, reinforcing the need to see a bearish price signal first before considering the trade.
Good luck!
DS

TTD longNASDAQ:TTD long
(The Trade Desk, Inc. (TTD) is a technology company that provides a demand-side platform for digital advertising. Here's a quick overview:
1. Business: TTD specializes in programmatic advertising, using AI and data analytics to automate and optimize ad placements in real-time across various digital platforms.
2. Financial Performance:
- 2024 Revenue: $2.4 billion (26% year-over-year growth)
- Q4 2024 Revenue: $741 million (22% year-over-year growth)
3. Stock Performance:
- Current Price: $59.34 (as of March 24, 2025)
- Year-to-date performance: Down approximately 36%
4. Growth Drivers:
- Connected TV (CTV) advertising
- Shift to programmatic advertising
- Privacy-friendly advertising model
5. Challenges:
- Recent earnings miss and lower-than-expected Q1 2025 guidance
- Increased competition from major tech companies
- Economic slowdowns potentially impacting ad spending
6. Market Position:
- Leader in the demand-side platform (DSP) market
- Strong presence in CTV advertising
- No reliance on first-party data, unlike competitors like Google and Meta
Despite recent challenges, analysts remain generally bullish on TTD's long-term prospects in the growing digital advertising industry)

Cosmos Atom BullishI am not a financial advisor. This is not meant to be and does not constitute financial, investment, trading, or any other types of advice or recommendation.

BTCUSD Golden Ratio Support + VWMA Buy Signal + SMC Order Block1️⃣ Fibonacci Golden Ratio (61.8%) Rejection:
Price is reacting at the golden ratio level.
Strong resistance zone → Possible reversal signal.
2️⃣ Volume-Weighted Moving Average (VWMA) → Light Sell Condition:
Price is struggling to hold above VWMA.
Momentum weakening, confirming bearish pressure.
3️⃣ Smart Money Concept (SMC) Order Block Above Price:
Liquidity grab above order block → Smart Money may push price lower.
Potential short setup with tight invalidation.
📉 Possible Trade Setup:
🔹 Short Entry: Near 61.8% Fib + VWMA confluence.
🔹 Stop-Loss: Above 78.6% Fib level or recent high.
🔹 Target: 50% or 23.6% Fib retracement levels for TP1 & TP2.
🔹 Extra Confirmation: Watch for bearish candle patterns (e.g., engulfing, pin bars).

ADAUSDT Flashing Bearish Signals – Is a Drop Incoming?Yello, Paradisers! Are we about to see a strong rejection on ADAUSDT? Let’s break it down.
💎ADAUSDT has filled the Fair Value Gap (FVG) and formed a double top with bearish divergence. Notably, the right top is slightly above the left, signaling a liquidity grab. Following this, we’ve seen a Change of Character (CHoCH) to the bearish side, increasing the probability of a downside move.
💎If ADAUSDT retraces from this level, it will strengthen a high-probability bearish setup from the 1-hour FVG, where the 0.5 Fibonacci level aligns—offering an attractive risk-to-reward (RR) opportunity for shorts.
💎However, if price breaks and closes above the 0.786 Fibonacci level, our bearish outlook will be invalidated. In that case, it would be best to step back and wait for stronger confirmation before taking action.
🎖 Patience and discipline win the game, Paradisers! Don’t chase—wait for the best setups and protect your capital like a pro.
MyCryptoParadise
iFeel the success🌴

‘Cagey’ Rebound on BTC/USD?Since BTC/USD (Bitcoin versus the US dollar) rebounded from the 200-day simple moving average (SMA) earlier this month at US$78,111, speculative bullish interest has been uninspiring.
Further Downside
As far as I can see, the major crypto pairing demonstrates scope to continue exploring south until it reaches support from US$68,926 on the monthly timeframe (I also noted this in previous analysis), which (somewhat) helps explain why technical demand from the 200-day SMA could be lacking.
Another technical observation supporting the lacklustre bullish showing is the Relative Strength Index (RSI), recently exiting overbought territory and fast approaching the neckline of a double-top pattern on the monthly chart, extended from the low of 60.44. A break beyond this line highlights the RSI’s 50.00 centreline threshold as a possible downside target. Adding to this, the RSI on the daily chart may have rebounded from oversold territory (forming a possible double-bottom), but remains south of 50.00 and is shaking hands with resistance around 45.46.
Monthly/Daily Support Area Warrants Attention
While I am not saying that a move to the upside won’t be seen, the path of least resistance appears to be to the downside, at least targeting space below the 200-day SMA at daily support from US$73,575. So, for me, the playbook here will be watching for possible fading opportunities at the underside of the daily range between US$108,396 and US$91,591 (which happens to converge closely with the 50-day SMA at US$93,608 and trendline resistance, extended from the all-time high of US$109.580). Alternatively, we could see price sell-off at current levels and aim for the noted daily support. It is this level, coupled with monthly support mentioned above at US$68,926, that I expect to see bulls attempt to make a show.
Written by FP Markets Market Analyst Aaron Hill

2/21/25 - DNA: new SELL mechanical trading signal.2/21/25 - DNA: new SELL signal chosen by a rules based, mechanical trading system.
DNA - SELL SHORT
Stop Loss @ 16.36
Entry SELL SHORT @ 10.82
Target Profit @ 6.98
Analysis:
Higher timeframe: Prices have stayed below the upper channel line of the ATR (Average True Range) Keltner Channel and reversed.
Higher timeframe: Victor Sperandeo's (Trader Vic) classic 1-2-3 SELL pattern...where the current highest top breakout price is less than the preceding top price.
Higher timeframe: Price peaked above the ATR (Average True Range) breakout high and then reversed.
Not to far from hitting target over 200With our alert, week 1 has been consistent. Continue to work towards a target of 205, with indicators and volume-based in this zone, which has every potential of breaking through.

Tesla Wave Analysis – 21 March 2025
- Tesla reversed from support level 220.00
- Likely to rise to resistance level 280.00
Tesla recently reversed up from the support zone surrounding the multi-month support level 220.00 (which has been reversing the price from September).
The upward reversal from the support level 220.00 stopped the previous impulse wave 5 of the intermediate impulse wave (C) from January.
Given the oversold daily Stochastic, Tesla can be expected to rise to the next resistance level 280.00.

Google Wave Analysis – 21 March 2025
- Google reversed from key support level 160.00
- Likely to rise to resistance level 167.00
Google recently reversed up from the key support level 160.00 (which has been reversing the price from October) intersecting with the lower daily Bollinger Band.
The upward reversal from the support level 160.00 created the daily Japanese candlesticks reversal pattern Hammer – which stopped the previous impulse wave C.
Given the strength of the support level 160.00 and the bullish divergence on the daily Stochastic, Google can be expected to rise to the next resistance level 167.00.

Silver Wave Analysis – 21 March 2025
- Silver reversed from resistance level 34.00
- Likely to fall to support level 32.00
Silver recently reversed down from the key resistance level 34.00 (which stopped the previous intermediate impose wave (3) at the end of October) standing close to the upper weekly Bollinger Band.
The downward reversal from the resistance level 34.00 stopped the previous impulse wave 3 of the higher order impulse wave (5) from the end of 2024.
Given the strength of the resistance level 34.00 and the overbought weekly Stochastic, USDCHF can be expected to fall to the next support level 32.00.

RealReal, Inc.On the above bi-weekly chart price action has corrected over 90% since the sell signal (not shown) at $30. Now is an excellent long moment. Why?
1) A strong buy signal (not shown).
2) Price action and RSI resistance breakouts.
3) Bullish divergence. Multiple oscillators are printing positive divergence with price action.
Is it possible price action falls further? Sure.
Is it probable? No.
Ww
Type: investment
Risk: <=6% of portfolio
Timeframe: Don’t know.
Return: Don’t know
Stop loss: <= 90 cents

EURNZD BUYThis symbol has a good buying opportunity based on price action conditions, but we don’t have a precise confirmation from the MACD indicator. However, overall, we can expect the scenario shown in the image.
#Forex #Trading #PriceAction #NZDUSD #ForexTrading #ForexSignals #ForexAnalysis #TechnicalAnalysis #MACD #Trader #ForexMarket #TradingView #CurrencyTrading #FXTrader #ChartAnalysis

AUDNZD Wave Analysis – 20 March 2025
- AUDNZD reversed from key support level 1.0930
- Likely to rise to resistance level 1.0985
AUDNZD currency pair recently reversed up from the support zone between the key support level 1.0930 (former multi-month from December), support trendline of the daily down channel from February and the lower daily Bollinger Band.
The upward reversal from this support zone will likely form the daily Japanese candlesticks reversal pattern Morning Star – if the pair closes today near the current level.
Given the strength of the support level 1.0930 and the oversold daily Stochastic, AUDNZD currency pair can be expected to rise to the next resistance level 1.0985.

EURCAD Wave Analysis – 20 March 2025
- EURCAD reversed from the resistance zone
- Likely to fall to support level 1.5400
EURCAD currency pair recently reversed sharply from the resistance zone between the key resistance level 1.5800 (former major resistance from 2020) and the resistance trendline of the weekly up channel from 2022.
The downward reversal from this resistance zone will likely form the daily Japanese candlesticks reversal pattern Evening Star.
Given the strength of the resistance level 1.5800, EURCAD currency pair can be expected to fall to the next support level 1.5400.

ETH will retest uptend line soonPossible ETH long setup—yeah, the ETH chart looks brutal after last month’s chaos, but let’s take a sober look at the structure and spot some long opportunities. Here’s the deal: ETH broke its uptrend from summer 2022, smashed through the 200-day EMA, and liquidated most longs—even those with low leverage. End of the bull cycle or just a breather? We’ll see, but I’m leaning toward the latter. Still, in this macro mess, risky assets are struggling—new highs are unlikely until a fresh liquidity wave hits or the Fed keeps easing with rate cuts.
Right now, selling seems to be fading. On the 3D chart, we’ve got a Doji forming in oversold territory (same level as the June 2022 bottom), MACD shows selling momentum dropping, and on lower timeframes, a descending wedge is shaping up. All signs point to a correction after the last 2 months’ drop. Worth noting: we broke that key diagonal level but never retested the trendline. I expect us to hold above 2150$ soon. After some consolidation, price could retest the uptrend line—either to reclaim it or confirm it as resistance. Target: 2700-2800$. That’s where the 200 3D EMA and a big liquidity sweep level at 2860$ sit.

ETH BUY ZONE / ACCUMULATING LEVELBINANCE:ETHUSDT is looking bullish after retracing to 1900-2000 region. It should be noted that the same region was previous resistance which ETH broke in Dec 23' before making a new swing high.
This is a great buying zone technically for someone who does not trade and wants to buy/hold BINANCE:ETHUSDT for the long term!

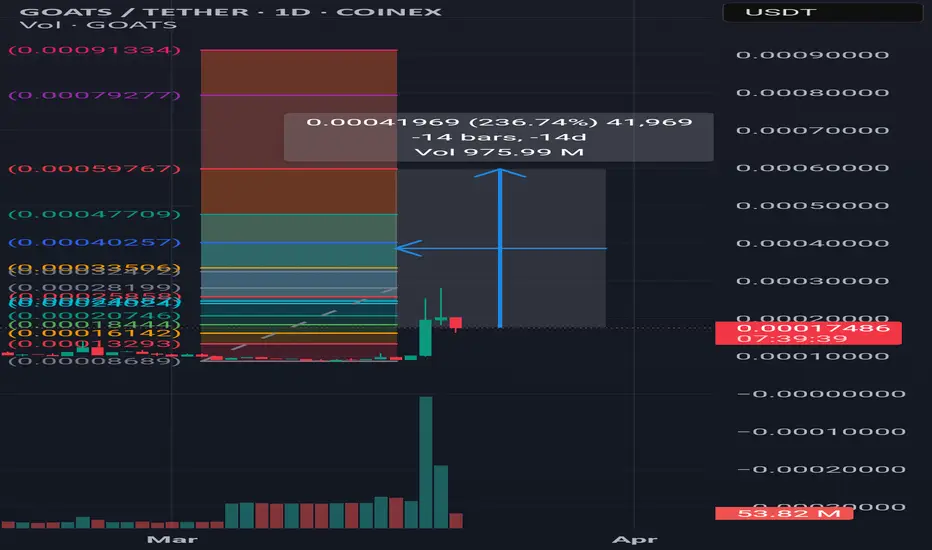
Goats is longHello, the goats game team is looking to partner with other blockchain projects to expand its community. These partnerships could include other meme projects, non-fungible token (NFT)-based projects, or DeFi platforms. The goats currency could see at least a 200-300% Fibonacci pump.