End of the Ride for Take Two Interactive. TTWOLooks like an end to an Elliott impulse, with the standard 2-4 line and momentum divergence intact. Posing an entry as MIDAS line along with BB%PCT were crossed and crossed the zero line respectively. VZO and Stoch RSI are unreliable because they do not reflect price action here, probably due to all that recent barbwire trading.
M-oscillator

$BTC Bearish Divergence on the Weekly !? NO!!!Someone on Twitter sent me a chart showing Bearish Divergence on the Weekly for BTC and asked me to analyze it.
(hopefully this link shows the chart)
pbs.twimg.com
My response is below.
---
This is a really good question!
Caught me off guard for a second and I had to really analyze it.
That chart assumes we’re at the end of the cycle, so its showing bearish divergence prematurely in Mar ’25.
But the fractal it’s being compared to shows divergence with the peak in Nov ’21.
Here’s the correct way to draw the trends.
If you draw from the bear market low to current date, you see we are just getting warmed up.
This cycle is mimicking 2017 as I’ve mentioned a lot over the past year.
I marked where we are so you can see the Feb - Mar ’21 dip in RSI.
Imagine tapping out right before the moonshot!
It’s easy to get caught off guard with that chart, as the fractals from ’21 and ’25 on the RSI do look strikingly familiar, but notice how the right shoulder on the RSI falls in Nov 21’ , but the right shoulder on the RSI in Dec ’24 is going higher, pointing to the RSI following the ’17 uptrend.
I wonder if the person who made that chart actually thought that was the correct way to analyze the chart, or if that’s just a troll bear-posting.
I could see someone like CredibleCrypto or an XRP-maxi posting that.

Russel 2000 Compared to General MarketTVC:RUT has continued to sell off since my last couple posts and I believe we could see a huge market correction this year if price doesn't look to stop selling.
The next play on RUT I would like to see price pullback to the last breakout zone ($2,200) to confirm a continuation in trend
This play also looks very familiar to the 2022 selloff with equal highs to our current price structure. Seeing that AMEX:SPY is at a higher high tells me there is market-wide divergence and a topping pattern could be in play.
Now when we add CRYPTOCAP:BTC and $OTHER to the mix we can see bitcoin actually tops out first while Alts and SPX look to make one more leg up before crashing out.
The Trend Reader at the lower tab has topped out and has a bearish crossing in the overbought zone indicating we can see a long term play to the downside.

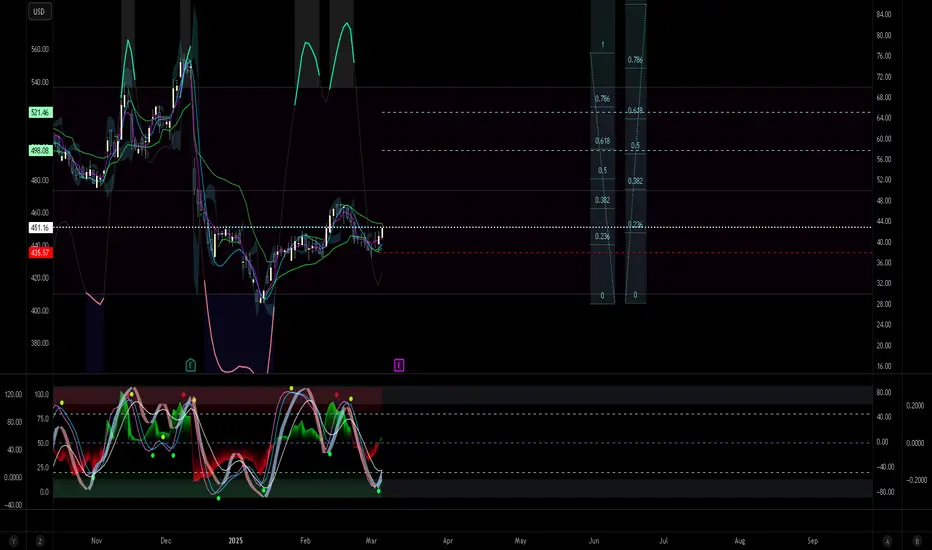
There's A Setup For A BounceFor fun, no idea what I'm doing.
Same as all the last times really, just see how it goes tomorrow morning, right now futures are flat but it's early. Going off the futures chart I think it'll meet my requirements short of a huge gap up.
Depending on what happens tonight going into tomorrow it's setting up for a bounce as crazy as that looks and sounds (again). Yeah it's been a little bad recently, and every day who knows what is done or said that can move markets either way, and we are not THAT far off from ATH, but the bounce setup is there, and potentially will actually follow through for the first time since the end of October 2023.
The bottom graph has a line that suggests oversold. In my mind it is set up if the line remains below the dotted line Mar 7. If it goes up above then maybe toss the idea. I literally only post when this is set up.
Maybe down early in the first part of the day due to something like jobs, then reverse up and hard for the next few days?
From the low of Mar 7 -
I usually say
5% chance of ~10% by Mar 12 (top yellow circle)
40% chance of +5.5% by Mar 12 (lower yellow circle)
60% chance of +5.5% by Mar 21 (right yellow circle)
But I really really really don't think we will get +10% with how things are set up that's ATHs, but just saying it does happen sometimes (not when it's like this though). So much so that I didn't even put it on the chart this time around.
Green eclipse is things going according to the idea, above is a bonus, below is a fail. If it does bounce, no idea how long it'll last.
You might be asking 40%? 60%? so you're flipping a coin? could go up, could go down? Well it's 40-60% chance of +5.5%, nothing is guaranteed and that's why you have responsible stops in place.

$COIN - pocket full of coins or out of coins?CAPITALCOM:COIN has dropped from $349 to currently $218 over the last three days, but seems to maybe have settled at the support in this area. Working on a bounce up from support, and MACD looks to maybe cross up and RSI has crossed up. Might be time to consider a long, my target is $300. The three candles since the bounce have been long-tailed, indicating buying interest. Of course, considering CAPITALCOM:COIN one must also look at CAPITALCOM:BTCUSD as they tend to move in tandem.

WTI crude oil Wave Analysis – 7 March 2025
- WTI reversed from the multi-month support level 64.90
- Likely to rise to resistance level 68.60
WTI crude oil recently reversed sharply from the powerful multi-month support level 64.90, which stopped the previous sharp downtrend at the start of September.
The upward reversal from the support level 64.90 will likely form the daily Japanese candlesticks reversal pattern Morning Star Doji.
Given the strength of the support level 64.90 and the oversold daily Stochastic, WTI crude oil can be expected to rise further to the next resistance level 68.60.

Abbott Hitting its Top. ABTRSX Divergence and crosses on volatility and stochastic indicators below. A strong change in flavor of candlesticks now, despite no cross of MIDAS. This one has been climbing for quite a bit, and now it might be time for a correction if just a temporary one.

Pivoting Automatic Data Processing. ADPStrong bearish candle starts the picture painting. MIDAS cross follows, along with divergent RSX now out of OBOS territory. Would you look at that long combo on BB%PCT, now flipping to bearish. Interestingly, VZO and Ehlers Stoch RSI have been chronically divergent along the fifth wave, which is often seen. Fifth wave has often been attributed to traders big and small pushing the price beyond sustainable levels, which gets high lighted by divergences being throw off all over the place.

Higher Highs for Danaher Corp. DHRABC zigzag complete, now out of OBOS territory and MIDAS curve crossed. vWAP is supportive. BB%PCT crossed zero line and growing, VZO ribbon cross noted as well. One higer low established also. Let's go!

$SPY March 7, 2025AMEX:SPY March 7, 2025
Time frame monthly analysis.
Monthly.
The current move started from Covid low.
So, for the move 218.26 to 613.3 holding 520 is important now as it represents 23.6% retracement.
And for the extension 218.26 to 480 to 318 we have completed 100% move 614 levels. for the rise 218 to 480.
Hence, we are having some resistance.
Also 520 is 21-month average and in important.
Weekly.
Starting from low 348 if we connect 409 low taking top channel as 609 and draw a channel, we see AMEX:SPY in channel.
Here 560-565 is important to hold being 50 week average and mid channel line.
I expect pull back as oscillator is losing strength and we have red volume bars above average last 3 weeks.
Daily.
Too many above average sell volumes.
My stochastic false bar indicator became red.
So, any rise is only sold on rise until I get a green false bar.
My Eliott oscillator is red.
Price touching 200 averages last 3 days.
A steep fall from 613 to 570.
So, if we take the last rise from 510.27 to 613.23 38.2% correction done.
If AMEX:SPY breaks this then it is weaker.
At the moment if break 569 levels will bar close near low my target is 560 levels. which is 50% retracement for the rise.
And in daily if we take the rise from 540 to 613 565-568 represents 61.8% retracement for the rise.
That will be my target today.
So, for the day if 570 breaks target 565-568.
And for the last fall 613.23 to 570.12 605 need to cross for ant longs in daytime frame.
At the moment.
And any pull back to 576-578 will be a good level to short.
Not the time to go long.

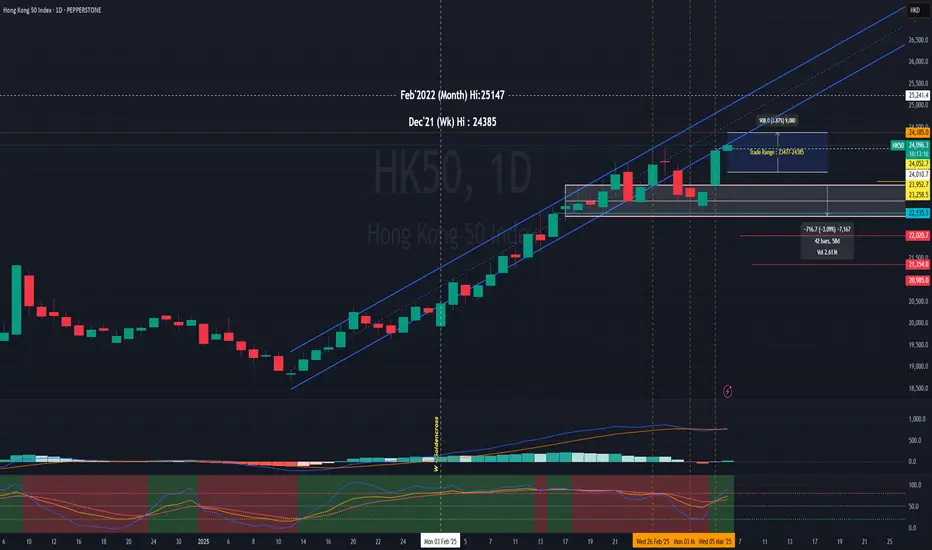
GPS recalculating, HSI is finding its way back to the bull routePEPPERSTONE:HK50
D chart : it tries to returning into uptrend channel.
HSI:HSI
D Chart
We look forward to see it at 24192, 24385! Let's continue to monitor.
W Chart PEPPERSTONE:HK50
in 1H 4H chart mentioned the Index is intact and in the Bullish runway!
Look at longer term and trade zen-ly!
Cultivating and nurturing your trading mindset:
Pay attention to your trading strategy becoming a great trader but not profits from one trade.
Happy Trading Everyone.
** Please Boost 🚀/LIKE 👍, FOLLOW ✅, SHARE 🙌 and COMMENT ✍ if you enjoy this idea! Share your trading journey to encourage the trading buddies *
Crypto market is just waiting for that.Hi.
I expect the federal reserve rate to finally start to decline as early as October.
Three targets for this possible reduction.
I expect the crypto market to react very well.

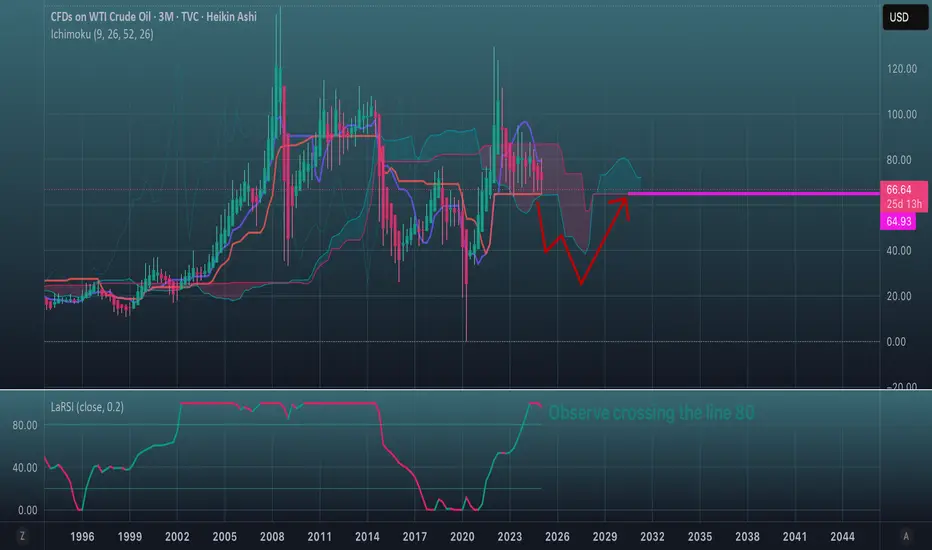
Oil support check.Three-month chart.
This is a situation on a very shaky edge.
The price has been crawling between the Kijun and Tenkan
lines for two years, the first of which works as resistance and the second as support.
A break of the ~$64.70 level could mean an exciting rally down to the ~$40 level first.
Speaking simply about the design of such an Ishimoku cloud, I would like to say.
we need to pay attention to the elongated cloud at the bottom. And now the price may
dive under it and fall into the $ 25-20 range for a while.
After that, it will start its recovery and it will again strive upwards to the level of $ 64.70.
So far, even Trump's statements have not broken the support.
But stand to drop the price out of the cloud, you will see a plunge to the depths.
Google to Shoot Up. GOOGABC ZigZag complete. We retraced an upward move, to bounce off a recent low of lows. VZO, Stochastic threw off signals, US and VZO are supportive now. The bullish candle crossed 0-B zigzag line. Good luck and don't lose capital.

Further Bullish Moves on Palantir. PLTRA pretty clear bounce of a long term trend line. Four indicators paint a picture of bullish move here to follow.

Micron Technology Moves Off Resistance. MUTight trading channel at hand here, technically signaling for a bullish take in this instance.

Lam Research to the Upside. LRCXWe are (probably) bouncing off the resistance. That bullish engulfing, VZO cross, Stoch cross, BB%PCT divergent, candlestick cross on vWAP and US are evidence of the bullish stance on this one. Whatever your system is, be prepared to look at the market from multiple directions. I normally use a constellation of five, but usually more, factors to develop an opinion on trend, market structure, points of entry and exits.

Correction on Starbux. SBUXFive impulse is done. Divergent RSX hump present, now out of OBOS territory. MIDAS line is crossed, as is zero line on BB%PCT. VZO has been divergent for a while now, throwing off false signals. Now, there is a VZO signal as well, but in constellation with a multitude of other factors. Ehler's indicator doesn't make a lot of sense in this picture, however.

Reversal on Caterpillar. CATA very flat AB=CD, ABCDE retrace on impulse contained within. Now, in OBOS territory, but fairly convincing candle crossing vWAP/US duo. My guess is that was a triple drive contained within AB=CD structure. Another note, the ABBCDE forms an expanding triangle structure, and any triangle is more likely to break out on the flat side. The top side is more flat in this case. Given the deep retrace, I don't expect a spectacular breakout if it even happens.

Higher Highs, Higher Lows on Adobe. ADBEAnd on top of that a few more technical signals acting in unison to suggest a bullish picture. Simultaneous or near simultaneous crosses on VZO, Stoch/RSI. There is a cross of zero line BB%PT. Last candle crossed vWAP and sits on both vWAP and VZO. Fibonacci clusters offer some static profit goals. In practice these are never used and I just throw them in there to keep track of how my ideas go in terms of reaching goals.
Bullish for Amazon. AMZNSupposing end off Wave A of correction, quite a deep one retracing half the previous bullish impulse. RSX momentum is divergent, heading toward OBOS line, divergent Bollinger Band derivative indicator. A strong change in texture of candlesticks is noted.
Signals on both VZO with offset and Ehlers Stochastic RSI have already thrown off signals a few candles ago.
Fibonacci points picked to coalesce with data already available for possible constellations/clusters, i.e. 0.5 Fibonacci coincides with MIDAS curve.

Microsoft Bounce off Support. MSFTElliott picture is unclear, yet there are signs of undergoing pivot. There is a fairly massive engulfing bullish candle that crosses both vWAP and US lines. There is a cross on the VZO, Ehler's Stochastic that occurred simultaneously. BB %PCT looks to cross soon as well. The stop loss is pretty tight, good luck in your trading.

USD/CNH Near Pivotal Support – AUD, NZD Implications LoomUSD/CNH isn’t everyone’s favourite pair to trade, but it should be on your radar if you dabble in AUD/USD or NZD/USD. Its correlation coefficient with AUD/USD ranges from -0.72 to -0.96 across timeframes from five days to six months, while for NZD/USD, it sits between -0.78 and -0.95. That suggests a strong relationship when comparing performance against the U.S. dollar, especially in the very near and longer term.
That’s noteworthy given where USD/CNH sits on the charts, teetering just above 7.2345—a level where bearish moves have repeatedly fizzled in recent months. However, with momentum indicators biased lower, another attempt may have more success.
A sustained push below 7.2345 could encourage additional bears to join the break, particularly if minor support at 7.2130 gives way. While the 200DMA sits in between, price action has largely ignored it recently, showing far more interaction with the 50-day equivalent. That makes it worth noting but not a major barrier.
Below 7.2130, there’s little visible support until 7.1400—a level that capped gains for extended periods last October before the U.S. presidential election. If 7.2345 holds firm, traders may look for a potential retest of recent range highs around 7.3000 and the 50-DMA.
Good luck!
DS
