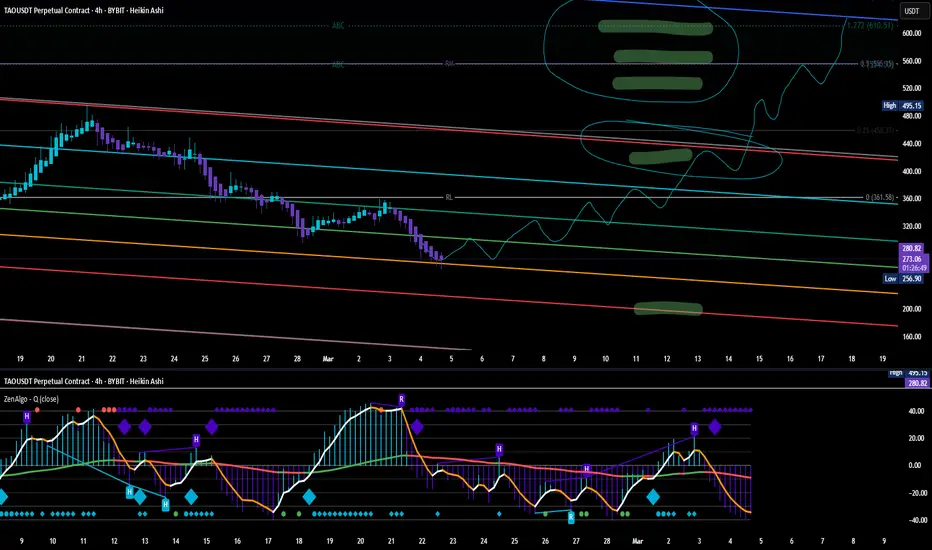
TAO/USDTBittensor ( BYBIT:TAOUSDT.P ) is a decentralized network that merges blockchain technology with AI, enabling a peer-to-peer marketplace for machine learning models. Launched in 2021, TAO has quickly gained traction for its innovative approach. The project operates with a capped supply, ensuring transparency and fair distribution of rewards. As of now, TAO trades at approximately $319, with a market capitalization of $4.09 billion and a circulating supply of 7.38 million tokens.
Bittensor (TAO) is currently trading within a downward channel. Before any potential upward movement, a retest of the $300 level is likely. Once the price reclaims the range, the next target stands at $420, where an unchecked VWAP awaits. The following key technical level is positioned at $520. In green higlited areas are untested VWAP.
On the bottom of chart you see super Q indicator.
Description
ZenAlgo - Q is an oscillator based on the QQE (Quantitative Qualitative Estimation) method. This version incorporates refinements for additional visualization and interpretation options. It is designed to help traders observe momentum changes and divergence patterns in price movements.
M-oscillator

Gold - XAUUSD Expected Next Movement 4th March 2025Hello traders, I am sharing technical analysis of Gold - XAUUSD.
Prices are going to retrace to the upside and reach the Fib level of the golden ratio, which is 50% to 61%.
According to my CCT—Candle Closing Technique method, price has broken the CCT line to the above side in the 4-hour timeframe and is going to the Fib level. So, it is expected to return to the sell side in the near future. So, let's see.
This is my own personal technical analysis and is not any financial advice, so it is requested that you do not trade on your real account before doing your own analysis.

Bitcon Going down to 62kas trendline shows as well as fibo on last correction here looks the end of this bullish run and bitcoin going to correct down to 62k

$SPY March 3, 2025AMEX:SPY March 3, 2025
15 Minutes.
we had divergence in the last two LL at 583 and 582 levels.
For the rise 582.44 to 594.74 holding 591-592 is important for short term uptrend to continue.
For the fall 610.7 to 582.44 61.8% retracement is around 599 which is also 200 averages in 15 minutes.
Hence that is the first target for the day, holding 592.

ADAUSDT Breakout Incoming or Another Fakeout?Yello, Paradisers! Are we about to see ADAUSDT explode, or is this just another trap for impatient traders? Let’s break it down!
💎ADAUSDT is looking solid after completing a proper double zig-zag corrective phase. The key to confirming the next move lies in breaking and closing a candle above the resistance level. If this happens, it significantly increases the probability of a bullish breakout. Why? Because ADA is still trading in the discount range of a descending channel, and we’re also seeing bullish divergence—a strong confluence signal for upside momentum.
💎However, if ADA pulls back or retraces further, the smartest play is to wait for inducement. Ideally, we want to see bullish structures form, such as a bullish I-CHoCH or well-known bullish patterns like a W formation or inverse head and shoulders on lower timeframes. If those confirmations appear, the probability of a bullish move shifts in our favor.
💎On the flip side, if ADA falls sharply or closes a candle below the support zone, it would invalidate our bullish scenario. This would likely extend the corrective wave into a deeper structure, signaling that it’s best to stay patient and wait for clearer price action.
🎖 Bottom line? The market is setting up for a major move—either a powerful breakout or a deeper retracement. Only those who wait for the right confirmations will come out on top. Stay disciplined, Paradisers! 🚀
MyCryptoParadise
iFeel the success🌴

XAUUSD Refocus Trendback📌Gold price extends the rebound early Monday and re-focuses on the $2,900 level.
📌US Dollar falls as EUR/USD rallies hard on potential Ukraine truce; market mood improves.
📌Gold price recovers but remains below 21-day SMA at $2,895 amid the bullish daily RSI.
🔥Buy Gold
$2832 -> $2834
SL $2825
TP 1->$2840 >2->$2850 >3->$2860
🔥Sell Gold
$2882 -> $2886
SL $2890
TP 1->$2875 >2->$2860 >3->$2855

CYCLE 4 | CME GAP: Bull Cycle Period First Major Pull Back?Quick post to address BTCs expected potential first major pull back into this bull run period...
BULL MARKET PULL BACKS
Historically, BTC during its bull market enjoys pull back which ranged from 15% to as much as 30%-40% in prior markets. This is essential for trader participants in the market to take profits, allow BTC to retest low levels and prove new heights are sustainable before ranging to new higher price levels.
The first pull back historically for BTC post the start of the 'Bull Run' phase of BTCs 4 year cycle is traditionally the largest pull back opportunity and historically been the best short term buying opportunity in the Bull Run (NOT FINANCIAL ADVICE).
We can expect a 30-40% correction for this pull back based on historic bull market period examples (Let me know in the comments below if you would like me to detail consistent price behaviour during BTC bull run periods in a future post).
ARE WE AT THIS POINT NOW OF THE CYCLE? WHAT ARE THE INDICATORS SAYING?
As highlighted by the RED arrow on the chart, a number of the indicators like to monitor on the weekly chat are suggesting bearish divergences and fading momentum exists with the current price action. This is calling for a cooling off period of the market.
CME GAP
Historically, BTC has had a tendency to want to 'close' open gap, created by weekend trading of BTC that does not align with equities that follow the traditional 'No Trading' over the weekend policy of Traditional Financial instruments. Hence crypto ETFs which align with these policies (such as the CME Futures chart as seen in this chart) can create 'GAP' between the open (Monday) and close (Friday) candles.
To understand CME gaps, please take the time to review the details discussion in the earlier post.
The orange BOX shows the below CME gap target that BTC price may range towards to close.
NOTE: this box has been listed as Partially Closed as the open Monday candle of the gap did go below before rising during the weekly candle but did no dip past the close of the previous weekly candle.
21W EMA & 20W SMA
Historically, a fully developed healthy bull market for BTC has required periodic retesting and holding of these moving averages. A close of the CME gap at this point of the market would also satisfy this historic trend for BTC.
ORANGE TREND LINE
Bears if eager to continue the 'close the CME gap' trend will need to convince the market by first exceeding the orange trend line. Currently this allows BTC to complete a 10 to 12% correction while also taking the price below the key psychological 100K price level, without phasing the bulls conviction to charger higher.
* Holding the Orange Trend Line Scenario: we want to see price bounce and conviction from the bulls to push BTC to higher highs. The goal for Bears would be to achieve the measured move up to 180K. This would most potentially shorted the bull run (time prospective) and potentially cap our ATH for this cycle early; creating a distribution zone similar to the 2021 cycle top.
* Breaking below the Orange Trend Line Scenario: If we break the Orange Trend Line then Bulls will concede ground to the MA levels (allowing the CME gap to also close). Bulls will write this off as a market reset and holding support at these levels will entice Traders to take positions needed to drive BTC up sustainably to the next higher level(s).
Losing the MAs would ask serious questions to the intent of BULLs and the sustainability of the market moving forward this bull run.....

Silver Embarking on Bullish Reversal?Silver’s bearish wedge breakout may have run its course, with Friday’s rebound from key support at $31.00—where the 50DMA and former resistance converge—suggesting a potential shift in direction. While MACD hasn’t confirmed it yet, RSI (14) has broken its week-long downtrend, hinting at a turn in momentum.
With price action firming and Friday’s hammer candle flashing a bullish signal, the near-term bias has tilted higher. That case would strengthen further if silver adds to gains on Monday, completing a morning star pattern in the process.
A quick glance at the chart shows silver’s tendency to gravitate toward big and half-big figures, putting $31.50, $32, $32.50, and $33 on the radar for those considering longs. Aside from the first, they screen as potential targets depending on risk tolerance. A stop beneath $31 offers protection against a reversal.
Good luck!
DS

$HNT Bullish Exaggerated Divergence on Daily RSIBeen accumulating a very large position of FWB:HNT
Bullish Exaggerated Divergence on the Daily RSI.
Price looks to have bottomed claiming previous lows.
Helium Mobile is one of the strongest IRL DePin projects 💯
$600m Market Cap is extremely undervalued compared to the rest of the industry.

Most overbought in 10 years !? I've used 3 forms of technical analysis to make a case for a major top forming in the European markets. If this turns around, it could lead to a 10% selloff very quickly and if this transforms into a bear market then 20% drop is totally on the cards. Nothing goes up forever.

Ethereum Wave Analysis – 28 February 2025
- Ethereum reversed from support zone
- Likely to rise to resistance level 2400.00
Ethereum recently reversed from the support zone between the major long-term support level 2200.00 (which has been reversing the price from August) and the lower daily Bollinger Band.
The upward reversal from this support zone is currently forming the daily Japanese candlesticks reversal pattern Hammer – a strong buy signal for Ethereum.
Given the strength of the nearby support level 2200.00 and the oversold daily Stochastic, Ethereum can be expected to rise to the next resistance level 2400.00.

How I Secured 100+ Pips on NZDUSD Sell This WeekHey Rich Friends,
Happy Friday. Today, I will dive deep into the NZDUSD sell I took this week. Fortunately, my analysis was correct, and with patience, I was able to secure 100+ pips. Here is what I did:
First, I used session breaks on the 1HR time frame to help me identify the previous days' high and low. This is important because based on how the market reacts in these areas, it will help me determine what to do. For example:
- rejection at PDH = SELL, break out above PDH = BUY
- support at PDL = BUY, break out below PDL = SELL
In this case, there was a break below the PDL which was my first indicator to go short.
Next, I used horizontal lines to mark additional lows for potential TPs since I was selling and I used a previous high for my SL.
The only indicator that I used was the stochastic. You can find a very detailed breakdown of how I use the Stochastic in my previous Editors' Pick video here: www.tradingview.com
I hope this was helpful. If you made it this far, comment a "7" and let me know what you've learned.
Peace and Profits,
Cha

Bear Flag in Adobe?Adobe trended lower most of 2024, and now some traders may expect another push to the downside.
The first pattern on today’s chart is the series of higher lows since mid-January. The software company recently slid below that line, which may be viewed as a bear flag breakdown.
Second, bearish gaps after the last two earnings reports could reflect weak sentiment.
Third, ADBE has been unable to get above its falling 50-day simple moving average (SMA). That may indicate a negative intermediate-term trend.
Also notice how the 50-day SMA is under the 100-day SMA and both are below the 200-day SMA. That configuration, with faster SMAs below slower ones, may indicate a negative long-term trend.
Next, the 8-day exponential moving average (EMA) just crossed below the 21-day EMA. MACD is falling as well. Those patterns may be consistent with bearishness in the short term.
TradeStation has, for decades, advanced the trading industry, providing access to stocks, options and futures. If you're born to trade, we could be for you. See our Overview for more.
Past performance, whether actual or indicated by historical tests of strategies, is no guarantee of future performance or success. There is a possibility that you may sustain a loss equal to or greater than your entire investment regardless of which asset class you trade (equities, options or futures); therefore, you should not invest or risk money that you cannot afford to lose. Online trading is not suitable for all investors. View the document titled Characteristics and Risks of Standardized Options at www.TradeStation.com . Before trading any asset class, customers must read the relevant risk disclosure statements on www.TradeStation.com . System access and trade placement and execution may be delayed or fail due to market volatility and volume, quote delays, system and software errors, Internet traffic, outages and other factors.
Securities and futures trading is offered to self-directed customers by TradeStation Securities, Inc., a broker-dealer registered with the Securities and Exchange Commission and a futures commission merchant licensed with the Commodity Futures Trading Commission). TradeStation Securities is a member of the Financial Industry Regulatory Authority, the National Futures Association, and a number of exchanges.
TradeStation Securities, Inc. and TradeStation Technologies, Inc. are each wholly owned subsidiaries of TradeStation Group, Inc., both operating, and providing products and services, under the TradeStation brand and trademark. When applying for, or purchasing, accounts, subscriptions, products and services, it is important that you know which company you will be dealing with. Visit www.TradeStation.com for further important information explaining what this means.

DXY Phantom Strength.While I'm making this analysis Public, its purpose is really just a 'fun' project for myself to take a look back over time to see how (if) accurate it turns out to be.
what does the DXY yrTF 'tell' me?
1) the CCi has been making strong bullish moves (+100) away from the average price... while price has been printing LH's.
2) 2007 has been the only year (since 1980) with a CCi -100 Bear Push (& only just) & price printed a LL!
In other words, attempts of strength by the DXY results in an actual show of Weakness (LH's)?
While this has been sustained over decades, in my mind... DXY 'strength' DOES NOT RING TRUE.
3) While 2022 broke above the last LH of 16/17 (Off the HL of 2020...creating an up trend?)... yearly price has not closed above the 16/17 LH.
4) AND Price is still inside the 01/08 Bear Push Range.
REMEMBERING This is a Yearly Time Frame and therefore a VERY long term analysis, it seems to me the DXY is ultimately going to Dump.
5) Short Term However, I think a move to the yrWkZ of 2002 is still possible, if not likely. $115.00 ish.

Accelerating Losses Puts Uptrend Under ThreatTraders should be alert to the risk of an accelerated downside move in S&P 500 futures.
After hitting record highs just two weeks ago, the price action has deteriorated rapidly with an initial break of minor uptrend support followed by sustained selling on rising volumes. The 50DMA has given way, as has the February 3 low, leaving the price teetering on the November 2023 uptrend. RSI (14) and MACD continue to trend lower, reinforcing a bearish bias.
If the uptrend fails, bears may target a retest of 5808—a level that has been well-contested in recent months. That aligns with downtrend support extending from the December highs. Beyond that, the 200DMA looms as a key test for those eyeing a deeper pullback.
Alternatively, a bounce from the uptrend would confirm it as support, creating a setup where longs could be established above with a stop beneath for protection. A move above 5935.5 would be an early bullish signal, with a break opening the door for a push towards 6000 and the 50DMA.
Good luck!
DS

XAUUSD Weekly Butterfly and DivergenceXAUUSD weekly, has butterfly pattern with RSI divergence
Likely retrace back from here to around the 50ema, which is around the 2500 level give or take

TSLA - Starting to DCAI think we are in a good range to start accumulating, down 41% from the top and every indicator I test out seems to be oversold. Potentially it can go lower to ~$225 - this is why I'm not throwing all my money. Definitely a company of the future.

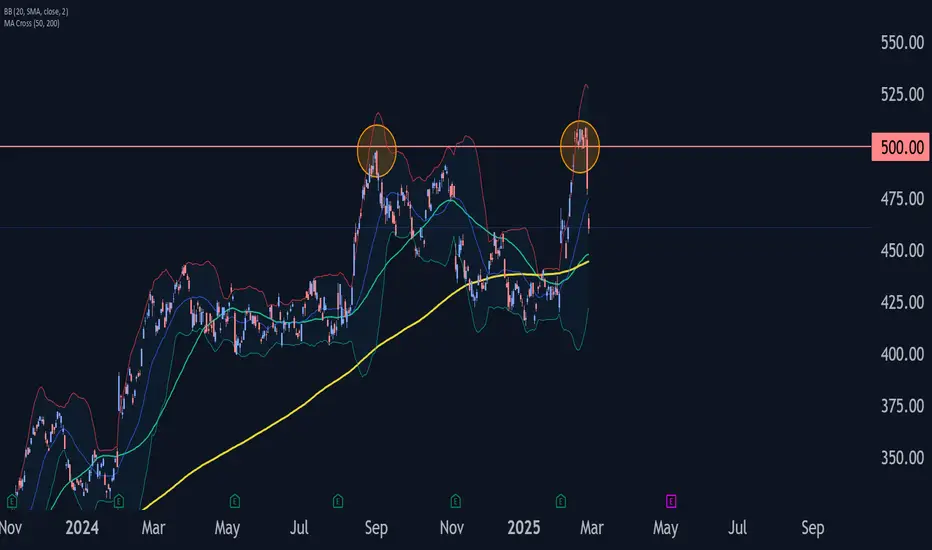
Ferrari Wave Analysis – 27 February 2025
- Ferrari reversed from round resistance level 500.00
- Likely to fall support level 440.00
Ferrari recently reversed down from the resistance zone between the round resistance level 500.00 (previous yearly high from 2024) and the upper weekly Bollinger Band.
The downward reversal from this resistance zone is likely to form the weekly Evening Star Doji – if the price closes this week near the current levels.
Given the strength of the resistance level 500.00 and the overbought daily Stochastic, Ferrari can be expected to fall to the next support level 440.00.
BTC At Critical Support on 200DMA + RSI Way Oversold₿itcoin testing critical support on the 200DMA 🚨
Last time it closed under on July 4, 2024 it ranged for 101 days.
RSI hasn't been this oversold since August, 2023.
Last time BTC was at this RSI level and closed under the 200DMA it ranged for 60 days.
HOWEVER, the only time BTC has ever closed under the 200DMA on a Post-Halving year was in May 2021, where it then went on to rally to another new ATH.
I'm personally buying here 💯

Will STXUSDT recover from a failed fifth Elliott wave?
We start our Elliott wave count at the bear market lows (Nov 2022). The first wave tops in March 2023 starting the second wave that bottoms at the 0.618 Fib (typical second wave). The third wave tops along with most of the crypto market in end of March or early April 2024. Then the fourth wave corrects more than expected barely holding the 0.382 Fib, the first wave high and the pitchfork median line support. The fifth wave starts in August 2024 and tops in December 2024, below the third wave high and rejecting from a pitchfork resistance. From here STX tumbled down.
STX recently found support at the outer line of a macro modified Schiff pitchfork. We can see that the price action interacted with the median line of this pitchfork throughout the bull run. If we are to hit that median line again, we get a pretty ambitious target at around 5$ by the end of July 2025.
Below I examine other pitchforks for more realistic price targets.
Looking at the same pitchfork on linear scale we again see price action interacting with median, 0.5 and outer lines of the pitchfork. This chart gives us a target price of around 1.9 by the end of July 2025.
Changing the pitchfork type to Schiff and looking at the log chart again shows price action interacting with median and 0.5 lines of the pitchfork. This chart gives us a target price of around 2.44 by the end of July 2025.
Some smaller pitchforks on the log chart provide us with additional resistance levels to keep in mind.
Similarly on the linear chart. Here we also see a pitchfork median line that served as support.
In recent price action we can see bullish divergence in RSI and SRSI. In addition, at the daily close, one should watch for bullish crosses in RSI and SRSI.
Will this be the turning point for STX? Time will tell.

WTI Crude: Uptrend on the Brink—Break or Bounce Ahead?WTI crude oil is testing key uptrend support, offering fresh trading setups depending on how the price action evolves.
With Tuesday’s bearish key reversal candle, RSI (14) trending lower and MACD confirming the bearish momentum signal, a downside bias is favoured. However, with crude already down sharply—and past rebounds from the trendline often proving violent—patience is key.
A clean break below the uptrend could open the door for shorts, with a stop above for protection. Buyers have stepped in around $67–$66.33, making that a key zone to watch. A break lower would put the September 2024 swing low in play.
If support holds, the setup could be flipped. Longs could be established above with a stop beneath for protection. Former channel support sits near $69.60 today—making it an initial upside target—with Tuesday’s high around $71.30 next on the radar.
Good luck!
DS

Gold Bulls on Notice: Cracks Forming in the Rally’s FoundationTraders should be alert to the growing risk of a downside move in gold.
Bullish momentum underpinning the rally has weakened over recent weeks, alongside shaky price action.
RSI (14) has diverged from price, setting lower highs even as the latter briefly hit record levels. The bearish momentum signal has been confirmed by MACD, which has turned lower decisively.
While bulls defended uptrend support on Tuesday, resulting in a decent bounce, that’s unlikely to perturb bears given the increasingly unconvincing technical picture, punctuated by the bearish engulfing candle delivered during the session.
If we were to see a sustained break of the uptrend, keep a close eye on the price action around $2882.40—a level bullion tested either side on multiple occasions earlier this month. A break below could open the door to $2390.
Good luck!
DS
