Confirmation of Wave 5 being complete, but which wave 5? It's waves within waves within waves, well maybe...
So now I'm seeing it either as the 1st of a 5th wave extension, or the 5th of the entire move from $15.4k.
These levels here should show what's up. Ideally it finds support around the halfway back, but it could go further, maybe the 618. How it gets there as well is to be considered so let's see. But below those levels and it will probably start getting outside the geometric boundaries I'd consider indicative of this move extending, meaning a deeper sell off to a possible 41K bitcoin.
That kind of sounds like wishful thinking, but some players will want in at a discount, so it's conceivable. The weekly moving averages are always worth considering as well. In any such move down so far, bulls would really want to see it rebounding and closing well above the 200 period moving average that it would likely breach in the sell off.
One longer term tool I keep an eye on is the base channel on the entire move from 15k - so channel on beginning of move to the end of 2, parallel with top of 1. Bitcoin hasn't traded below that base channel since quickly dipping its toe through in 2015, before which it had been above it since March 2013 (log scale) and had tried twice to break above it. So that will be my main overall indicator of whether I'm bull or bear.
Still, whatever happens, it's always a shakeout.
M-oscillator

Downtrend in Applied Materials?Applied Materials has struggled since the summer and some traders may see further downside in the provider of chip equipment.
The first pattern on today’s chart is the series of higher lows between late December and mid-February. Earnings beat estimates on February 13, but conservative guidance pushed the stock below that line. The result is a potential bear-flag breakdown.
Second, short- and long-term moving averages may show bearish trends. The 50-day simple moving average (SMA) crossed under the 100-day and 200-day SMAs in September. Two months later, the 100-day SMA slid below the 200-day SMA.
The 8-day exponential moving average (EMA) crossed under the 21-day EMA two weeks ago. MACD has also been negative.
Finally, you have the big event of NASDAQ:NVDA Nvidia earnings tomorrow afternoon. Given its importance to the entire semiconductor industry, AMAT could be especially volatile around the news.
TradeStation has, for decades, advanced the trading industry, providing access to stocks, options and futures. If you're born to trade, we could be for you. See our Overview for more.
Past performance, whether actual or indicated by historical tests of strategies, is no guarantee of future performance or success. There is a possibility that you may sustain a loss equal to or greater than your entire investment regardless of which asset class you trade (equities, options or futures); therefore, you should not invest or risk money that you cannot afford to lose. Online trading is not suitable for all investors. View the document titled Characteristics and Risks of Standardized Options at www.TradeStation.com . Before trading any asset class, customers must read the relevant risk disclosure statements on www.TradeStation.com . System access and trade placement and execution may be delayed or fail due to market volatility and volume, quote delays, system and software errors, Internet traffic, outages and other factors.
Securities and futures trading is offered to self-directed customers by TradeStation Securities, Inc., a broker-dealer registered with the Securities and Exchange Commission and a futures commission merchant licensed with the Commodity Futures Trading Commission). TradeStation Securities is a member of the Financial Industry Regulatory Authority, the National Futures Association, and a number of exchanges.
TradeStation Securities, Inc. and TradeStation Technologies, Inc. are each wholly owned subsidiaries of TradeStation Group, Inc., both operating, and providing products and services, under the TradeStation brand and trademark. When applying for, or purchasing, accounts, subscriptions, products and services, it is important that you know which company you will be dealing with. Visit www.TradeStation.com for further important information explaining what this means.

$SOL When in Doubt, ZOOM OUT! BULL FLAGHere's a better look at the RSI being the most OVERSOLD since JUNE 2023.
Obvious Bull Flag.

How to Set Multiple TPs...for BeginnersHey Rich Friends,
I wanted to share how I find multiple TPs for my Forex trades using free tools and only 1 technical indicator. This strategy is perfect for beginners because it is easy to follow and has clear confirmations for entering and exiting a trade in profit, even if it hits your Stop Loss.
I keep my charts clean and let price action do the talking. Here's my setup:
✅ Session Breaks & Horizontal Lines – I mark the previous day’s highs, lows, and key levels to identify potential areas of interest.
✅ Stochastic for Entries & Exits – I use the Stochastic indicator to time my trades when the price reacts at my key levels (80 and 20 are very important here!)
✅ Horizontal Lines = Potential TPs – Instead of setting a take profit, I let the market tell me when to exit based on price action around these levels.
Less noise, more precision. Drop a "7" if you made it to the end of the video and let me know if it was helpful!
Peace and Profits,
Cha

TOTAL Crypto Long-Term Trend Probability #2This indicator shifting to a bearish outlook on the 2-day timeframe potentially points to a temporary downturn or risk-averse sentiment in the crypto market.
It could imply that traders might consider taking a defensive stance, possibly exiting positions or hedging, especially if supported by other confirming signals like declining volume or weakening price action.
However, given the overall upward trajectory evident in the chart, this short-term bearish signal might simply indicate a minor correction or consolidation phase rather than a reversal of the long-term bullish trend.

LDO/USDT Technical Analysis – 1D# 📉 LDO/USDT Technical Analysis – Daily Timeframe
🔍 LDO price is currently sitting on its **90-day support level**. This is a crucial area because if the price manages to hold this support, we could see an upward move toward **2.35 USDT**, which is a key daily resistance level.
📌 **Bullish Scenario:** If buyers step in and defend this support zone, we might witness a rally toward **2.35 USDT**, representing a **51% increase** from the current price.
⚠ **Bearish Scenario:** However, if the **1.544 USDT** support level is lost on the daily timeframe, the next critical support would be at **0.925 USDT**. This is the **last major support zone** on the daily chart, and losing it could trigger further downside.
📊 **Indicators Overview:**
🔹 **Volume:** An increase in volume at key levels signals strong buying or selling pressure. Currently, volume is declining compared to the average, indicating uncertainty among traders.
🔹 **RSI:** The Relative Strength Index (RSI) is at **44.22**, suggesting that the market is in a neutral zone with balanced buying and selling pressure.
👀 **Do you think LDO can bounce from this support level, or are we about to see another drop? Share your thoughts in the comments!**
---
🔹 **This analysis is for informational purposes only and should not be considered financial advice. Please manage your risk accordingly before making any trading decisions.**
✅ If you agree with this analysis, drop a comment and share it with others! 🚀

EUR/JPY Bulls Seeking Signal as Price Clings to SupportEUR/JPY is teetering above known support, but with momentum favouring the bears, there’s no need to rush into longs.
If the pair continues find buyers on dips below 156.21, a long trade could be considered above the level with a stop beneath for protection. 158 looms as an initial target, with 159 and 161 other levels to watch.
The preference is to wait for a bottoming signal before entering, similar to the morning star patterns seen in December and early February. RSI (14) and MACD remain firmly bearish, reinforcing the need for patience given the setup is counter to momentum.
A convincing break below 156.21 would invalidate the setup, opening the door for shorts targeting a retest of 154.41.
Good luck!
DS

Global M2 Money Supply RSI Divergence IndicationThis chart combines #Bitcoin price across it's entire lifecycle with a new divergence indicator I created for global M2 money supply. #M2 refers to a broad measure of the total money supply in an economy; an increase of which, is a harbinger of a new flows into assets such as equities and crypto.
The lower panel displays a classic #RSI (relative strength indication) albeit applied to the aggregate of the M2 money supply for all major economies in the world. I've spent a number of years fine tuning a 'divergence' indicator for RSI which I'm now able to successfully apply to this GM2 RSI signal.
The net result when applied to the Bitcoin chart are the clusters of arrows that occur at points of divergence detection. As is evident from the chart these align extremely well with Bitcoin cycle bottoms and serve to complement the existing indicators that I use for bottom detection.

NZD/USD H4 AnalysisPrice bottomed out in February at 0.5516 after entering monthly support.
Since then we have seen a steady influx of buying, most recently peaking at 0.5772 during last weeks trading.
With MACD divergence though, we may now see a correction back to the trendline.

Robinhood Played Itself. HOODA rally run up is ending in strongly bearish price action. It is a recurring theme of the day - ending Elliott impulse followed by negative or bearish signal throw off from indicators.

Shopify Selling. SHOPYes, similar pattern we've seen in a number of tickers today. Very early days, so a tight stop is necessary. Fifth wave gaps can and do happen.

Triangle Breakout for NextEra Energy. NEEPivots are always hard to pick. I can see at least two triangles here, which have both been broken out of. It may be an early impulse to a down going Elliott diagonal.
Volatility, momentum has been less and less bearish, while Bollinger Band derivative indicator is all over the place.
Yet, MIDAS is crossed and vWAP/US combo are aligned, below the candle and upgoing.

Early Sign on General Electric Pivot. GEAnother profitable take last time, despite entertaining a wrong Elliott count. the last idea is linked in to this one
A constellation of factors again on a pivot.
1. Impulse wave completion.
2. MIDAS, BB%PCT cross.
3. vWAP/US combo aligned and bearish.
4. Suspect RSX divergence, now out of OBOS territory.
5. VZO and Stochastic indicator crossed to bearish a while ago.
There are many more interesting things on the chart as far as indicator alignment goes, but its not a listing competition here. Five is generally enough for me to consider putting a position down bullish or bearish.

Morgan Stanley Correction. MSOur last take on MS was dead on and quite profitable. The idea will be linked to this one. ABC zigzag, now impulsing down in C wave. Indicator below are bearish but quite choppy, making meaningful interpretation difficult. Price action, MIDAS cross and behavior of vWAP/US duo are key factors in this decision making.

Netflix Flips. NFLXA correction is well overdue on this one. There is a convincing constellation of indications on this price action, so where to begin?
A five wave impulse appears to be complete, and price action reverses tonality of the previous impulsive bullish candles. Divergences on RSX, BB%PCT. MIDAS line is crosses, while vWAP and US lines are aligned and are above the candle. VZO crossed bearishly and trigger line crossed the ribbon. BB%PCT is now bearish crossing the zero line and Ehler's Stochastic RSI is bearish as well and has been for a while.

Harmonically Bullish on Procter and Gamble. PGXABC bullish zigzag, within a structure harmonically consistent with a developing XABCD. In harmonic reactions, retracements are often indicative of extensions to follow, which in this case is 1.618. This conveniently aligns in a Fibonacci cluster with a .886 larger retracement, consistent with a Bat Harmonic. One thing about Bats is that they are the most common and the most reliable out of the harmonic family. Interestingly, MIDAS, VZO, Stoch and BB%PCT all flipped on literally the same candle? Fractal resonance anyone?

Mastercard Curving Back Down. MAAnalyzing price action here for a suspect pivot on Mastercard. A 5 wave impulse is done, a part of a much larger structure, now crossing MIDAS curve after a tight trading range.
Tight trading ranges inevitably lead to squeezes, and this might be a breakout to the downside in the last two candles. Ehlers is especially telling here, as it clearly indicates a divergence all the way through the tight trading range, which is a bearish sign on its own.
Fourier smoothed VZO plus offset trigger is generally bearish but less revealing otherwise. Bollinger Band %PCT just flipped and is expected to go lower with the most recent bearish price action

Meta Platforms Finishing Local Trend. METAElliott Wave impulse is possibly finished, yet relying on Elliott counts alone comes with unfathomable risk, I looked for a constellation of additional pieces to qualify a short position on the 12H chart.
That is fairly strong bearish price action with lower lows, and indicators are generally bearish or downgoing in the least. More relevantly, RSX left OBOS territory, MIDAS curve has been crossed, and VZO/Ehler's StochRSI have crossed almost in tandem.
Ultimate goal is bottom of A, which an elliotician will recognize to be frequently 0.382 retracement, which interestingly forms a Fib cluster with the supposed fifth wave at 0.786 minor retracement.

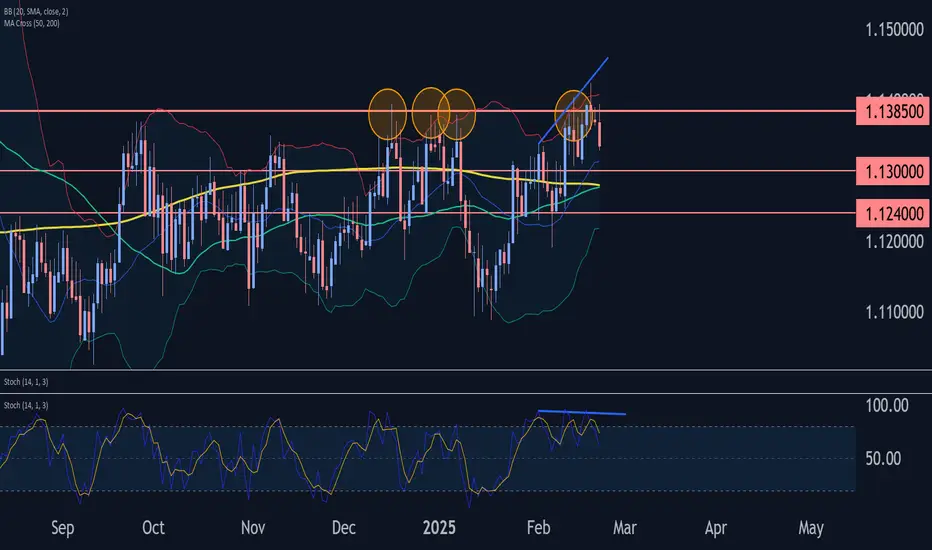
GBPCHF Wave Analysis – 21 February 2025
- GBPCHF reversed from resistance zone
- Likely to fall to support level 1.1300
GBPCHF currency pair recently reversed down from the resistance zone between the multi-month resistance level 1.1385 (which has been reversing the price from July) and the upper daily Bollinger Band.
The downward reversal from this resistance zone stopped impulse wave 5 of the intermediate upward impulse sequence (C) from January.
Given the strength of the resistance level 1.1385 and the triple bearish divergence on the daily Stochastic, GBPCHF currency pair can be expected to fall to the next support level 1.1300 (low of the previous minor correction 4).
$175,000 Bitcoin by SummerLooking at the parabola pattern for Bitcoin, it has played out perfectly this cycle. I'm expecting one final push on BTC's price before a plateau. Since the average price appreciation after RSI trend line breakouts are ~70%, I think anywhere between a $175,000 - $180,000 Bitcoin can happen relatively soon!

Bitcoin - preparing for a Mega bullish waveThe weekly chart is bullish for Bitcoin.
It shows a hidden bullish divergence on RSI, indicating that the price trend is likely to continue upward.
Additionally, the chart highlights a double bottom pattern on HTF.
Bitcoin maintaining support at 0.786 Fibonacci will give it the momentum needed to create a new high.
A new all-time high (ATH) for Bitcoin is expected in the coming weeks.
Best regards Ceciliones🎯

CYCLE 4 | Price %Change Extension from 20W SMABTC PRICE %Δ EXTENSION FROM 20W SMA ANALYSIS
Similar to previous Analysis looking at 'Price %Change Extensions' from moving averages (see links below), we take a look at the respective relationship BTC has held with the 20W SMA over its existence.
HISTORICAL BEHAVIOUR
Observable in Prior cycles BTC has topped and bottom out at High Points and Low Point of this relationship. We can see over cycle periods the highs are sloping downward (indicating ATH of future cycles diminishing in nature is historically in line with this relationship). This is observable via the downward sloping green zone connecting cycle peaks in the BTC Price %Δ Extension from 20W SMA.
For cycle bottoms (excluding the bloodbath of cycle 0), generally we see these occur ~around the 80% Price %Δ Extension region (see the red box below).
CYCLE 3 VARIATIONS | THIS TIME WAS DIFFERENT
It is notable that Cycle 3 was the first cycle where the high and low in this relationship occurred before the price All Time Low and High of Cycle 3, and in this instance the indicator displayed more divergent behavior (suggesting price momentum is reversing) with spikes of a lower high and higher low of this relationship indicating cycle 3 ATH and ATL.
CYCLE 4 ATH TAKEAWAYS
* A revisit of the Green Zone has historically coincided with a significant top or cycle ATH with prior price cycles.
* If Cycle 3 behavior is the new norm, then a revisit of the green area may indicate price momentum reversal. This divergent behavior indicated BTC was setting the final ATH for cycle 3.
* Either scenarios may play out again in Cycle 4 and may be a usual relationship to use with confluence of other relationships to identify Price / Market timing to take final profits.
See Relevant Previous Posts Below

ETHUSD and Crypto Signaling Risk On?So typically for equities I use the one hour, but when it comes to crypto being that a trading day is 4x a typical day for equities, I use the 4 hour. The one thing about my momentum indicator, is that forward testing has indicated that the longer a trade survives, the more likely it is to win! This one looks like we have a double bottom in the works as it approaches the neckline. If it can breakout, instead of testing that take profit, we are likely to smash thru it. I guess patience pays...
The signal was created by the King Trading Momentum Strategy combines the 5 EMA crossing above the 13 EMA, RSI strength, favorable momentum as measured by ADX plus evaluating recent volume changes and even something that measures breakout momentum called Beta for some equities! ETHUSD and over 100 equities are built into this script, as well as, BTCUSD and SOLUSD with optimal backtest take profits and stop losses and can be toggled on by simply checking a box (default they are turned off). I always enable Using Bar Magnifier and On Bar Close in Properties.
