Bitcoin futures eye breakout from falling wedgeBitcoin futures are threatening to break out of the falling wedge established in early December, testing resistance during Asian trade.
With RSI (14) through its downtrend and MACD set to cross over from below imminently, momentum is swinging in favour of the bulls, bolster the case for upside.
If we see a clean downtrend break, longs could be established with a tight stop beneath for protection. Depending on the risk-reward sought, potential targets include the highs set in early January or record high of $108,945.
If the price is unable to break and hold above the downtrend, it would lessen the appeal of initiating longs.
Good luck!
DS
M-oscillator

EURGPB Wave Analysis 15 January 2025
- EURGPB reversed from multi-month resistance level 0.8445
- Likely to fall to support level 0.8380
EURGPB currency pair recently reversed down from the strong multi-month resistance level 0.8445, which has been steadily reversing the price from the start of September, as can be seen below.
The resistance level 0.8445 was further strengthened by the upper daily Bollinger Band and by the nearby 61.8% Fibonacci correction of the downtrend from the start of August.
Given the overbought daily Stochastic, EURGPB currency pair can be expected to fall to the next support level 0.8380.

EURUSD Wave Analysis 15 January 2025
- EURUSD reversed from key support level 1.0225
- Likely to rise to resistance level 1.0425
EURUSD currency pair recently reversed up with the daily Japanese candlesticks reversal pattern Morning Star (with the daily Hammer in its middle) from the key support level 1.0225, which stopped the previous impulse wave i at the end of December.
The upward reversal from the support level 1.0225 started the active short-term correction iv, which belongs to the downward impulse wave 3 from last month.
Given the bullish divergence on the daily RSI indicator, EURUSD currency pair can be expected to rise to the next resistance level 1.0425, which stopped the previous waves ii and (ii).

SP500 - Bullish Continuation - Dow TheoryVANTAGE:SP500 has tested the daily support and currently experiencing a good bounce. I am expecting the bullish trend to continue!
HBARUSDT
The purple support zone within the price range of $0.232 has been tested multiple times so far. If this support area is breached, we expect the bearish trend to continue towards lower levels.
Upon closer examination, we observe that the resistance zone at $0.3484 has not yet been tested, and the momentum of the bearish trend has been stronger. Once the purple support zone is consumed, the bearish scenario will be further confirmed.
What’s your opinion?

GBPAUD BUTTERFLY PATTERN Harmonic Pattern Trading Strategy:
1. Combine patterns with 2-3 confirmations (e.g., MA, BB, RSI, Stoch) for increased accuracy.
2. Implement proper risk management.
3. Limit exposure to 3% of capital per trade.
4. Exercise caution: Not every Harmonic Pattern presents a good trading opportunity.
5. Conduct thorough diligence and analysis before trading.
Disciplined approach = Enhanced edge.

FTSE 100 futures: Buy the dip for resistance retest?FTSE futures continue to coil in a triangle pattern dating back nearly a year. While that suggests we may eventually see a decisive break at some point, today’s setup looks at playing the existing range.
The price has been well supported on dips towards and through 8200 recently, bouncing on four consecutive occasions.
Considering the price action, one setup to consider would be to buy above this level with a stop beneath Tuesday’s low for protection.
Despite recent weakness, momentum indicators like RSI (14) and MACD continue to trend higher, making the preference to buy dips over selling rips.
The January 9 high is one potential target, another triangle resistance located just below 8400.
Good luck!
DS

EURUSD looks very bullish EURUSD after falling for few weeks, in daily time frame has made several bullish divergences on RSI and now looks ready to raise IMO

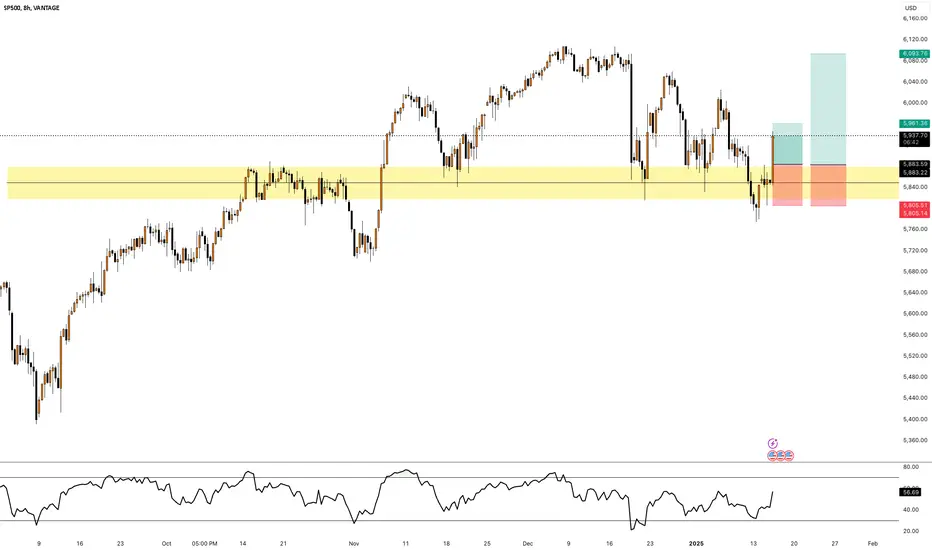
S&P 500: Recent ventures below 5900 have not last longRecent ventures below 5900 have not last long, as demonstrated by the string of long downside wicks on the dailies in November and December. With a pin candle printing Monday following a bounce off 5808, a close above 5900 on Tuesday would generate a bullish setup heading into Wednesday’s inflation report.
If the price can push through 5900, longs could be established above with a tight stop beneath for protection. The 50-day moving average and downtrend running from the record highs are two potential targets.
Of note, RSI (14) has broken its downtrend, hinting bearish momentum may be starting to shift, although the signal is yet to be confirmed by MACD which continues to trend lower.
Good luck!
DS

CAD/JPY - Bullish ContinuationFX:CADJPY has been experiencing a bullish trend and I am expecting this to continue. This is evidenced by simple price action on 4 hr and printing of higher highs and higher lows!

NAS100USDNow on my recent analysis for S&P500, we looking for bears, however here we may be having a bullish flag or compression continuation pattern. If my wave count is correct, then based on historical pullbacks on this chart, we may be correct with the continuation pattern which should pull back towards the 0.5 Fib area. Safer to still look for selling opportunities as currently we have a lowe new low, after breaking the price marked/indicated in blue on the chart/annotation.

Progressive Corp Progressively Degrading. PGRThere is a confirmation of short enter with break of the most recent lows. Fibs are indicative of some of the goals. I've decided to bring this example forward, as it is evident how a pure indicator based approach would be detrimental. In this case, you would thing the position in building stochastically and volatility wise giving a false sense of a likely long. Always consider price action beyond the pure mechanical indicator based approach, which are almost always of the lagging variety.

RSI bullish divergence for bounce at support ~92kHigh risk trade I would take there for a nice short bounce up to 93.5

USD/JPY: Signs of Exhaustion Amid Yield and RSI DivergenceWhile USD/JPY remains strongly correlated with yields in the belly of the US Treasury curve, that’s not translated to explosive upside recently, a noticeable departure from the trend seen in previous months where rising yields saw dollar-yen rip higher.
With the pair unable to hold gains despite the blowout nonfarm payrolls report last Friday, the price action hints of fatigue following the substantial bullish run from the September lows. The inability to follow US Treasury yields higher may also be a sign carry trade flows may be slowing or even stalling.
RSI (14) has diverged from price over the past month, and with MACD generating a fresh bearish signal, it points to waning bullish momentum, potentially increasing the risk we may see some form of bearish reversal.
With dips below 157 bought over the calendar turn, the risk-reward of going short around current levels does not screen as compelling, suggesting those considering bearish trades may want to wait for a potential retest of Friday’s high of 158.88 before initiating trades.
If the price were to be rejected again at this level, it would generate a decent setup, allowing for shorts to be established beneath the level with a tight stop above for protection. 155.89 would be a potential trade target.

ARBUSDTHi guys
The main trend is downward. We have not yet received confirmation of a trend change and the bullish outlook is very weak for now.
But on the daily and four-hour time frames, we have a positive RSI divergence.
And provided that the downward trend line is broken and the resistance range of $0.893 is consumed, the possibility of the continuation of the upward trend is strengthened.
What do you think?

Another chance to convert ETH into KASPA at a discount?Been monitoring this chart since 25th December 2025 waiting for a second chance to convert even more ETH into KASPA for cheap.
Measured move in confluence with the bottom yellow solid support line as shown.
Likely if KAS falls below the dashed yellow line vs ETH.

January 2024 technicals are almost matching January 2025Currently, it looks like the current january technicals are lining up to the january 2024 technicals. There was a 20 percent correction before the pump.
This aligns with my previous analysis that we will have a needed correction before next move up. We still haven't has a 20% correction since the manipilation of the trump pump from nov 4th

Restesting ~93.7Clear divergence on 15 min rsi with last one within zone, so expecting a short correction

GOLD - we reached strong resistance, time for correctionHi guys, with our previous great analysis on GOLD we are coming back at it.
Currently the price has reached a strong key resistance level at 2680 mark.
The RSI is sitting in very overbought levels on 1H and 4H time frames
Currently we would be targeting the strong demand zone at 2620 area.
Entry: 2680
Target 2620
As always my friends happy trading!
P.S. If you have questions or inquiries about one of my existing set-ups or personal questions / 1 on 1 sessions consider joining my community so you can follow up with me in private!


Recovering on Morgan Stanley. MSCross of both MIDAS and Ehler's US line, with upgoing momentum and suspect B wave formation. Stochastic and volatility factors are both upgoing.
Not financial advice, do your own research.

Drop on ServiceNow Inc on the Radar. NOWA five wave Elliott impulse appearing to be reaching conclusion. There is a cross of Ehler's Smoother, and Stochastic and volatility zone indicators have already turned. This is a less reliable picture, as the momentum only appears to be growing. It is prudent to stay mindful of the fact that no confirmatory levels have been crossed.
We are not in the business of getting every prediction right, no one ever does and that is not the aim of the game. The Fibonacci targets are highlighted in green or purple with invalidation in red. Confirmation level, where relevant, is a pink dotted, finite line.
Fibonacci goals, it is prudent to suggest, are nothing more than mere fractally evident and therefore statistically likely levels that the market will go to. Having said that, the market will always do what it wants and always has a mind of its own. Therefore, none of this is financial advice, so do your own research and rely only on your own analysis.
Professionally, we are big fans of any indicators from Jurik, De Mark and Ehlers, which we use in addendum in analysis prior to putting down positions.
We prefer a combination of at least four technical factors to favor a particular stance. A stance is never decided by this constellation, rather the constellation merely confirms the stance.
Trading is a true one man sport. No single confluence of indicators is truly good enough, and a professional trader's sense must be developed through a lot of hard work and over a significant period of time. Good luck out there and stay safe.

Downward for Exxon Mobil. XOMPicture is highly suggestive of an Elliott downward impulse, with wave 5 remaining. Momentum is certainly building, indicators are about to turn.
The narrow price action in the most recent candles are highly suspect for a wave 4 in the undergoing impulse. Fibtime is not excluding the possibility of Wave 5 yet.
We are not in the business of getting every prediction right, no one ever does and that is not the aim of the game. The Fibonacci targets are highlighted in green or purple with invalidation in red. Confirmation level, where relevant, is a pink dotted, finite line.
Fibonacci goals, it is prudent to suggest, are nothing more than mere fractally evident and therefore statistically likely levels that the market will go to. Having said that, the market will always do what it wants and always has a mind of its own. Therefore, none of this is financial advice, so do your own research and rely only on your own analysis.
Professionally, we are big fans of any indicators from Jurik, De Mark and Ehlers, which we use in addendum in analysis prior to putting down positions.
We prefer a combination of at least four technical factors to favor a particular stance. A stance is never decided by this constellation, rather the constellation merely confirms the stance.
Trading is a true one man sport. No single confluence of indicators is truly good enough, and a professional trader's sense must be developed through a lot of hard work and over a significant period of time. Good luck out there and stay safe.
