Costco Wave Analysis – 5 June 2025
- Costco reversed from the resistance zone
- Likely to fall to support level 985.00
Costco recently reversed down sharply from the resistance zone located between the key resistance 1080.00 (which stopped the previous impulse wave 5) and the upper weekly Bollinger Band.
The downward reversal from this resistance zone stopped the earlier weekly impulse wave 5 from April.
Given the strength of the nearby resistance zone and the bearish divergence on the weekly momentum indicator, Costco can be expected to fall to the next support level 985.00.
M-oscillator

Momentum Still HighDid not expect this deep fall today. But as the momentum is still high I don't think that the decline is over already. There are some fine targets waiting to be reached lower.
The mood is bearish anyway.

Target Sputters as Market Recovers Target has sputtered as the broader market recovers, and some traders may think the retailer has further downside risk.
The first pattern on today’s chart is the steady decline between early February and early April. TGT tried to stabilize after the move but barely rebounded. It also failed to hold the rally on May 12 after Treasury Secretary Scott Bessent cut tariffs on China. That feeble price action may suggest sellers remain in control.
Second, the stock spent about a month at its 50-day simple moving average (SMA) early this year before continuing lower. It’s now spent about three weeks at the same line without closing above it. Is the intermediate-term trend still bearish?
Third, the move between April 8 and May 20 may be viewed as a potentially bearish flag that’s now broken to the downside.
Next, the 8-day exponential moving average (EMA) recently crossed below the 21-day EMA. MACD has also turned negative. Those patterns may reflect a bearish short-term trend.
Finally, TGT is an active underlier in the options market. (It averages more than 70,000 contracts per day, according to TradeStation data.) That could help traders take positions with calls and puts.
Check out TradingView's The Leap competition sponsored by TradeStation.
TradeStation has, for decades, advanced the trading industry, providing access to stocks, options and futures. If you're born to trade, we could be for you. See our Overview for more.
Past performance, whether actual or indicated by historical tests of strategies, is no guarantee of future performance or success. There is a possibility that you may sustain a loss equal to or greater than your entire investment regardless of which asset class you trade (equities, options or futures); therefore, you should not invest or risk money that you cannot afford to lose. Online trading is not suitable for all investors. View the document titled Characteristics and Risks of Standardized Options at www.TradeStation.com . Before trading any asset class, customers must read the relevant risk disclosure statements on www.TradeStation.com . System access and trade placement and execution may be delayed or fail due to market volatility and volume, quote delays, system and software errors, Internet traffic, outages and other factors.
Securities and futures trading is offered to self-directed customers by TradeStation Securities, Inc., a broker-dealer registered with the Securities and Exchange Commission and a futures commission merchant licensed with the Commodity Futures Trading Commission). TradeStation Securities is a member of the Financial Industry Regulatory Authority, the National Futures Association, and a number of exchanges.
Options trading is not suitable for all investors. Your TradeStation Securities’ account application to trade options will be considered and approved or disapproved based on all relevant factors, including your trading experience. See www.TradeStation.com . Visit www.TradeStation.com for full details on the costs and fees associated with options.
Margin trading involves risks, and it is important that you fully understand those risks before trading on margin. The Margin Disclosure Statement outlines many of those risks, including that you can lose more funds than you deposit in your margin account; your brokerage firm can force the sale of securities in your account; your brokerage firm can sell your securities without contacting you; and you are not entitled to an extension of time on a margin call. Review the Margin Disclosure Statement at www.TradeStation.com .
TradeStation Securities, Inc. and TradeStation Technologies, Inc. are each wholly owned subsidiaries of TradeStation Group, Inc., both operating, and providing products and services, under the TradeStation brand and trademark. When applying for, or purchasing, accounts, subscriptions, products and services, it is important that you know which company you will be dealing with. Visit www.TradeStation.com for further important information explaining what this means.

XAUUSD (Gold) – Bearish Setup in Play | H1 Wave Count + AO Dive🟡 XAUUSD (Gold) – Bearish Setup in Play | H1 Wave Count + AO Divergence 🟡
🗓️ Date: June 5, 2025
📉 Timeframe: 1H
🔍 Elliott Wave Count:
The current structure appears to have completed a classic 5-wave impulse.
Wave (5) has just printed, and notably, Awesome Oscillator (AO) confirms a divergence:
Wave 3 had a higher AO peak than Wave 5, signaling bearish momentum loss.
This divergence is a strong reversal signal, often preceding a corrective move (ABC).
📊 Technical Confluence:
Price is now entering a key Supply and Demand (SND) zone between 3401 – 3414, an area that previously caused a strong rejection.
Multiple Fibonacci extensions also cluster near this level:
1.618 and 2.618 extensions align closely with current highs.
These confluences further strengthen the sell bias.
📉 Trade Idea:
🎯 Bias: Bearish
📍 Entry Zone: Around 3401 – 3414
❗ Confirmation: Look for bearish engulfing candle or breakdown from rising wedge
🎯 First Target: 3372 (Fib 0.618 retracement of wave 4–5)
🎯 Second Target: 3357 or deeper if larger correction unfolds
❌ Invalidation: Break and close above 3418
🧠 AO Divergence Reminder:
Divergence between price and oscillator like AO (lower momentum on a higher high) often signals exhaustion of trend — perfect timing for contrarian plays at strong SND zones.
📌 Summary:
Wave (5) completion with AO divergence near a significant SND zone (3414–3401) sets the stage for a high-probability short trade. Monitor lower timeframes for entry triggers.

Skeptic | SPX 500 Analysis: Long Triggers Ready to Rip!Hey, what’s good? It’s Skeptic! 😎 Last week, we scored a nice R/R on SPX 500, and now it’s looking ready for another big move, super close to our long trigger. Let’s check it out with a multi-timeframe breakdown to grab those long and short triggers!
Daily Timeframe: The Big View
The SPX was riding a strong bullish wave, then hit a deep correction. Here’s what’s up:
It’s bounced back most of that drop and is nearing its ceiling at 6128.55. 🏔️
A break and hold above 6128.55 could kick the bullish trend into high gear, per Dow Theory.
Watch the daily RSI—if it goes overbought, we might see a fast, big rally. 🚀
This is our long-term play, so let’s zoom in for the short-term action!
4-Hour Timeframe: Long & Short Triggers
On the 4-hour chart, here’s the plan for our trades:
Long Trigger: Break above 5990.67, with RSI above 66.57 to show the move’s got juice.
Stop Loss: Your choice—put it below 5955.77, or check 1H or 15-minute charts for a tighter stop under the last low. 🎯
Short Trigger: A drop below 5856.93 lets you short, but it’s against the trend, so keep it low-risk. Take profits quick, use a small stop loss, and close when you hit a good R/R. ⚠️
Shorts are tricky here, so play it safe and don’t go all-in!
RSI Trick & Your Input
Love RSI? I’ve been using it forever, and I think most guides get it wrong. They say overbought RSI means sell, but for me, it’s a go sign for longs! Want a full RSI tutorial? Tell me in the comments, and I’ll hook you up! 📢
💬 Let’s Talk!
If this got you hyped, hit that boost—it helps a ton! 😊 Got another pair or setup you want me to hit? Drop it in the comments. Thanks for chilling with me—keep trading smart! ✌️

NZD/USD: Bullish signals build ahead of U.S. data gauntletNZD/USD is holding an established uptrend with bullish momentum building, supported by strengthening RSI and MACD signals. The pair is testing key resistance at .6050—a level that’s capped price repeatedly over the years.
A break and close above would confirm a bullish setup, allowing for longs to be established above the level with a stop just beneath. Initial resistance comes in at .6110, with scope for a move towards .6200 if momentum continues.
Good luck!
DS

EWTSU EURUSD H4 minute ((iv)) update
Elliott Wave trade set up h4
to confirme the end of wxy corrective pattern
price must break out definitively in an impulsive mode the 1'1270 area,
heading and pass trought decisively 1.1375 area
to get to area 1.1460
invalidation: price under 1.1160

EWTSU XAUUSD H4 subminuette iv update
Elliott Wave Trade Set Up H4 subminuette iv update
to confirme the end of wxy corrective pattern
price must break out definitively in an impulsive mode the 3435 level
right now submicro wave (3) looks in progress - target 3367
invalidation: first level of alarm - price under 3227

S&P 500: Coiling Tight as Bulls Eye 6000 BreakIf at first you don’t succeed, try, try again.
I suspect that’s what S&P 500 bulls are contemplating when it comes to clearing the psychologically important 6000 level in futures—although this time may meet with more success than when last tested in late May.
Coiling within an ascending triangle pattern, and with bullish momentum starting to flick higher again, the ducks are starting to line up for a possible topside break.
If the price can pierce 6000 and take out the May 29 high, consider establishing longs with a stop beneath 6000 for protection against reversal. Some resistance may be encountered at 6100, although the obvious target for bulls will be to take out the record high set in February.
Should the price be unable to clear 6000 and break uptrend support running from the May 23 low, it would favour range trade down to support at 5740.
Good luck!
DS

NZDUSD Wave Analysis – 3 June 2025
- NZDUSD reversed from the resistance zone
- Likely to fall to support level 0.5900
NZDUSD currency pair recently reversed down from the resistance zone between the resistance level 0.6030 (which has been reversing the price from November), the upper daily Bollinger Band and the 61.8% Fibonacci correction of the downward impulse from September.
The downward reversal from this resistance zone stopped the C-wave of the previous ABC correction (2).
Given the strength of the resistance level of 0.6030 and the bearish divergence on the daily Stochastic, the NZDUSD currency pair can be expected to fall to the next support level of 0.5900.

Why I Think USDJPY Will Sell...Technical AnalysisHey Rich Friends,
Happy Tuesday! I wanted to share my USDJPY analysis and why I think it will sell. This is only a technical analysis so please check the news and cross-reference your own charts. Here is what I am looking at:
- Momentum is picking up for the sellers with red candles forming on H4, H1 and M15.
- The stoch is facing down, both lines have crossed below 80, slow line (orange) is above the fast line (blue) which is a bearish confirmation for me.
Additional information:
- I will also wait to see if both lines of the stoch cross below 50 to confirm the down trend.
- I will be setting sell stops and using previous highs as my SL and previous lows as my TPs.
Good luck if you decide to take this trade, let me know how it goes.
Peace and Profits,
Cha

Is this it?A perfect bounce off all support lines for OTHERS.D. Technically, this has to be the start of altseason.

GBPJPY 1H Analysis – Bullish Breakout from Ending Diagonal + AO Pair: GBP/JPY
Timeframe: 1H
Structure: Wave 5 Ending Diagonal + Bullish Divergence on AO
Hi traders! Here’s an update on GBPJPY from the 1H chart.
After a strong bearish move, price formed a falling wedge (ending diagonal) pattern, indicating exhaustion in the downtrend. This pattern completed with a final Wave 5 that showed significant weakness — and here’s the key signal:
🔍 Bullish Divergence Spotted
While price made a new lower low (Wave 5), the Awesome Oscillator (AO) printed a higher low. This classic bullish divergence hints that bearish momentum is fading and a potential reversal is in play.
📈 Breakout Confirmation
Price has now broken above the wedge and the 1.0 Fibonacci level (~193.67), confirming the breakout and early bullish momentum. We’re currently seeing price pushing up with strong momentum candles.
🎯 Potential Targets Based on Fibonacci Extensions:
• 1.618 – 194.60 (first resistance / TP1)
• 2.618 – 195.35 (TP2)
• 4.236 – 196.45 (extended TP3 if trend continues)
🛑 Key Support:
• 193.00 zone – ideally price should stay above this level to maintain bullish bias.
🧠 Summary:
• Falling wedge (ending diagonal) completed as Wave 5
• AO bullish divergence signals weakening sell pressure
• Breakout confirmed above 193.70
• Watching for continuation toward 194.60 and 195.30+
📌 I’ll be watching for a potential pullback above 193.70 for a high-probability reentry opportunity. Always manage your risk and trade what you see.
Let me know your thoughts in the comments below! 📥
#GBPJPY #ForexAnalysis #PriceAction #ElliottWave #AO #Breakout #Fibonacci #TechnicalAnalysis #Wave5

The return of the ICO. AI Style?Virtuals Genesis Launches is one of the most interesting things I have seen in a long time. The Virgen points system is really well done. Allowing projects to both raise the starting capital they want as well as getting a lot of smaller holders that can be early users/promoters. All the attention Virtuals got previously was from the Prototype Agents setup. That setup is honestly kind of garbage. My goal is to farm points and get small exposure to a lot of AI start-up ideas. Many of these will fail but a lot of them are really trying to build something interesting. Unlike IPO's it allows small investors to back projects early. Typically the range seems to be 0.01 to 566 Virtual. That's roughly 2 cents to $1132.
Found support above 34 EMA around $1.80.
MACD is trending down on the daily chart now.
RSI is heading down.
STOCH RSI is also not showing anything bullish currently.
Though I am holding spot Virtuals, there is a lot of evidence to show price could go down here. There is currently not a lot of great news for bulls.
Disclaimer: The information provided in this post is for educational and informational purposes only. It does not constitute financial advice, investment recommendations, or a solicitation to buy or sell any financial instruments. All investments involve risk, and the past performance of a security, market, or trading strategy does not guarantee future results. I am not a financial advisor. Please conduct your own thorough research and consult with a qualified financial professional before making any investment decisions. You are solely responsible for any investment decisions you make.

Cookie the AI alpha seeker.Cookie is a very interesting application. Like Coingecko for AI Crypto projects. I am seeing other platforms build their insights into their websites. A change in regulatory environment has allowed AI projects to come out in a way that has not been seen since ICO era. What has changed is it become viable to publicly fund projects again without fear of regulators. As regulatory bodies in the US like the SEC, seen as hostile to crypto last year are now much more friendly. At #382 on CoinGecko this project is still relatively small. People who want to find and buy AI projects definitely want Cookie as a data source.
The chart is beautiful for Long positions. You have very clean trend of higher highs and higher lows. While riding on the moving averages. I am using 8 SMA, 21 EMA, 34 EMA, 50 SMA, and 200 SMA. With a previous price low around 15 cents, the price needs to remain above that level.
MACD is moving up consistently with the price action. I am not seeing anything concerning here. As I am interested in day and week trends not intraday trades.
With a previous high of 78, there is still a lot of room to work with.
Looks like this could be just the start of this move.
Disclaimer: The information provided in this post is for educational and informational purposes only. It does not constitute financial advice, investment recommendations, or a solicitation to buy or sell any financial instruments. All investments involve risk, and the past performance of a security, market, or trading strategy does not guarantee future results. I am not a financial advisor. Please conduct your own thorough research and consult with a qualified financial professional before making any investment decisions. You are solely responsible for any investment decisions you make.

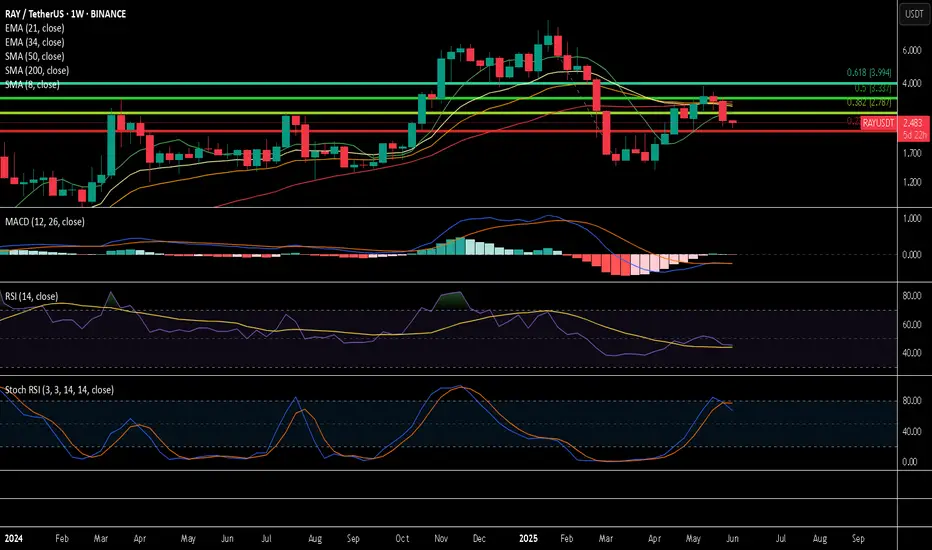
RAY the end or just the start?To first look at Ray we can start with RAYUSDT and move to RAYSOL and RAY BTC.
RAY is not sitting below all of the moving averages. Not an ideal position.
So far MACD cross down does not mean much as the week has not ended yet. Ideally to stay bullish it need to end the week not crossed down.
Stoch RSI cross down
Below 0.015 there is elevated risk that RAYSOL puts in a lower local low.
RAYBTC also not looking great.
With these charts it's pretty hard to make the case why I am long RAY. Let's try some long term fundamentals and see if that is a better picture.
Ray is all about the saying own the shovels. As an exchange the better Solana does the better Ray likely does. It's a widely known DEX it's weaknesses are Solana not getting trade volumes again. Competitors where other DEX are better. Also DEX aggregators have risks the volume does not get sent to Ray.
Disclaimer: The information provided in this post is for educational and informational purposes only. It does not constitute financial advice, investment recommendations, or a solicitation to buy or sell any financial instruments. All investments involve risk, and the past performance of a security, market, or trading strategy does not guarantee future results. I am not a financial advisor. Please conduct your own thorough research and consult with a qualified financial professional before making any investment decisions. You are solely responsible for any investment decisions you make.
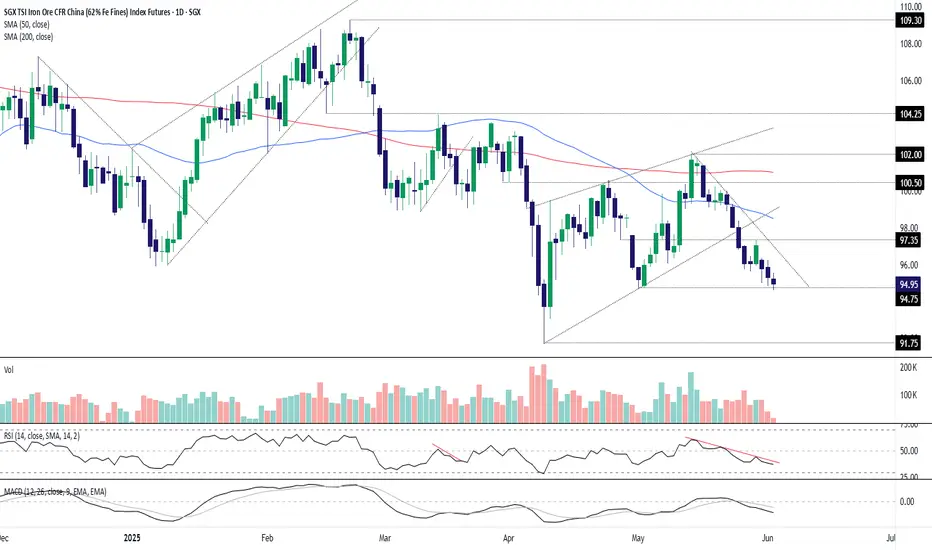
Bearish Iron Ore Bias Intact, Watching $94.75SGX iron ore looks heavy, threatening to extend the bearish break that began a week ago. The test and rejection at horizontal resistance at $97.35 last Thursday only adds to the bearish picture from momentum indicators like RSI (14) and MACD, reinforcing the bias to sell pops and downside breaks.
The price now finds itself at an interesting spot on the charts, sitting just above $94.75 after briefly dipping below it during thin overnight trade on Monday. While the bias remains lower, subdued volumes on either side of the weekend serve as a warning not to get overly bearish without a clear catalyst.
If the price can take out the overnight low and hold below $94.75, consider initiating shorts beneath the level with a stop above, targeting a potential retest of the April 9 low at $91.75.
Alternatively, if $94.75 continues to attract buyers, the setup could be flipped with longs established above the level with a stop beneath for protection. Downtrend resistance kicks in around $97, just above resistance at $97.35. They’re two potential targets.
Good luck!
DS
Gold Bulls Back in Control After BreakoutHaving broken triangle resistance stemming from the record highs and cleared horizontal resistance at $3367, things are once again looking bullish for bullion. Add in renewed upward momentum in RSI (14) and a bullish MACD crossover, and the preference remains to buy dips and topside breaks.
$3367 now looms as a key level to build bullish setups around, offering a logical area to establish longs with a stop beneath for protection. It would be preferable to see gold retest and bounce off $3367 before entering the trade.
$3434 screens as an initial upside target, with a clean break likely to put gold on a collision course with the record highs at $3500.
Good luck!
DS

Kurzer Recap der Tradeidee vom letzten THE LEAPTrade setzte auf eine Trendwende nach dem Abwärtstrend – klassisches Trendbruch-Szenario.
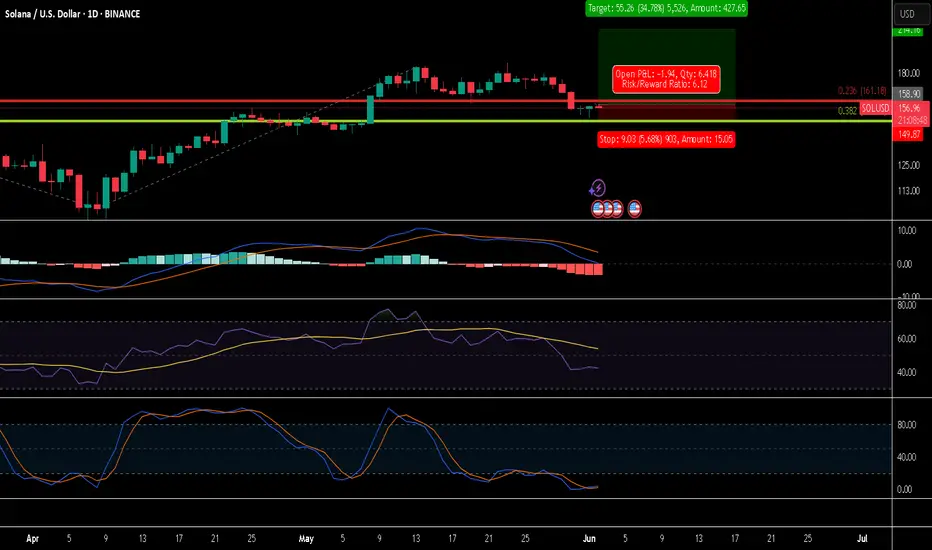
Will Solana continue to grow?I am definitely admittedly late to the party with Solana. Though I was very correct about the ride down to $8 and did not own any Solana for that. I was also wrong about The Return of Solana.
During the ride down from ~$300 to ~$100 I was able to get some Solana. Though most of it is liquid staked Solana now.
As seen in the image I think currently what makes the most sense is this being a pullback of the last rally in Solana.
I think focusing on daily Stoch RSI is more interesting currently then MACD and RSI. Looking to stay above 0.382 FIB above while also seeing Stoch RSI move up. If either of those fail then my current thinking must be reconsidered. As I am looking at typically weekly/daily spot moves the risks are different then people using leverage. Even if I use really small amounts of leverage to get 1.01, 1.10, etc. returns but not 10x leverage as an example.
Pros
Solana is seeing a lot of use
VC investors are likely try and push Solana to their peers, friends, etc.
Drift seems to have more feature as a DEX then most of what I have seen on Ethereum and ETH L2's. Especially spot Pro Orders is really interesting feature that I don't see anywhere else.
Solscan was total garbage previously but it seems better then Etherscan now. Like the kept adding feature and Etherscan did not change much. Look at Analytics and Portfolio tabs.
Raydium is another interesting DEX. Portfolio page has nice UI.
Focus on working products rather then design theory and posturing about ideal world setup.
If retail feels like they missed out on Bitcoin buying Solana seems like a likely path.
Cons
Pump fun was a lot of the network activity
Not seeing enough content on using Solana Apps
Does not have the same decentralization and other crypto principles built into the community that Ethereum has. While short term it's a pro long term if your not careful where your going you can end up where you don't want to be.
Not financial advice. DYOR.
HA-RSI + Stochastic Ribbon: The Hidden Gem for Trend & MomentumNavigating volatile markets requires more than just raw price action. The Heikin Ashi RSI Oscillator blends the power of smoothed candlesticks with momentum insights to give traders a clearer picture of trend strength and reversals.
At Xuantify , we use the Heikin Ashi RSI Oscillator as a hybrid momentum and trend tool. While the indicator calculations are based on Heikin Ashi values to smooth out noise and better capture trend dynamics, the chart itself displays standard candlesticks (real price data) . This ensures that all signals are aligned with actual market structure, making it easier to execute trades with confidence and clarity.
This dual-layer approach gives us the best of both worlds: clarity from smoothing and precision from real price action. MEXC:SOLUSDT.P
🧠 How We Use It at Xuantify
At Xuantify , we integrate the Heikin Ashi RSI Oscillator into our multi-layered strategy framework. It acts as a trend confirmation filter and a momentum divergence detector , helping us avoid false breakouts and time entries with greater precision. We pair it with volume and volatility metrics to validate signals and reduce noise. Note the Stochastic Ribbon Overlay as shown in the chart, very accurate for momentum.
⭐ Key Features
Heikin Ashi Smoothing : Filters out market noise for clearer trend visualization.
RSI-Based Oscillation : Measures momentum shifts with precision.
Color-Coded Bars : Instantly identify bullish/bearish momentum.
Dynamic Signal Zones : Customizable overbought/oversold thresholds.
Stochastic Ribbon Overlay : A powerful multi-line stochastic system that enhances momentum analysis and trend continuation signals.
💡 Benefits Compared to Other Indicators
Less Whipsaw : Heikin Ashi smoothing reduces false signals common in traditional RSI.
Dual Insight : Combines trend and momentum in one visual.
Better Divergence Detection : Easier to spot hidden and regular divergences.
Visual Simplicity : Clean, intuitive design for faster decision-making.
⚙️ Settings That Matter
RSI Length : Default is 14, but we often test 10 or 21 for different timeframes.
Smoothing Type : EMA vs. SMA – EMA reacts faster, SMA is smoother.
Overbought/Oversold Levels : 70/30 is standard, but 80/20 can reduce noise in trending markets.
📊 Enhancing Signal Accuracy
Combine with Volume Oscillators to confirm momentum strength.
Use Price Action Zones to validate oscillator signals.
Look for Divergences between price and oscillator for early reversal clues.
🧩 Best Combinations with This Indicator
MACD : For cross-confirmation of momentum shifts.
Bollinger Bands : To identify volatility squeezes and breakouts.
Support/Resistance Levels : For contextual trade entries and exits.
⚠️ What to Watch Out For
Lag in Strong Trends : Like all smoothed indicators, it may react slightly late.
Over-Optimization : Avoid curve-fitting settings to past data.
Standalone Use : Best used in conjunction with other tools, not in isolation.
🚀 Final Thoughts
The Heikin Ashi RSI Oscillator is a powerful hybrid tool that simplifies complex market behavior into actionable insights. At Xuantify, it’s a core part of our strategy toolkit, helping us stay ahead of the curve with clarity and confidence.
🔔 Follow us for more educational insights and strategy breakdowns!
We regularly share deep dives into indicators, trading psychology, and backtested strategies. Stay tuned and level up your trading game with us!

SMI vs. Stochastic: Which One Gives You the Edge?Momentum indicators are essential tools in every trader’s arsenal—but not all are created equal. While the Stochastic Oscillator has been a go-to for decades, the Stochastic Momentum Index (SMI) offers a more refined and reliable way to read market momentum.
In this post, we’ll break down the key differences between these two indicators, how we use them at Xuantify , and why the SMI might just give you the edge you’ve been looking for.
🧠 How We Use It at Xuantify
We’re always looking for tools that offer greater precision and less noise . While the Stochastic Oscillator is one of the most commonly used tools for spotting overbought and oversold conditions, the Stochastic Momentum Index (SMI) gives us a clearer, smoother view of momentum —especially in volatile or choppy markets.
We use the SMI to refine our entries and exits , particularly when trading breakouts or reversals. MEXC:ETHUSDT.P
⭐ Key Features
Stochastic Oscillator : Measures the closing price relative to the high-low range. Simple and responsive. Great for spotting short-term reversals.
Stochastic Momentum Index (SMI) : Measures the distance of the current close from the midpoint of the high-low range. Smoother and more centered around zero. Better at filtering out false signals.
💡 Benefits Compared to Other Indicators
Stochastic Oscillator vs. SMI:
Signal Smoothness: Moderate vs. High
Noise Filtering: Low vs. Excellent
Centered Oscillation: No vs. Yes (around 0)
Best Use Case: Range-bound markets vs. Trend shifts & momentum confirmation
False Signal Risk: Higher vs. Lower
The SMI is especially useful when you want to avoid whipsaws and get a more reliable read on momentum .
⚙️ Settings That Matter
Stochastic Oscillator : %K = 14, %D = 3
SMI : Length = 14, Signal Smoothing = 3, Double Smoothing = 3
You can adjust the SMI smoothing values to match the volatility of the asset— lower smoothing for fast markets , higher for slower ones.
📊 Enhancing Signal Accuracy
Enhance SMI signals by combining them with:
Trend filters like EMAs or Supertrend
Volume confirmation
Support/resistance zones
Divergence spotting for early trend reversals
This layered approach helps us avoid false positives and stay aligned with the broader trend .
🧩 Best Combinations with This Indicator
SMI + EMA Crossovers: Confirm momentum with trend direction
SMI + RSI Divergence: Spot early reversals with confluence
SMI + Volume Profile: Validate momentum near key price levels
⚠️ What to Watch Out For
Lag in fast markets: SMI’s smoothing can delay signals slightly
Over-optimization: Avoid excessive tweaking of parameters
Not ideal alone: Best used with confluence tools for confirmation
🚀 Final Thoughts
The Stochastic Oscillator is a classic for a reason—but the Stochastic Momentum Index is a refined evolution . We’ve found that SMI gives us cleaner signals , better momentum clarity , and fewer false alarms —especially when paired with smart filters.
If you're looking to upgrade your momentum toolkit , the SMI might just be your edge.
🔔 Follow us for more educational insights and strategy breakdowns!
We break down indicators, strategies, and market psychology to help you trade smarter—not harder.

BTC might reverse hereThe MACD is looking bullish on the 4-hour timeframe. The last time this triggered a significant upmove.
